Combined Genome-Wide Linkage and Association Analyses of Fasting Glucose Level in Healthy Twins and Families of Korea
This study was undertaken to identify genetic polymorphisms that are associated with the risk of an elevated fasting glucose (FG) level using genome-wide analyses. We explored a quantitative trait locus (QTL) for FG level in a genome-wide study from a Korean twin- family cohort (the Healthy Twin Study) using a combined linkage and family-based association analysis approach. We investigated 1,754 individuals, which included 432 families and 219 pairs of monozygotic twins. Regions of chromosomes 2q23.3-2q31.1, 15q26.1-15q26.3, 16p12.1, and 20p13-20p12.2, were found to show evidence of linkage with FG level, and several markers in these regions were found to be significantly
associated with FG level using family-based or general association tests. In particular, a single-nucleotide polymorphism (rs6138953) on the PTPRA gene in the 20p13 region (combined P = 1.8 × 10⁻⁶) was found to be associated with FG level, and the PRKCB1 gene (in 16p12.1) to be possibly associated with FG level. In conclusion, multiple regions of chromosomes 2q23.3-2q31.1, 15q26.1-15q26.3, 16p12.1, and 20p13-20p12.2 are associated with FG level in our Korean twin-family cohort. The combined approach of genome-wide linkage and family-based association analysis is useful to identify novel or known genetic regions concerning FG level in a family cohort study.
Key Words: Fasting Glucose Level; Genome-Wide; Genetic Linkage; PRKCB1; PTPRA Young Ju Suh,1 SungHwan Kim,2
So Hun Kim,3 Jia Park,4 Hyun Ae Lim,4 Hyun Ju Park,4 Hangseok Choi,5 Daniel Ng,6 Mi Kyeong Lee,7 and Moonsuk Nam3,4
1Institute of Clinical Research, Inha University School of Medicine, Incheon, Korea; 2Department of Biostatistics, University of Pittsburg, PA, USA;
3Department of Internal Medicine, Inha University School of Medicine, Incheon; 4Clinical Trial Center, Inha University Hospital, Incheon; 5National Health Insurance Corporation, Seoul, Korea; 6Department of Epidemiology and Public Health, Yong Loo Lin School of Medicine, National University of Singapore, Singapore; 7Department of Epidemiology and Institute of Environment and Health, Seoul National University School of Public Health, Seoul, Korea
Received: 6 July 2012 Accepted: 4 January 2013 Address for Correspondence:
Moonsuk Nam, MD
Division of Endocrinology and Metabolism, Department of Internal Medicine, Inha University School of Medicine, 27 Inhang-ro, Jung-gu, Incheon 400-711, Korea Tel: +82.32-890-1101, Fax: +82.32-890-1120 E-mail: [email protected]
This work was supported by the Inha University Research grant (INHA-42825), by the Basic Science Research Program through the National Research Foundation of Korea (NRF) funded by the Ministry of Education, Science and Technology (grant no. 43466), by the Korea Healthcare Technology R&D Project Ministry of Health and Welfare (A070001and A102065), by Korea Centers for Disease Control and Prevention (4845-301,4851-302), and by an intramural grant from the Korea National Institute of Health (2009-E73001-00), the Republic of Korea.
http://dx.doi.org/10.3346/jkms.2013.28.3.415 • J Korean Med Sci 2013; 28: 415-423 Endocrinology, Nutrition & Metabolism
INTRODUCTION
Type 2 diabetes is a chronic disease that has a major impact on public health and is a major cause of morbidity and mortality.
However, the etiology of type 2 diabetes is not wholly under- stood, because type 2 diabetes is a complex disease that is in- fluenced by many risk factors (1, 2). Fasting glucose (FG) level is an important type 2 diabetes related trait. A chronically ele- vated FG level reflects a damaged glucose metabolism and is a crucial risk marker for type 2 diabetes (3).
Furthermore, the heritability of FG level has been reported to be in 17%-51% in the general population (4). Therefore, knowl- edge of genetic susceptibility for FG level would improve our
understanding of the risks of an impaired FG level and of type 2 diabetes.
Linkage and association analyses are the methods generally used to map genes that confer to susceptibility to complex dis- eases, such as, type 2 diabetes (5). Linkage analysis is performed on the joint distributions of trait and marker alleles in family members to determine whether a major gene associated with a familial trait is linked to a well-defined marker. Conversely, as- sociation analysis is useful for verifying susceptibility genes, in which the distributions of alleles at polymorphic markers are compared. Association studies are valuable for localizing regions of interest identified by linkage analysis. Recently, many re- searchers have performed linkage and association studies for
complex disease using high throughput screening tools, and single-nucleotide polymorphism (SNP) arrays provide one of the most powerful high throughput screening approaches to genome-wide studies (6).
Adding twins can enrich a family study. Dizygotic (DZ) twins are valuable to gene mapping studies as ideal sib-pairs (7). Al- though monozygotic (MZ) twins do not contribute to gene map- ping per se, the presence of them provides more precise discrim- ination between polygenic and shared environmental variance, which can potentially increase power of family-based regres- sion methods (8).
Aiming at identifying novel or known genetic variations con- cerning FG level, we analyzed associations between genetic polymorphisms and FG level using a genome-wide SNP array chip in this study. In addition, we explored the trait of FG level in a healthy, family cohort containing MZ twins using a com- bined linkage/family-based association analysis approach.
MATERIALS AND METHODS Population and data collection
In the present study, we used the Korean Healthy Twin study cohort data obtained from the Center for Genome Science at the Korean National Institute of Health. The aim of the Korean Healthy Twin cohort study was to explore genetic variation re- lated to complex traits and to study the effects of environment on the etiologies of complex diseases, in adult same-sex twin pairs aged 30-yr or older and their first-degree family members regardless of family size. Participants were recruited by placing advertisements in daily newspaper and by using a poster cam- paign in about 300 hospitals and governmental agencies. The study design used in the Korean Healthy Twin study cohort has been previously described in detail (9). Of the 2,124 subjects in the cohort, we investigated 1,754 individuals, which included 432 families and 219 pairs of MZ twins (female and male pairs) after excluding individuals without an FG level. Participants in the Healthy Twin Study that signed a consent form before en- rollment were interviewed by trained interviewers at each insti- tution, and general epidemiological and clinical data were re- corded. Subject weights and heights were also recorded, and blood samples were taken using standard protocols. Plasma glucose was assayed using a hexokinase enzymatic method.
Genotyping analysis
Genotyped data were obtained from the Center for Genome Science in the Korean Centers for Disease Control and Preven- tion. Sixteen short tandem repeat markers (15 autosomal short tandem repeat markers plus one sex-determining marker) were used to confirm sample identities for the twins (AmpFlSTR Iden- tifier Kit; PerkinElmer, Norwalk, CT, USA). Only if at least 15 of the 16 markers corresponded in each twin pair, was the pair
considered MZ (9). Microarray-based SNP genotyping was per- formed using the genome-wide human SNP array 6.0 chip (Af- fymetrix, Santa Clara, CA, USA). All genomic DNA samples were normalized to a concentration of 50 ng/μL. The Affymetrix stan- dard protocol was followed. Genomic DNA was digested using restriction enzymes such as Nsp I and Sty I and amplified by PCR.
We labeled the amplified genomic DNA using Streptavin, frag- mented it to be 50-200 bp, and hybridized it in the chip. Scanning was performed using a high-resolution Affymetrix GeneChip scanner 3000 7G. Image files were used to transfer the data into GCOS 1.4 for subsequent processing using G-TYPE 4.0 software.
Using V3 annotation for the genome-wide human SNP array 6.0 chip, a total of 906,600 SNPs and 946,000 copy number probes were genotyped per sample. Genotype calls were generated by a proprietary Birdseed 2.0 algorithm. Genotyped SNPs with a call rate of less than 95% were dropped. Monomorphic SNPs, SNPs with a minor allele frequency of < 0.01, or SNPs out of Hardy-Weinberg Equilibrium (P < 0.001) were filtered out. Fi- nally, 520,484 SNPs were subjected to further analyses.
Statistical analysis
We examined the relationships between FG levels and covari- ates, such as, age, sex, and body mass index (BMI), using Spear- man correlation coefficient test or Wilcoxon rank sum test (Mann- Whitney U test). Statistical analysis was performed using SAS version 9.1 (SAS Institute, Cary, NC, USA). Familial correlations of FG level between possible pairs in the pedigree and herita- bility of FG level were obtained using S.A.G.E. software, version 6.0.1 (http://darwin.cwru.edu/).
Combined genome-wide linkage analysis with peak wise as- sociation tests was performed to identify genetic markers of FG level. During the genome-wide linkage scan, multivariate regres- sion-based quantitative trait loci (QTL) analysis of the number of alleles identical by descent (IBD) at a given marker was per- formed on the squared sum and squared difference of FG level after adjusting for confounders, such as, age, sex, and BMI (10).
For adjusted FG level, we used regression residuals of log(FGmi) on age, sex, and BMI in family members i (i = 1, 2, …) within the mth family. We considered S = [Sij= (Xi + Xj)2] and D = [Dij= (Xi
+ Xj)2] as predictor variables, and Π = [(π^ij)] for the estimated proportion of alleles IBD π^ij (i≠j) as dependent variables in the multivariate regression model. MERLIN-REGRESS software (8) was used for extended regression based QTL analysis. For this analysis, we controlled overestimated genetic variance in the model caused by MZ twins sharing identical genotypes within pairs.
We next performed association studies for SNPs in linkage regions using a LOD score ≥ 1.3 in the genome-wide linkage analysis. We considered the T statistic of 2.45, which corresponds to a LOD score of 1.3, since 4.6 × LOD score is distributed as a 50-50 mixture of χ2 with 1 df and a point mass at 0 under the
null hypotheses of no linkage. We used two different associa- tion analysis approaches, that is, the family-based association test (FBAT) in all families and population-based tests of associ- ation in founders of each family, after adjusting for age, sex, and BMI to identify specific genetic loci associated with the risk of an increased FG level. Using FBAT, we merged each MZ twin’s pair as one subject by averaging traits, such as, BMI and FG level, of each MZ twin pair to adjust for possible overestimation of genetic variance in the model. FBAT under the additive model was used to allow both variations in a quantitative trait log(FG) and in covariates into a general score test of association in 1,535 subjects using FBAT software, version 2.0.3 (http://www.bio- stat.harvard.edu/~fbat/).
Population-based association tests under various modes of inheritance, including additive, dominant and recessive mod- els, and regression analyses of the log(FG) on interactive effects of significant SNPs were performed in 467 unrelated founders of each family using PLINK software, version 1.07 (http://pngu.
mgh.harvard.edu/purcell/plink/). Of the additive, dominant, and recessive models for each SNP-trait association, we selected the best genetic model based on Akaike’s information criterion (AIC). To combine two independent P values derived by FBAT and association analysis, we used Fisher’s method for combin- ing P values (11).
Ethics statement
The study protocol of the healthy twin study was approved by the institutional review board of the Seoul National University (IRB No. 144-2011-07-11). Informed consent was submitted by all participants.
RESULTS
Distribution of subject characteristics
Table 1 shows the distribution of subject characteristics for all families and founders of each family. Founders tended to be older and had a higher FG level than all families. Comparisons of FG levels in unrelated population of founders showed they were different by sex (P = 0.028 by Wilcoxon’s rank sum test), and significantly correlated with age and BMI (r = 0.132, P = 0.004 for age and r = 0.156, P < 0.001 for BMI by Spearman cor- relation coefficient analysis). The proportions of study popula- tion with a history of type 2 diabetes were 5.3% for all families and 12.6% for founders.
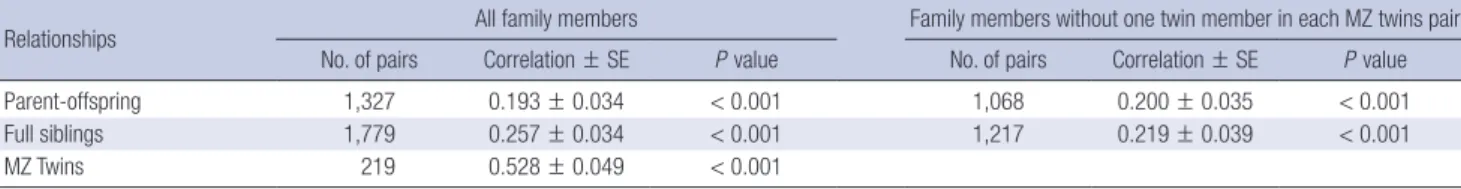
Familial correlations of FG level between two random vari- ables within nuclear family are shown in Table 2. Correlation estimate between MZ twins was moderately significant with r = 0.528 (SE = 0.049, P < 0.001), and was higher than that be- tween pairs of full siblings (r = 0.257, SE = 0.034). No large differ- ences were found between correlation estimates for all family members and families without one twin member in each pair of MZ twins. Heritability estimates for FG level were h2= 0.27 (SE = 0.07, P < 0.001) and adjusted h2= 0.47 (SE = 0.06, P <
0.001) (adjusting for age, sex and BMI). Without one member of twins in each pair of MZ twins, we obtained heritability estimates for FG level of h2= 0.31 (SE = 0.07, P < 0.001) and adjusted h2= 0.49 (SE = 0.06, P < 0.001) (adjusted for age, sex, and BMI).
Genome-wide linkage analysis
Initially, we performed an autosomal genome-wide linkage study for log(FG), after adjusting for age, sex, and BMI, using multi- Table 1. Distribution of study population characteristics
Parameters
All families Founders only
P value No. (%) or
Median (IQR)* FG level†
Median (IQR) No. (%) or
Median (IQR)* FG level† Median (IQR)
Age (yr) 40 (35-55) 60 (60-65) 0.004‡
Sex Male
Female 683 (38.9%)
1071 (61.1%) 94 (88-101)
89 (84-94) 176 (37.7%)
291 (62.3%) 95 (89-106)
93 (87-100) 0.028§
BMI (kg/m2) 23.6 (21.4-25.8) 24.7 (22.5-26.7) < 0.001‡
History of type 2 diabetes No
Yes 1659 (94.8%)
92 (5.3%) 90 (84-95)
123 (104.5-145) 408 (87.4%)
59 (12.6%) 92.5 (87-99)
115 (104-140) < 0.001§
Total (No.) 1,754 90 (85-96) 467 94 (88-101)
*No. (%) for categorical variables and Median (interquartile range) for continuous variables; †FG level: fasting glucose level (mg/dL); ‡P value as tested for Spearman correlation coefficient between the FG level and each variable; §P value as obtained by Wilcoxon rank sum test (Mann-Whitney U test) to test a difference of the FG level between two groups.
Table 2. Familial correlations of FG level between two random variables regarding each component of family members
Relationships All family members Family members without one twin member in each MZ twins pair
No. of pairs Correlation ± SE P value No. of pairs Correlation ± SE P value
Parent-offspring 1,327 0.193 ± 0.034 < 0.001 1,068 0.200 ± 0.035 < 0.001
Full siblings 1,779 0.257 ± 0.034 < 0.001 1,217 0.219 ± 0.039 < 0.001
MZ Twins 219 0.528 ± 0.049 < 0.001
LOD score
Chromosome 1 (Mb) 0 50 100 150 200 250 4
3 2 1 0
LOD score
Chromosome 3 (Mb)
0 50 100 150 200
4 3 2 1 0
LOD score
Chromosome 2 (Mb) 0 50 100 150 200 4
3 2 1 0
LOD score
Chromosome 4 (Mb)
0 50 100 150
4 3 2 1 0
LOD score
Chromosome 9 (Mb)
0 50 100
4 3 2 1 0
LOD score
Chromosome 11 (Mb)
0 50 100
4 3 2 1 0
LOD score
Chromosome 10 (Mb)
0 50 100
4 3 2 1 0
LOD score
Chromosome 12 (Mb)
0 50 100
4 3 2 1 0
LOD score
Chromosome 17 (Mb)
0 50
4 3 2 1 0
LOD score
Chromosome 19 (Mb) 0 50 4
3 2 1 0
LOD score
Chromosome 18 (Mb)
0 50
4 3 2 1 0
LOD score
Chromosome 20 (Mb) 0 50 4
3 2 1 0
LOD score
Chromosome 5 (Mb) 0 50 100 150 4
3 2 1 0
LOD score
Chromosome 7 (Mb)
0 50 100 150
4 3 2 1 0
LOD score
Chromosome 6 (Mb)
0 50 100 150
4 3 2 1 0
LOD score
Chromosome 8 (Mb)
0 50 100
4 3 2 1 0
LOD score
Chromosome 13 (Mb)
50 100
4 3 2 1 0
LOD score
Chromosome 15 (Mb)
50 100
4 3 2 1 0
LOD score
Chromosome 14 (Mb)
50 100
4 3 2 1 0
LOD score
Chromosome 16 (Mb)
0 50
4 3 2 1 0
LOD score
Chromosome 21 (Mb) 4
3 2 1 0
LOD score
Chromosome 22 (Mb) 4
3 2 1 0
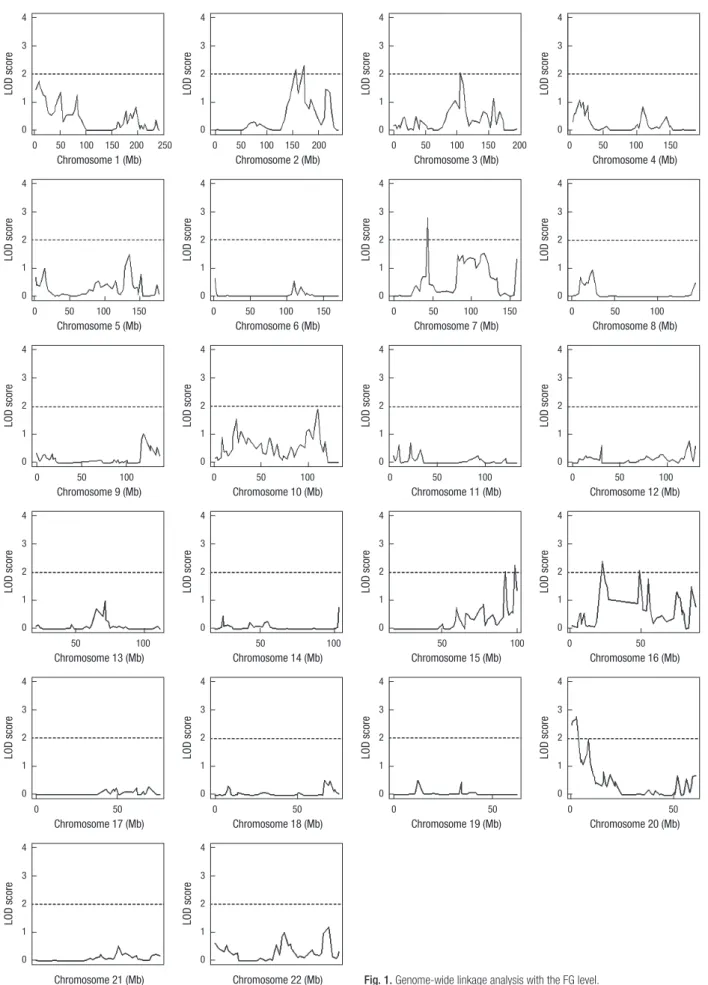
Fig. 1. Genome-wide linkage analysis with the FG level.
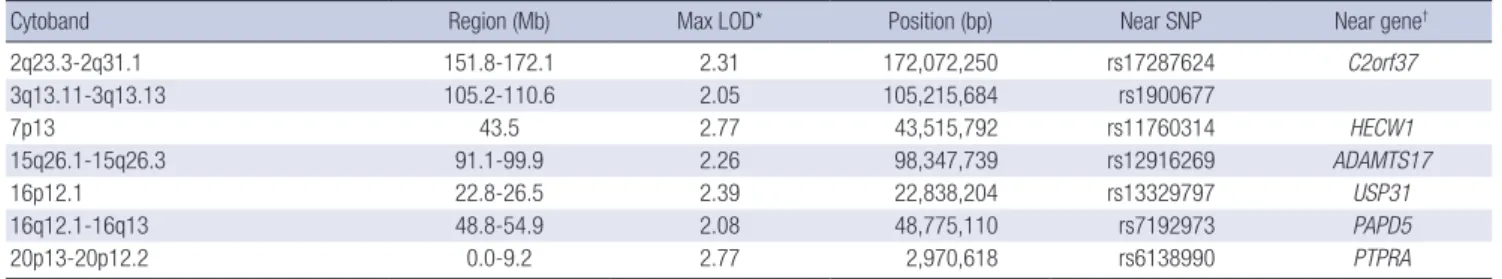
variate regression-based QTL analysis (10). We detected overall 7 peak regions in chromosomes 2, 3, 7, 15, 16, and 20 with signif- icant evidence of linkage with FG level by genome-wide linkage analysis (Fig. 1). Top linkage peaks with LODs of > 2 in each re- gion were located in chromosome 2q31.1 (172.1 Mb), 3q13.11 (105.2 Mb), 7p13 (43.5 Mb), 15q26.3 (98.3 Mb), 16p12.1 (22.8 Mb), 16q12.1 (48.8 Mb), and 20p13 (3.0 Mb), as shown in Table
3. Subsequently, we focused on SNPs in the 6 linkage regions of chromosomes 2q23.3-2q31.1, 3q13.11-3q13.13, 15q26.1-15q26.3, 16p12.1, 16q12.1-16q13, and 20p13-20p12.2 with relatively wide regions showing linkage (except for 7p13 in which only a small region showed linkage). Among these regions, we were able to find several well-known markers with significant evidence of linkage or association with FG level or risk of diabetes in the fol- Table 3. The regions for evidence of linkage for the FG level
Cytoband Region (Mb) Max LOD* Position (bp) Near SNP Near gene†
2q23.3-2q31.1 151.8-172.1 2.31 172,072,250 rs17287624 C2orf37
3q13.11-3q13.13 105.2-110.6 2.05 105,215,684 rs1900677
7p13 43.5 2.77 43,515,792 rs11760314 HECW1
15q26.1-15q26.3 91.1-99.9 2.26 98,347,739 rs12916269 ADAMTS17
16p12.1 22.8-26.5 2.39 22,838,204 rs13329797 USP31
16q12.1-16q13 48.8-54.9 2.08 48,775,110 rs7192973 PAPD5
20p13-20p12.2 0.0-9.2 2.77 2,970,618 rs6138990 PTPRA
*The peak LOD score within the corresponding linkage region; †The nearest gene to the corresponding marker.
Table 4. Linkage regions which include known markers with significant evidence of association or linkage
Significant linkage region Known markers associated with FG level or T2D
Cytoband Region (Mb) Max Marker* Position (bp) Near gene Trait† Test‡ Reference
2q23.3-2q31.1 151.8-172.1 2.33 rs10181181
rs2925757 rs12692588 rs7572970 rs1020731 rs1020732 rs12692592 rs4077463 rs7593730 rs4589705 rs1882347 D2S2330 D2S2345 rs560887 rs563694 rs575671 rs483234 rs3755157 rs853787 rs853778
160,795,657 160,809,415 160,832,428 160,844,902 160,852,301 160,852,485 160,871,627 160,874,480 160,879,700 160,884,382 164,116,560 166,405,837 168,428,635 169,471,394 169,482,317 169,489,064 169,490,820 169,500,417 169,510,498 169,519,470
RBMS1 RBMS1 RBMS1 RBMS1 RBMS1 RBMS1 RBMS1
B3GALT1 G6PC2 G6PC2/ABCB11
ABCB11 ABCB11 ABCB11 ABCB11 ABCB11
T2D T2D T2D T2D T2D T2D T2D T2D T2D T2D FG level
T2D T2D FG level FG level FG level FG level FG level FG level FG level
GWAS GWAS GWAS GWAS GWAS GWAS GWAS GWAS GWAS GWAS Linkage (LOD = 2.2) Linkage (LOD = 1.2) Linkage (LOD = 3.0)
GWAS/Rep GWAS GWAS/Rep Rep.Assoc Rep.Assoc GWAS Rep.Assoc
(33) (33) (33) (33) (33) (33) (33) (33) (33) (33) (12) (16) (5, 13) (34-36) (37) (36) (34) (34) (35) (34)
15q26.1-15q26.3 91.1-99.9 2.26 D15S130
rs11073418 D15S1014
92,512,350 93,448,799
95,803,646 Glucose 120
T2D Glucose 120
Linkage (LOD = 1.3) GWAS Linkage (LOD = 1.3)
(14) (38) (14)
16p12.1 22.8-26.5 2.18 rs3760106
rs2575390 5´-upstream D16S420 D16S3068
23,753,297 23,754,255 24,143,752 25,468,276
PRKCB1 PRKCB1 PRKCB1
T2D T2D T2D T2D T2D
Rep.Assoc Rep.Assoc Rep.Assoc Linkage (NPL = 1.7) Linkage (LOD = 1.4)
(39) (39) (40) (15) (16)
16q12.1-16q13 48.8-54.9 2.08 rs8050136
rs9939609 52,373,776
52,378,028 FTO T2D
T2D GWAS
GWAS (6, 19, 20)
(19)
20p13-20p12.2 0.0-9.2 2.78 rs7361808
D20S905 rs958435 D20S892 D20S115 rs6140410
1,784,935 5,811,664 6,524,785 6,698,245 7,608,052 7,685,540
SIRPA BMP2
T2D T2D T2D T2D T2D T2D
GWAS Linkage (LOD = 3.1)
Assoc Assoc Linkage (LOD = 1.7)
Assoc
(19) (17, 18)
(20) (18) (17), (16)
(20)
*The peak LOD score within the corresponding linkage region; †Trait tested for the corresponding study. T2D, Type 2 diabetes; FG level, fasting glucose level; glucose 120, glu- cose level obtained at 120 min interval; ‡Statistical method to map genes. GWAS, genome-wide association study; Linkage, linkage analysis; Rep.assoc, replicated association study.
lowing regions of chromosomes 2q23.3-2q31.1, 15q26.1-15q26.3, 16p12.1, 16q12.1-16q13, and 20p13-20p12.2 (Table 4).
Association analyses for SNPs in the linkage peaks We then performed two different association studies on SNP sites with an LOD score ≥ 1.3 within the significant linkage re- gions described above. Using FBAT in all families, we identified 3 significant SNPs within 6 linkage regions associated with FG level after adjusting for age, sex, and BMI (P < 0.001, Table 5).
We also performed population-based association analyses in founders only for each SNP with respect to FG level after adjust- ing for age, sex, and BMI for the various modes of inheritance.
We confirmed 9 significant SNP sites using the best genetic mod- el for each SNP within 6 linkage regions (P < 0.001, Table 5). By combining the two different P values obtained by FBAT and as- sociation analysis, we were able to identify 4 significant SNPs, namely, rs16853036 located in the XIRP2 gene (xin actin-bind- ing repeat containing 2 in chromosome 2q24.3), rs6497610 (in chromosome 16p12.1), rs6132978 in the VPS16 gene (vacuolar protein sorting 16 homolog in the chromosome 20p13), and rs6132978 in the PTPRA gene (protein tyrosine phosphatase, receptor type, A in the chromosome 20p13) that were signifi- cantly associated with FG level with a combined P < 0.001 (Table 5). In particular, rs6138953 located in the PTPRA gene was found to be highly associated with FG level (combined P = 1.8 × 10⁻⁶) under the recessive model.
DISCUSSION
FG level is a typical complex trait related to type 2 diabetes that is affected by multiple genes. FG level does not follow any mode of Mendelian inheritance and its phenotype is widely variable.
In this study, we used two ways to map genes that confer sus- ceptibility to an elevated FG level, that is, genome-wide linkage
and association analyses. Initially, we performed genome-wide linkage scan analysis using the Affymetrix SNP 6.0 chip with the objective of identifying those markers which are linked to major genes for FG level in all family members. We then used two dif- ferent types of association analyses to identify susceptibility genes with the FG level and to localize linkage regions of concern in genes identified by genome-wide linkage scan analysis.
We found multiple regions with evidence of linkage that were associated with the risk of an elevated FG level in our healthy twin-family cohort. Based on our combined genome-wide link- age and association analyses, we were able to confirm several regions that have evidence of linkage with FG level and type 2 diabetes in different populations. In particular, regions of chro- mosomes 2q23.3-2q31.1, 15q26.1-15q26.3, 16p12.1, and 20p13- 20p12.2 were consistently found to show evidence of linkage with FG level in different populations (Table 4). Meigs et al. (12) found that chromosome 2q24.3 (rs1882347) have evidence of linkage (maxLOD = 2.2) with FG level in the Framingham Heart Study cohort. Furthermore, a region of D2S2345 located in 2q24.3 showed evidence of linkage with an LOD = 3.0 in French Europ- ids in studies by Busfield et al. (13) and Huang et al. (5). Howev- er, chromosome 15q26.2 region showed relatively weak evidence of linkage with glucose level (LOD = 1.3) in Amish families (14).
Chromosome 16p12.1 also showed weak evidence of linkage with type 2 diabetes (LOD < 2.0) in Finnish families (15) and French Europids (16). The 20p13-20p12.2 region, which showed evidence of linkage and association with FG level in the present study, has been previously reported to show evidence of linkage (16-18) and association (18-20) with type 2 diabetes in different populations. Furthermore, D20S905 region (located in 20p12.3) showed peak evidence of linkage with type 2 diabetes with an LOD > 3 in the FUSION (non-insulin-dependent diabetes mel- litus genetics) study in Finnish families (17, 18).
The findings of this study were mostly novel, however, of the Table 5. Significant SNPs* detected by FBAT or association analyses within the region for evidence of linkage
SNPs in the linkage region FBAT Association with founders-only
Combined P§
Cytoband Position(bp) SNP rs* Near gene LOD† MAF U‡ P value§ β P value§ Best
modelll 2q24.3
2q31.1 167,709,716
171,404,718 rs16853036
rs7561581 XIRP2
GAD1 1.789
1.592 0.052
0.455 0.140
1.172 0.821
0.329 0.713
0.064 < 0.001
< 0.001 rec
dom < 0.001 0.002
15q26.3 98,393,341 rs2727184 ADAMTS17 1.809 0.131 0.640 0.557 0.204 < 0.001 rec 0.001
16p12.1 22,846,113 23,982,020 23,994,362
rs6497610 rs11640219
rs9923820 PRKCB1 PRKCB1
2.242 1.757 1.745
0.386 0.047 0.048
0.251 0.088 0.140
0.862 0.912 0.859
-0.071 0.578 0.578
< 0.001
< 0.001
< 0.001 dom
rec rec
< 0.001 0.005 0.005 20p13
20p12.3
2,252,832 2,532,331 2,774,321 2,858,880 8,868,528 8,893,635
rs2014045 rs16987508 rs6132978 rs6138953 rs11906576 rs6516421
TGM3 TMC2 VPS16 PTPRA
1.956 2.233 2.644 2.669 1.511 1.519
0.138 0.314 0.078 0.071 0.123 0.053
0.434 1.053 2.235 1.938 -3.537 -2.718
0.617 0.426
< 0.001 0.003
< 0.001
< 0.001
0.209 0.093 0.233 0.712 0.002 -0.015
< 0.001
< 0.001 0.018
< 0.001 0.984 0.629
rec rec rec rec rec dom
0.002 0.002
< 0.001 1.8E-06 0.005 0.002
*Significant SNPs (P < 0.001) were selected from the FBAT or the association study among the SNPs with LOD ≥ 1.3 within the regions with evidence of linkage; †The LOD score for the corresponding marker; ‡The general FBAT statistic; §P values were calculated after adjusting for age, sex and BMI. Combined P value for each SNP was derived using Fisher’s method; llThe best genetic model with the lowest AIC was selected among the dominant (dom), recessive (rec), and additive (add) models.
identified genes (Table 5), PTPRA and PRKCB1 are likely to have direct/indirect impacts on insulin signaling and FG levels. The rs6138953 SNP in the intron region of PTPRA, located in 20p13, was found to be significantly associated with FG level under the recessive model in the present study. The protein encoded by the PTPRA gene is protein tyrosine phosphatase receptor type A (PTPRA), which is a member of the protein tyrosine phospha- tase (PTP) family. PTPRA may play a role as a negative regula- tor of insulin signaling, and has been shown to dephosphory- late the insulin receptor, inhibit insulin-mediated effects, and modify insulin secretion in vitro (21). The expression of PTPRA is up-regulated in the skeletal muscles of obese humans (22), but unlike protein tyrosine phosphatase-1B (PTP1B) or leuko- cyte antigen related (LAR), there is insufficient evidence to prove its importance in insulin signaling. The present finding may sup- port the suggestion that PTPRA participates in the pathogenesis of impaired glucose homeostasis in humans due to altered in- sulin signaling. In addition to its association with insulin signal- ing, PTPRA has been actively studied in relation to cancer. Pro- tein tyrosine phosphorylation, which is controlled by protein ty- rosine kinase (PTKs) and PTPs, play an important role in various cellular events, such as, cell growth, differentiation, and onco- genesis (23), and the oncogenic function of various PTPs (PTPN11, PTPRH, PTPRF, and other) have been well demonstrated (24).
However, concerning PTPRA, the function in human tumor bi- ology has not been clearly verified, because in vitro (25) and clinical research (26) results in various cancers (colon, breast, gastric cancer, and other) are inconsistent. Therefore, further studies on the potential oncogenic role of PTPRA needed to be implemented.
The mutant types of rs11640219 and rs9923820, which are located in the intron region of the PRKCB1 gene (in 16p12.1), showed weak associations with FG level elevation according to the recessive model in the founder population in the present study. The protein encoded by PRKCB1 is protein kinase C (PKC) β (β1 and β2), which has been reported to be involved in glucose homeostasis and to play an important role in the pathogenesis of diabetic complications (27). Furthermore, the overexpressions of PKC β1 and β2 was found to inhibit the tyrosine kinase activi- ty of the insulin receptor in vitro (28), and PKC β knockout mice showed mildly improved glucose homeostasis and increased glucose transport in muscle and adipose tissue (29). In another study, PKC β2 overexpression was found to induce c-myc expres- sion and to suppress insulin gene transcription in rat pancreatic islets (30). On the other hand, PKC β2 was required to ensure adequate insulin-dependent glucose uptake in rat skeletal mus- cle (31). In another study by (32) a functional PKC β promoter polymorphism at position -546, which reduced promoter activ- ity, was found to be associated with insulin resistance in human subjects.
This study has several strengths. First, our data included vari-
ous familial relationships in a Korean twin-family cohort, which enable us to identify evidence of genetic signals more accurate- ly. Second, to the best of our knowledge, this is the first study to report linkages and associations of polymorphisms in chromo- somes 16p12.1 and 20p13-20p12.2 with respect to FG level ele- vation. Concerning the 16p12.1 and 20p13-20p12.2 regions, lit- tle linkage and association analyses has been performed with respect to fasting glucose, insulin, and insulin resistance, because most research has been focused on type 2 diabetes and its com- plications. However, we found that the PTPRA and PRKCB1 genes among 11 selected genes (Table 5) are involved in glucose metabolism and insulin secretion directly or indirectly, and thus, may affect FG levels.
However, this study is limited by a lack of extensive fine-map- ping and reliable replications of FG levels in individuals. Unclear biological understanding stayed behind for the other significant- ly detected polymorphisms, and thus, further studies are re- quired on these polymorphisms. This study also has a limited power to identify well-known genetic variants involved in FG level, due to small sample size. Also, the absence of information on specific diabetic medications for the subjects who had dia- betes is a limitation of our study.
In addition, meta-analyses of linkage regions and more exten- sive fine-mapping experiments that more broadly probe regions believed to contain additional markers associated with FG lev- els are needed in our future studies. Furthermore, replication studies are needed to explore the association between confirmed susceptibility loci and environmental factors of the trait.
Summarizing, we found multiple regions that showed evi- dence of linkage and an association with FG level in our Kore- an twin-family cohort. This study identifies that chromosomes 2q23.3-2q31.1, 15q26.1-15q26.3, 16p12.1, and 20p13-20p12.2 show evidence of linkage with FG level. In particular, SNP (rs- 6138953) on PTPRA in the 20p13 region is associated with FG level, and the PRKCB1 gene (in 16p12.1) is possibly associated with FG level. These findings contribute to our understanding of the pathogenesis of type 2 diabetes in the Korean population.
The combined approach of genome-wide linkage and family- based association analysis is useful to identify novel or known genetic regions concerning FG level in a family cohort study.
ACKNOWLEDGMENTS
The authors have no conflicts of interest to disclose.
REFERENCES
1. Ohlson LO, Larsson B, Björntorp P, Eriksson H, Svärdsudd K, Welin L, Tibblin G, Wilhelmsen L. Risk factors for type 2 (non-insulin-dependent) diabetes mellitus: thirteen and one-half years of follow-up of the partici- pants in a study of Swedish men born in 1913. Diabetologia 1988; 31:
798-805.
2. Manson JE, Rimm EB, Stampfer MJ, Colditz GA, Willett WC, Krolewski AS, Rosner B, Hennekens CH, Speizer FE. Physical activity and incidence of non-insulin-dependent diabetes mellitus in women. Lancet 1991; 338:
774-8.
3. Kim DJ, Cho NH, Noh JH, Kim HJ, Choi YH, Jung JH, Min YK, Lee MS, Lee MK, Kim KW. Fasting plasma glucose cutoff value for the prediction of future diabetes development: a study of Middle-Aged Koreans in a Health Promotion Center. J Korean Med Sci 2005; 20: 562-5.
4. Fradin D, Heath S, Lathrop M, Bougnères P. Quantitative trait loci for fasting glucose in young Europeans replicate previous findings for type 2 diabetes in 2q23-24 and other locations. Diabetes 2007; 56: 1742-5.
5. Huang QY, Cheng MR, Ji SL. Linkage and association studies of the sus- ceptibility genes for type 2 diabetes. Yi Chuan Xue Bao 2006; 33: 573-89.
6. Frayling TM. Genome-wide association studies provide new insights into type 2 diabetes aetiology. Nat Rev Genet 2007; 8: 657-62.
7. Martin N, Boomsma D, Machin G. A twin-pronged attack on complex traits. Nat Genet 1997; 17: 387-92.
8. Abecasis GR, Cherny SS, Cookson WO, Cardon LR. Merlin: rapid anal- ysis of dense genetic maps using sparse gene flow trees. Nat Genet 2002;
30: 97-101.
9. Sung J, Lee K, Song YM. Heritabilities of the metabolic syndrome pheno- types and related factors in Korean twins. J Clin Endocrinol Metab 2009;
94: 4946-52.
10. Sham PC, Purcell S, Cherny SS, Abecasis GR. Powerful regression-based quantitative-trait linkage analysis of general pedigrees. Am J Hum Genet 2002; 71: 238-53.
11. Elston RC. On fisher’s method of combining p-values. Biom J 1991; 33:
339-45.
12. Meigs JB, Manning AK, Fox CS, Florez JC, Liu C, Cupples LA, Dupuis J.
Genome-wide association with diabetes-related traits in the Framingham Heart Study. BMC Med Genet 2007; 8: S16.
13. Busfield F, Duffy DL, Kesting JB, Walker SM, Lovelock PK, Good D, Tate H, Watego D, Marczak M, Hayman N, et al. A genomewide search for type 2 diabetes-susceptibility genes in indigenous Australians. Am J Hum Genet 2002; 70: 349-57.
14. Hsueh WC, St Jean PL, Mitchell BD, Pollin TI, Knowler WC, Ehm MG, Bell CJ, Sakul H, Wagner MJ, Burns DK, et al. Genome-wide and fine- mapping linkage studies of type 2 diabetes and glucose traits in the Old Order Amish: evidence for a new diabetes locus on chromosome 14q11 and confirmation of a locus on chromosome 1q21-q24. Diabetes 2003;
52: 550-7.
15. Lindgren CM, Mahtani MM, Widén E, McCarthy MI, Daly MJ, Kirby A, Reeve MP, Kruglyak L, Parker A, Meyer J, et al. Genomewide search for type 2 diabetes mellitus susceptibility loci in Finnish families: the Botnia Study. Am J Hum Genet 2002; 70: 509-16.
16. Vionnet N, Hani EH, Dupont S, Gallina S, Francke S, Dotte S, De Matos F, Durand E, Leprêtre F, Lecoeur C, et al. Genomewide search for type 2 diabetes-susceptibility genes in French whites: evidence for a novel sus- ceptibility locus for early-onset diabetes on chromosome 3q27-qter and independent replication of a type 2-diabetes locus on chromosome 1q21- q24. Am J Hum Genet 2000; 67: 1470-80.
17. Ghosh S, Watanabe RM, Hauser ER, Valle T, Magnuson VL, Erdos MR, Langefeld CD, Balow J Jr, Ally DS, Kohtamaki K, et al. Type 2 diabetes:
evidence for linkage on chromosome 20 in 716 Finnish affected sib pairs.
Proc Natl Acad Sci U S A 1999; 96: 2198-203.
18. Ghosh S, Watanabe RM, Valle TT, Hauser ER, Magnuson VL, Langefeld CD, Ally DS, Mohlke KL, Silander K, Kohtamäki K, et al. The Finland- United States investigation of non-insulin-dependent diabetes mellitus genetics (FUSION) Study. I: an autosomal genome scan for genes that predispose to type 2 diabetes. Am J Hum Genet 2000; 67: 1174-85.
19. Tsai FJ, Yang CF, Chen CC, Chuang LM, Lu CH, Chang CT, Wang TY, Chen RH, Shiu CF, Liu YM, et al. A genome-wide association study iden- tifies susceptibility variants for type 2 diabetes in Han Chinese. PLoS Genet 2010; 6: e1000847.
20. Hanson RL, Bogardus C, Duggan D, Kobes S, Knowlton M, Infante AM, Marovich L, Benitez D, Baier LJ, Knowler WC. A search for variants as- sociated with young-onset type 2 diabetes in American Indians in a 100K genotyping array. Diabetes 2007; 56: 3045-52.
21. Kapp K, Metzinger E, Kellerer M, Häring HU, Lammers R. The protein tyrosine phosphatase alpha modifies insulin secretion in INS-1E cells.
Biochem Biophys Res Commun 2003; 311: 361-4.
22. Ahmad F, Azevedo JL, Cortright R, Dohm GL, Goldstein BJ. Alterations in skeletal muscle protein-tyrosine phosphatase activity and expression in insulin-resistant human obesity and diabetes. J Clin Invest 1997; 100:
449-58.
23. Hunter T. Protein kinases and phosphatases: the yin and yang of protein phosphorylation and signaling. Cell 1995; 80: 225-36.
24. Ostman A, Hellberg C, Böhmer FD. Protein-tyrosine phosphatases and cancer. Nat Rev Cancer 2006; 6: 307-20.
25. Zheng X, Resnick RJ, Shalloway D. Apoptosis of estrogen-receptor nega- tive breast cancer and colon cancer cell lines by PTP alpha and src RNAi.
Int J Cancer 2008; 122: 1999-2007.
26. Wu CW, Kao HL, Li AF, Chi CW, Lin WC. Protein tyrosine-phosphatase expression profiling in gastric cancer tissues. Cancer Lett 2006; 242: 95-103.
27. Ishii H, Jirousek MR, Koya D, Takagi C, Xia P, Clermont A, Bursell SE, Kern TS, Ballas LM, Heath WF, et al. Amelioration of vascular dysfunc- tions in diabetic rats by an oral PKC beta inhibitor. Science 1996; 272:
728-31.
28. Bossenmaier B, Mosthaf L, Mischak H, Ullrich A, Häring HU. Protein kinase C isoforms beta 1 and beta 2 inhibit the tyrosine kinase activity of the insulin receptor. Diabetologia 1997; 40: 863-6.
29. Standaert ML, Bandyopadhyay G, Galloway L, Soto J, Ono Y, Kikkawa U, Farese RV, Leitges M. Effects of knockout of the protein kinase C beta gene on glucose transport and glucose homeostasis. Endocrinology 1999; 140:
4470-7.
30. Kaneto H, Suzuma K, Sharma A, Bonner-Weir S, King GL, Weir GC. In- volvement of protein kinase C beta 2 in c-myc induction by high glucose in pancreatic beta-cells. J Biol Chem 2002; 277: 3680-5.
31. Kawano Y, Rincon J, Soler A, Ryder JW, Nolte LA, Zierath JR, Wallberg- Henriksson H. Changes in glucose transport and protein kinase Cbeta(2) in rat skeletal muscle induced by hyperglycaemia. Diabetologia 1999;
42: 1071-9.
32. Osterhoff MA, Heuer S, Pfeiffer M, Tasic J, Kaiser S, Isken F, Spranger J, Weickert MO, Möhlig M, Pfeiffer AF. Identification of a functional pro- tein kinase Cbeta promoter polymorphism in humans related to insulin resistance. Mol Genet Metab 2008; 93: 210-5.
33. Wang Q, Lin JL, Reinking BE, Feng HZ, Chan FC, Lin CI, Jin JP, Gustafson- Wagner EA, Scholz TD, Yang B, et al. Essential roles of an intercalated disc protein, mXinbeta, in postnatal heart growth and survival. Circ Res
2010; 106: 1468-78.
34. Takeuchi F, Katsuya T, Chakrewarthy S, Yamamoto K, Fujioka A, Seriza- wa M, Fujisawa T, Nakashima E, Ohnaka K, Ikegami H, et al. Common variants at the GCK, GCKR, G6PC2-ABCB11 and MTNR1B loci are as- sociated with fasting glucose in two Asian populations. Diabetologia 2010; 53: 299-308.
35. Rasmussen-Torvik LJ, Alonso A, Li M, Kao W, Köttgen A, Yan Y, Couper D, Boerwinkle E, Bielinski SJ, Pankow JS. Impact of repeated measures and sample selection on genome-wide association studies of fasting glu- cose. Genet Epidemiol 2010; 34: 665-73.
36. Ramos E, Chen G, Shriner D, Doumatey A, Gerry NP, Herbert A, Huang H, Zhou J, Christman MF, Adeyemo A, et al. Replication of genome-wide association studies (GWAS) loci for fasting plasma glucose in African- Americans. Diabetologia 2011; 54: 783-8.
37. Chen WM, Erdos MR, Jackson AU, Saxena R, Sanna S, Silver KD, Timpson NJ, Hansen T, Orrù M, Grazia Piras M, et al. Variations in the G6PC2/
ABCB11 genomic region are associated with fasting glucose levels. J Clin Invest 2008; 118: 2620-8.
38. Shu XO, Long J, Cai Q, Qi L, Xiang YB, Cho YS, Tai ES, Li X, Lin X, Chow WH, et al. Identification of new genetic risk variants for type 2 diabetes.
PLoS Genet 2010; 6. pii: e1001127.
39. Ma RC, Tam CH, Wang Y, Luk AO, Hu C, Yang X, Lam V, Chan AW, Ho JS, Chow CC, et al. Genetic variants of the protein kinase C-beta 1 gene and development of end-stage renal disease in patients with type 2 dia- betes. JAMA 2010; 304: 881-9.
40. Ikeda Y, Suehiro T, Osaki F, Tsuzura S, Kumon Y, Hashimoto K. Poly- morphisms in the 5’-upstream region of the PKCbeta gene in Japanese patients with Type 2 diabetes. Diabet Med 2004; 21: 1113-20.