Printed in the Republic of Korea DOI 10.5012/jkcs.2010.54.5.523
요약. 제안된 방법은 국제표준(IS)인 Entacapone-d10(EAD10)을 사용하여 체외에서 Entacapon(EA)의 정량화를 위한 간단하 고, 감도가 좋고, 명확한 액체 크로마토그래피-직렬 질량 분석법(LC-ESI-MS/MS)이다. 크로마토그래피 분리는 Zorbax SB-C18에서 수행되었고, 2.1 × 50 mm, 5 µm 컬럼과 10 mM Ammonium formate (pH 3.0)로 구성된 이동상에서 수행되었다:
0.7 mL/min 유속의 아세토나이트릴(60:40 v/v)은 액체-액체 추출을 따른다. EA와 EAD10은 다중 반응 탐색법(MRM)에서 수 소부가물을 가지고 상대적으로 포지티브 모드인 m/z 306.1 → 233.1 과 316.3 → 233.0에서 수소부과물을 가지고 측정되었다.
그 방법은 상관계수(r2) 0.993 이상을 갖는 1.00 - 2000.00 ng/mL의 선형 농도 범위 이상으로 입증되었다. 하루 중과 하루 이내 에 3.60에서 7.30과 4.20에서 5.50% 이내의 정밀성과 97.30에서 104.20과 98.30에서 105.80% 이내의 정확도는 EA를 위해 입 증되었다. 이러한 방법은 건강한 인도인 자원자들의 생물학적 동등성 연구에서 성공적으로 적용되었다.
주제어: 액체 크로마토그래피, 질량분석, 생물학적동등성, 약물 동력학 , 엔타카폰
ABSTRACT. The proposed method is simple, sensitive and specific Liquid chromatography-tandem mass spectrometry (LC- ESI-MS/MS) method for the quantification of Entacapone (EA) in human plasma using Entacapone-d10 (EAD10) as an internal standard (IS). Chromatographic separation was performed on Zorbax SB-C18, 2.1 × 50 mm, 5 µm column, mobile phase composed of 10 mM Ammonium formate (pH 3.0): Acetonitrile (60:40 v/v), with a flow-rate of 0.7 mL/min, followed by Liquid-liquid extraction. EA and EAD10 were detected with proton adducts at m/z 306.1 → 233.1 and 316.3 → 233.0 in multiple reaction monitoring (MRM) positive mode respectively. The method was validated over a linear concentration range of 1.00 - 2000.00 ng/mL with correlation coefficient (r2) ≥ 0.9993. Intra and inter-day Precision within 3.60 to 7.30 and 4.20 to 5.50% and Accuracy within 97.30 to 104.20 and 98.30 to 105.80% proved for EA. This method is successfully applied in the bioequivalence study of healthy Indian human volunteers.
Keywords: Liquid chromatography, Mass spectrometry, Bioequivalence, Pharmacokinetics, Entacapone
체외에서 ESI-MS/MS 탐지에 연결된 HPLC에 의한 Entacapon의 수량화:
생물학적 동등성 연구에 적용
Balasekhara Reddy. Ch†,#,*, Baburao. Ch‡, Chandrasekhar. K. B†, Kanchanamala. K†,#, RihanaParveen. SK.§, and Ravikumar. Konda†
†Jawaharlal Nehru Technological University, Anantapur-515002, India
‡Faculty of Pharmacy, Al-Jabal Al-Gharbi University, Libya
§Adcock Ingram Limited, Bommasandra, Bangalore-560099, India
#Siddharth Institute of Pharmacy, Nalanda Educational Society Kantepudi, Sattenapalli, Guntur-522438, India (접수 2010. 1. 8; 수정 2010. 7. 3; 게재확정 2010. 7. 9)
Quantification of Entacapone in Human Plasma by HPLC Coupled to ESI-MS/MS Detection: Application to Bioequavalence Study
Balasekhara Reddy. Ch†,#,*, Baburao. Ch‡, Chandrasekhar. K. B†, Kanchanamala. K†,#, RihanaParveen. SK.§, and Ravikumar. Konda†
†Jawaharlal Nehru Technological University, Anantapur 515002, India
*E-mail: [email protected], [email protected]
‡Faculty of Pharmacy, Al-Jabal Al-Gharbi University, Libya
§Adcock Ingram Limited, Bommasandra, Bangalore-560099, India
#Siddharth Institute of Pharmacy, Nalanda Educational Society Kantepudi, Sattenapalli, Guntur 522438, India (Received January 8, 2010; Revised July 3, 2010; Accepted July 9, 2010)
INTRODUCTION
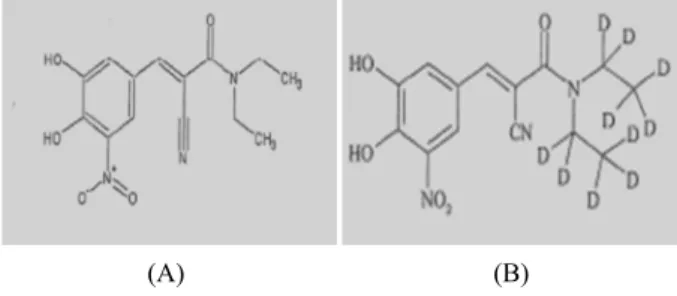
Entacapone is chemically described as (2E)-2-cyano-3-
(3,4-dihydroxy-5-nitrophenyl)-N,N-diethylprop-2-enamide.
Its Molecular formula is C14H15N3O5 its molecular weight is 305.29 (Fig. 1). Entacapone is a selective and reversible
(A) (B)
Fig. 1. Chemical structure of (A) Entacapone and (B) Entacapone- D10
inhibitor of catechol-O-methyltransferase (COMT). The me- chanism of action of Entacopone is believed to be through its ability to inhibit COMT and alter the plasma pharma- cokinetics of levodopa. When Entacapone is given in con- jucation with levodopa and aromatic amino acid decarboxyl- ase inhibitor alone leading to greater effects on the signs and symptoms of Parkinson’s disease. Entacopone is rapidly absorbed, with a Tmax of approximately 1 hour. The absolute bioavailability following oral administrations is 35%. Food does not affect the pharmacokinetics of Entacoponedue to its high plasma protein binding. The elimination of Enta- copone is biphasic, with an elimination half-life of 0.4 h - 0.7 h based on the β-phase and 2.4 h based on the γ-phase.
The γ-phase accounts for approximately 10% of the total AUC. Entacopone is almost completely metabolized prior to excretion, with only a very small amount (0.2% of dose) found unchanged in urine. After oral administration of a 14C-labeled dose of entacopone, 10% of labeled parent and metabolite is excreted in urine and 90% in feces.1
Several techniques such as, Amperometry and Liquid- chromatography (LC) methods have been reported in the literature for the quantitative estimation of EA in pharma- ceutical3 and biological fluids.2,4-9 Moreover, Amperometry involves a tedious extraction procedure involving too many steps. This may result inaccurate and imprecise results be- cause of co-precipitation.9 Entacapone was quantified in human plasma using a HPLC- UV.4 They observed a good linearity between the concentration range of 25.0 - 2500.00 ng/mL. However, the run time of each sample was approxi- mately 13 min which is very tedious. LC-MS/MS has gained importance for the quantitative estimation of drugs in vari- ous biological matrices including plasma, serum, urine, and ocular fluids, due to its high sensitivity, selectivity and repro- ducibility. Only A few methods were developed by using LC-MS/MS.2,5,10
In the present study, we have reported a highly sensitivity, selectivity and reproducible analytical method for the de- termination of EA in human plasma by LC-ESI-MS/MS with
less sample volume and deuterated compound entacapone- D10 (EAD10) was used as an internal standard. Elution time was achieved 0.51 min for both drug and IS. LOD was proved for 2.00 pg/mL with S/N value of 4.2 and LOQ was proved 1.00 ng/mL with S/N value of 90.80 for EA. We have de- veloped and validated the method as per the FDA guidelines over a concentration range of 1.00 - 2000.00 ng/mL and was successfully employed in the analysis of plasma samples following oral administration of EA (200 mg) in healthy human volunteers.11
MATERIALS AND METHODS Chemicals and reagents
Entacapone Obtained from Apotex Canada, Entacapone- D10 Obtained from TLC Pharmachem. All other chemicals and solvents were purchased from S.D fine chemicals Mum- bai. Human plasma was obtained from Navjeevan blood bank, Hyderabad.
Sample preparation
Liquid-liquid extraction was used to isolate Entacapone and its respective IS from human plasma. For this, 50 µL of IS (250.00 ng/mL) and 400 µL of plasma sample (Respective concentration) was added into labelled polypropylene tubes and vortexed briefly. Followed by addition of 400 µL of 1 N Acetic acid, 2.5 mL of extraction solvent (n-Hexane:Ethyl acetate (70:30) and vortexed for approximately 20 min. Then the samples were Centrifuge at 3000 rpm for approximately 5 min at 4 oC temperature. Subsequently the supernatant from each sample was transfered into respective polypropylene tubes. After that the samples were evaporated to dryness under nitrogen at 40 oC. The dried residue was reconstituted with 200 µL of reconstitution solution and vortexed briefly.
Finally extracted samples were transferred into auto sampler vials, 20 µL from each sample was injected into chromato- graphic system. Extraction was carried out under the absence of white light.
Chromatographic conditions
Zorbax, SB-C18, 2.1 × 50 mm 5 µm, was selected as the analytical column. The mobile phase composition was 10 mM Ammonium formate (PH 3.0) and Acetonitrile in the ratio of (60:40 v/v). The flow rate of the mobile phase was set at 0.7 mL/min. The column temperature was set at 30 oC.
Entacapone-D10 was found to be appropriate internal stan- dard in terms of chromatography and extractability. The re- tention time of Entacapone, Entacapone-d10 was found to be approximately 0.56 ± 0.20 min and 0.54 ± 0.20 min res- pectively throughout the run.
LC-MS/MS instrument and conditions
The 1200 Series HPLC system (Agilent Technologies, Germany), Mass spectrometric detection was performed on an API 4000 triple quadrupole instrument (ABI-SCIEX, Toronto, Canada) using MRM. Data processing was per- formed on Analyst 1.4.1 software package (SCIEX). Turbo ionspray (API) positive mode with Unit Resolution, MRM was used for the detection. For Entacapone, the [M+H]+ (m/z:
306.10) was monitored as the precursor ion and fragment at m/z 233.10 was chosen as the product ion. For internal stan- dard, the [M+H]+ (m/z 316.30) was monitored as the pre- cursor ion and fragment at m/z 233.0 was monitored as the product ion. Mass parameters were optimized as Source temperature 650 oC, nebulizer gas 30 psi, heater gas 50 psi, Curtain gas 20 psi, CAD gas 4 psi (nitrogen), Ion Spray (IS) voltage 5500 volts, Source flow rate 700 µL/min without split, Entrance potential 10 V, Declustering potential 40 V for (Analyte) and 40 V for (IS), Collision energy 16 V for both analyte and IS, Collision cell exit potential, 6 V for analyte and 8 V for IS.
Preparation of standards and quality control (QC) Samples Standard stock solutions of Entacapone (100.00 µg/mL) and the IS (100.00 µg/mL) were prepared in Acetonitrile.
The IS spiking solutions (250.00 ng/mL) were prepared in 50% Acetonitrile from IS standard stock solution. Standard stock solutions and IS spiking solutions were stored in refri- gerator conditions (2 - 8 oC) until analysis. Standard stock solutions of Entacapone was added to drug-free human plasma to obtain Entacapone concentration levels of 1.00, 2.00, 10.00, 20.00, 100.00, 200.00, 400.00, 800.00, 1200.00, 1600.00 and 2000.00 ng/mL for Analytical standards and 1.00, 3.00, 600.00, 1400.00 for Quality control standards and stored in a -80 oC set point freezer until analysis. The Aqueous standards were prepared in reconstitution solution (Aceonitrile: 0.09% Na2EDTA (30:70) for validation excer- cises until analysis.
Limit of quantification (LOQ)
The response (peak area) was determined in blank plasma samples (six replicates from different plasma lots) and spiked LOQ sample prepared from the same plasma was deter- mined. The peak area of blank samples should not be more than 20% of the mean peak area of LOQ of EA and 5% of EAD10. The Precision and mean Accuracy of the back cal- culated LOQ replicate concentrations must be ≤ 20 and ≤ 20%, respectively. The S/N value for LOQ is ≥ 5 (Fig. 4c).
Analytical curves
The analytical curves were constructed using values
ranging from 1.00 to 2000.00 ng/mL of EA in human plasma.
Calibration curves were obtained by linear model with log- transfered regression analysis. The ratio of EA/EAD10 peak area was plotted against the EA concentration in ng/mL.
The suitability of calibration curve was confirmed by back- calculating the concentrations of the calibration standards.
Calibration curve standards and quality control samples were prepared in replicates (n = 6) for analysis. The correlation coefficient was (> 0.9993) obtained in the whole range of tested concentrations. Precision and Accuracy for the back calculated concentrations of the calibration points, should be within ≤ 15 and ± 15% of their nominal values. How- ever, for LLOQ the Precision and Accuracy should be within
≤ 20 and ± 20%.
Recovery
The extraction recovery of EA and EAD10 from human plasma was determined by analyzing Quality control sam- ples. Recovery at three concentrations LQC, MQC and HQC (3.00, 600.00, and 1400.00 ng/mL) were determined by com- paring peak areas obtained from the plasma sample and the standard solution spiked with the blank plasma residue. A recovery of more than 85% was considered adequate to ob- tain required sensitivity.
Stability (Freeze ‒ thaw, Auto sampler, Room temperature, Long term)
Low quality control and high quality control samples (n = 6) were retrieved from deep freezer after three freeze-thaw cycles according to the clinical protocols. Samples were store at -80 oC in three cycles of 24, 36 and 48 hr. In addition, the long-term stability of EA in quality control samples was also evaluated by analysis after 55 days of storage at -80 oC. Auto- sampler stability was studied following 58.5 hr storage period in the autosampler tray with control concentrations. Room temperature stability was studied for 24.5 hr period with control concentrations. Stability samples were processed and extracted along with the freshly spiked calibration curve stan- dards. The Precision and Accuracy for the stability samples must be ≤ 15 and ± 15% respectively of their nominal con- centrations.
Analysis of plasma samples
The bioanalytical method described above was used to determine EA concentrations in plasma following oral ad- ministration of healthy human volunteers. These volunteers were, contracted in APL Research centre Pvt.Lt.D, Hydera- bad, India and each subject was administered 200 mg dose (one 200 mg tablet) in 25 healthy human volunteers by oral administration with 240 mL of drinking water. The reference
product Comtan tablets (Orion) 200 mg and Test product Entacapone tablet (Test tablet-1, Test tablet-2) 200 mg was used. Study protocol was approved by IEC (Institutional Ethical Committee) as per ICMR (Indian Council of Medical Research). Blood samples were collected as pre-dose (0) hr 5 minutes prior to dosing followed by further samples at 0.167, 0.25, 0.333, 0.5, 0.75, 1, 1.25, 1.5, 1.75, 2, 2.333, 2.667, 3.0, 3.5, 4, 4.75, 5.5, 6.25, 7, 8, 9 and 10 hours. After dosing 5 mL blood was collected each time in vaccutainers containing K2EDTA. A total of 69 (23 time points for Ref, 23 time points for Test-1 and 23 time points for Test-2) time points were collected by using centrifugation 3200 rpm, 10 oC, 10 min and stored at -80 oC until sample analysis.
Test-1, Test-2 and Reference Entacapone tablets were ad- ministered to same human volunteers under fasting condi- tions separately with proper washing periods as per protocol (Comparative, Randomized, 3-way crossover) approved by IEC.
Pharmacokinetics and statistical analysis
Pharmacokinetics parameters from the human plasma samples were calculated by a non-compartmental statistics model using WinNon-Lin5.0 software (Pharsight, USA).
Blood samples were taken for a period of 3 to 5 times the terminal elimination half-life (t1/2) and it was considered as the area under the concentration time curve (AUC) ratio higher than 80% as per FDA guidelines. Plasma EA con- centration-time profiles were visually inspected and Cmax
and Tmax values were determined. The AUC0-t was obtained by trapezoidal method. AUC0-∞ was calculated up to the last measureable concentration and extrapolations were obtained using the last measureable concentration and the terminal elimination rate constant (Ke). The terminal elimination rate constant, (Ke), was estimated from the slope of the terminal exponential phase of the plasma of EA concentration-time curve (by means of the linear regression method). The termi- nal elimination half-life, t1/2, was then calculated as 0.693/Ke. Regarding AUC0-t, AUC0-∞ and Cmax bioequivalence was assessed by means of analysis of variance (ANOVA) and calculating the standard 90% confidence intervals (90%
CIs) of the ratios test/reference (logarithmically transformed data). The bioequivalence was considered when the ratio of averages of log transformed data was within 80 - 125% for AUC0-t, AUC0-∞ and Cmax.
RESULTS AND DISCUSSION
Method development and validation
LC-ESI-MS/MS has been used as one of the most power-
ful analytical tool in clinical pharmacokinetics for its selec- tivity, sensitivity and reproducibility. The goal of this work was to develop and validate a simple, rapid and sensitive assay method for the quantitative determination of EA from plasma samples. A simple extraction technique was utilized in the extraction of EA and EAD10 from the plasma samples.
Chromatographic conditions, especially the composition and nature of the mobile phase, were optimized through several trials to achieve best resolution and increase the signal of EA and EAD10. The MS optimization was performed by direct infusion of solutions of both EA and EAD10 into the ESI source of the mass spectrometer. The critical parameters in the ESI source includes the needle (ESI) voltage, which is directly related to the charged droplet formation and to the amount of gaseous ions formed. Capillary voltage was related to the gaseous ion guidance to the inside of the MS and is the last barrier between the atmospheric pressure and the high vacuum of the mass spectrometer. Other parameters, such as the nebulizer and the desolvation gases were opti- mized to obtain a better spray shape, resulting in better ioni- zation and droplet drying to form, in our case, the protonated ionic EA and EAD10 (IS) molecules (Fig. 1). A CAD pro- duct ion spectrum for EA and EAD10 yielded high-abun- dance fragment ions of m/z 233.1 and m/z 233.0 respectively (Fig. 2 and 3). After the MRM channels were tuned, the mobile phase was changed from an organic phase to a more aqueous phase with acid dopant to obtain a fast and selec- tive LC method. A good separation and elution were achieved using 10 mM Ammonium formate (pH 3.0): Acetonitrile (60:40 v/v) as the mobile phase, at a flow-rate of 0.7 mL/
min and injection volume of 20 µL.
Specificity
The analysis of EA and EAD10 using MRM function was highly selective with no interfering compounds (Fig. 4a).
Chromatograms obtained from plasma spiked with EA (1.00 ng/mL) and EAD10 (250.00 ng/mL) are shown in Fig. 4b.
Matrix effect
To predict the variability of matrix effects in samples from individual subjects, matrix effect was quantified by deter- mining the matrix factor, which was calculated as follows:
Matrix Factor =
Peak response ratio in the presence of extracted matrix Peak response ratio in aqueous standards Six lots of blank biological matrices were extracted each in triplicates and spiked with the aqueous standard at the
304 305 306 307 308 309 230.5 231.0 231.5 232.0 232.5 233.0 233.5 234.0 234.5 235.0 235.5 236.0
m/z, amu m/z, amu
1.7e7 1.6e7 1.5e7 1.4e7 1.3e7 1.2e7 1.1e7 1.0e7 9.0e6 8.0e6 7.0e6 6.0e6 5.0e6 4.0e6 3.0e6 2.0e6 1.0e6
Intensity, cps
1.00e6 9.50e5 9.00e5 8.50e5 8.00e5 7.50e5 7.00e5 6.50e5 6.00e5 5.50e5 5.00e5 4.50e5 4.00e5 3.50e5 3.00e5 2.50e5 2.00e5 1.50e5 1.00e5 5.00e4
Intensity, cps
303.2
304.3 305.2
306.1
307.1
308.1
231.1
232.1 233.1
234.0 235.0
235.8
Fig. 2. Mass spectra of the Entacapone Q1 → Entacapone Q3
313.5 314.0 314.5 315.0 315.5 316.0 316.5 317.0 317.5 318.0 318.5 319.0 2 230.5 231.0 231.5 232.0 232.5 233.0 233.5 234.0 234.5 235.0 235.5 236.0
m/z, amu m/z, amu
Intensity, cps Intensity, cps
8.0e6 7.8e6 7.6e6 7.4e6 7.2e6 7.0e6 6.8e6 6.6e6 6.4e6 6.2e6 6.0e6 5.8e6 5.6e6 5.4e6 5.2e6 5.0e6 4.8e6 4.6e6 4.4e6 4.2e6 4.0e6 3.8e6 3.6e6 3.4e6 3.2e6 3.0e6 2.8e6 2.6e6 2.4e6 2.2e6 2.0e6 1.8e6 1.6e6 1.4e6 1.2e6 1.0e6 8.0e5 6.0e5 4.0e5
3.5e6 3.4e6 3.3e6 3.2e6 3.1e6 3.0e6 2.9e6 2.8e6 2.7e6 2.6e6 2.5e6 2.4e6 2.3e6 2.2e6 2.1e6 2.0e6 1.9e6 1.8e6 1.7e6 1.6e6 1.5e6 1.4e6 1.3e6 1.2e6 1.1e6 1.0e6 9.0e5 8.0e5 7.0e5 6.0e5 5.0e5 4.0e5 3.0e5 2.0e5 1.0e5 313.4
314.4
315.3 316.3
317.2 231.1 234.0 235.1
233.0
318.3
Fig. 3. Mass spectra of the Entacapone-D10 Q1 → Entacapone-D10 Q3
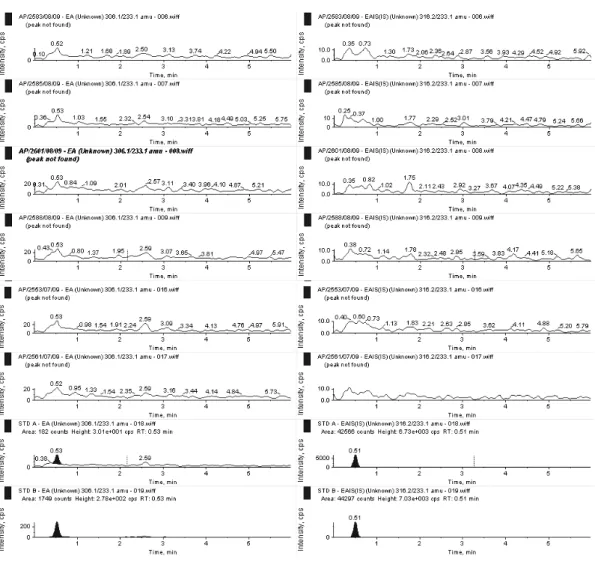
Fig. 4a. MRM chromatogram of different Blank human plasma (Selectivity figures)
Fig. 4b. MRM chromatogram of Spiked human plasma containing 1.00 ng/mL Entacapone and 250.00 ng/mL Entacapone-D10 (LLOQ).
Fig. 4c. MRM chromatogram of LOQ showing S/N values
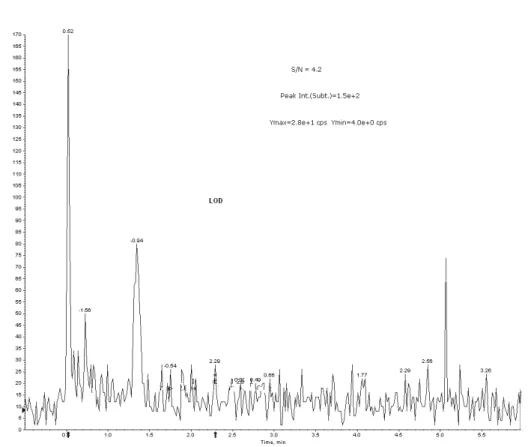
Fig. 4d. MRM chromatogram of LOD showing S/N values
Mean plasma concentration of Entacapone
0 5 10 15 20 25 Time (h)
1200
1000
800
600
400
200
0
Entacapone (ng/mL)
Ref Test-1 Test-2
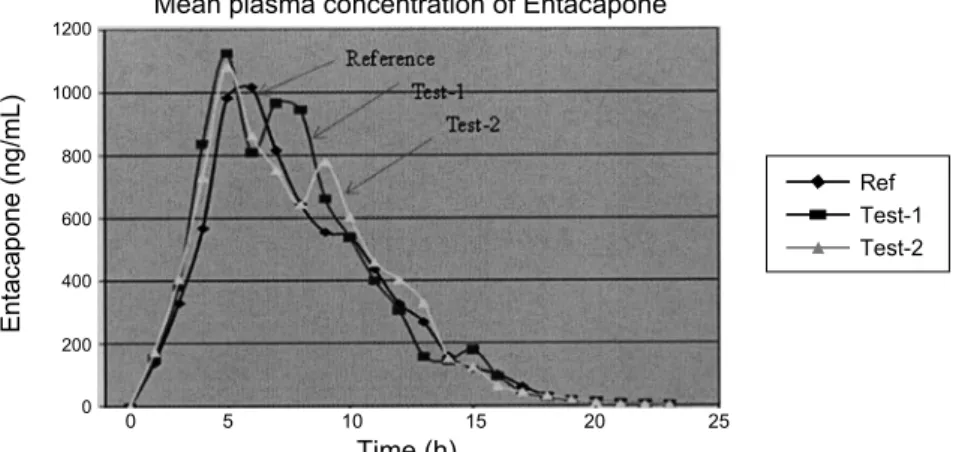
Fig. 5. Mean plasma concentrations of Test-1, Test-2 vs. Reference after a 200 mg dose (one 200 mg Tablet) oral dose (25 healthy volunteers).
Table 1. Calibration curve details from the validation section
Spiked plasma concentration (ng/mL) Concentration measured (mean) (ng/mL) R.S.D.a (%) (n = 5) Accuracy (%)
1.00 1.03 3.90 103.00
2.00 1.98 6.60 99.00
10.00 9.26 13.30 92.60
20.00 20.10 2.20 100.50
100.00 104.41 2.90 104.40
200.00 205.38 4.50 102.70
400.00 425.54 3.40 106.40
800.00 829.40 1.70 103.70
1200.00 1205.65 1.90 100.50
1600.00 1538.07 2.80 96.10
2000.00 1876.04 2.60 93.80
a[Standard deviation/mean concentration measured] × 100.
Table 2. Precision and accuracy (analysis with spiked plasma samples at three different concentrations) Spiked plasma
concentration (ng/mL)
Within-run Between-run
Concentration measured (n = 6)
(ng/mL) (mean ± S.D.) R.S.D.a
(%) Accuracy
(%) Concentration measured (n = 30)
(ng/mL) (mean ± S.D.) R.S.D.a
(%) Accuracy (%)
3.00 2.92 ± 0.17 5.80 97.30 2.95 ± 0.15 5.10 98.30
600.00 624.90 ± 45.62 7.30 104.20 635.06 ± 34.65 5.50 105.80
1400.00 1434.58 ± 51.76 3.60 102.50 1375.54 ± 57.93 4.20 98.30
a[Standard deviation/mean concentration measured] × 100.
mid QC level, and compared with aqueous standards of same concentration in alternate injections. The overall precision of the matrix factor is expressed as coefficient of Variation (CV %) and was determined to be 3.16 for Entacapone (Acceptance criteria CV % ≤ 15%).
Linearity, precision and accuracy
Calibration curves were plotted as the peak area ratio (EA/
EAD10) versus (EA) concentration. Calibration was found to be linear over the concentration range of 1.00 - 2000.00
ng/mL. The R.S.Ds was less than 15% and the Accuracy ranged from 92.60 to 106.40%. The determination coeffi- cients (r2) were greater than 0.9993 for all curves (Table 1).
Precision and Accuracy for this method was controlled by calculating the intra and inter-batch variations at three con- centrations (3.00, 600.00 and 1400.00 ng/mL) of QC samples in six replicates. As shown in Table 2, the intra-batch R.S.Ds were less than 7.30% and the Accuracy ranged from 97.30 to 104.20%. The inter-batch R.S.Ds were less than 5.5% and the Accuracy ranged from 98.30 to 105.80%. These results
Table 3. Stability of the samples
Spiked plasma concentration
(ng/mL)
Room temperature stability Autosampler stability Long term stability Freeze and thaw stability
24.5 hr 58.5 hr 55 Days Cycle 3 (48 hr)
Concentration measured (n = 6) (ng/mL)
(mean ± S.D)
R.S.Da (n = 6)
(%)
Concentration measured (n = 6) (ng/mL)
(mean ± S.D)
R.S.Da (n = 6)
(%)
Concentration measured (n = 6) (ng/mL)
(mean ± S.D)
R.S.Da (n = 6)
(%)
Concentration measured (n = 6) (ng/mL)
(mean ± S.D)
R.S.D.a (n = 6) (%)
3.00 3.12 ± 0.07 2.38 3.21 ± 0.08 2.48 3.33 ± 0.11 3.18 3.16 ± 0.13 3.98
1400.00 1318.33 ± 36.01 2.73 1251.67 ± 71.39 5.70 1280.00 ± 28.28 2.21 1263.33 ± 36.15 2.86
a[Standard deviation/mean concentration measured] × 100.
Table 4. Mean Pharmacokinetic Parameters of Entacapone in 25 Healthy Volunteers after Oral Administration of 200 mg Reference, Test-1 and Test-2 Products.
Entacapone Pharmacokinetic Parameter
Cmax (ng/mL) Tmax (hr) AUC0-t (ng. hr/mL) AUC0-∞ (ng. hr/mL)
REF 1016.11 0.75 2269.47 2284.46
Test-1 1121.74 0.5 2325.66 2334.25
Test-2 1081.02 0.5 2220.57 2228.96
AUC0-∞: area under the curve extrapolated to infinity; AUC0-t: area under the curve up to the last sampling time; Cmax: the maximum plasma concentration; Tmax: the time to reach peak concentration
Table 5. Test/Reference pharmacokinetic parameters of Entacapone after administration of 200 mg of Reference, Test-1 and Test-2 Products in 25 healthy male volunteers
Test/Ref Pharmacokinetic parameter
Cmax (ng/mL) AUC0-t (ng. hr/mL) AUC0-∞ (ng. hr/mL)
Test-1/REF 110.40 102.48 102.18
Test-2/REF 106.38 97.85 97.57
indicate the adequate reliability and reproducibility of this method within the analytical range.
Stability (Freeze ‒ thaw, Auto sampler, Room temperature, Long term)
Quantification of the EA in plasma subjected to 3 freeze- thaw (-80 oC to room temperature) cycles showed the stability of the analyte. No significant degradation of the EA was observed even after 58.5 h storage period in the autosampler tray and the final concentrations of EA was between 96.00 to 110.00% of the theoretical values. In addition, the long- term stability of EA in QC samples after 55 days of storage at -80 oC was also evaluated. The concentrations ranged from 100.00 to 104.00% of the theoretical values. These results confirmed the stability of EA in human plasma for at least 55 days at -80 oC.
Recovery
The recovery following the sample preparation using
Liquid-liquid extraction with Ethylacetate and n-Hexane was calculated by comparing the peak area of EA in plasma sam- ples with the peak area of solvent samples and was estimated at control levels of EA. The recovery of EA was determined at three different concentrations 3.00, 600.00 and 1400.00 ng/mL, were found to be 95.18, 93.52 and 97.33%, respec- tively. The overall average recovery of EA and EAD10 were found to be 98.01 and 102.57% respectively.
Limit of Detection (LOD)
The limit of detection was determined using S/N values which should be ≥ 3 - 5. For Entacapone 20 µL of a 100.00 pg/mL neat solution was injected to give an on-column mass of 2.00 pg. S/N value was found to be 4.20 (Fig. 4d).
Application to biological samples
The above validated method was used in the determina- tion of EA in plasma samples for establishing the bioequi- valence of a single 200 mg dose (one 200 mg tablet) in 25
healthy volunteers. Typical plasma concentration versus time profiles is shown in Fig. 5. All the plasma concentrations of EA were in the standard curve region and retained above the 1.00 ng/mL (LOQ) for entire sampling period (Table 4, Table 5).
CONCLUSION
In this article we have reported the use of LC-ESI-MS/MS for accurate, precise and reliable measurement of EA con- centrations in human plasma after oral administration of 200 mg to healthy volunteers. The method described here is fast, robust, and sensitive. Each sample requires less than 6 min of analysis time. The drug and IS were eluted within 2 minutes. The assay method is also highly specific due to the inherent selectivity of tandem mass spectrometry and has significant advantages over other techniques previously described for measuring entacapone in biological fluids. The sensitivity of the assay is sufficient to follow accurately the pharmacokinetics of EA following oral administration.
Acknowledgments. Authors wish to thank the support received (for providing Literature survey) from IICT (Indian institute of chemical technology) Hyderabad India. APL Research centre Pvt. Ltd Hyderabad, India, to carry out this Research work.
REFERENCES
1. Physician’s Desk Reference (PDR) 2006, Product monograph for comtan®, 2186.
2. Yadav, M.; Dixit, P.; Trivedi, V.; Gandhi, A.; Senger, A.; Gutti- kar, S.; Singhal, P.; Shrivastav, P. S. J. Chromatogr. B Analyt.
Technol. Biomed. Life Sci. 2009, 877(5-6), 533.
3. Doshi, A. S.; Upadhyay, K. J.; Mehta, T. N.; Nanda, N. J. AOAC.
2009, 92(2), 394.
4. Ramakrishna, N. V. S.; Vishwottam, K. N.; Wishu, S.; Kotesh- wara, M.; Chidambara, J. J. Chromatogr. B Analyt. Technol.
Biomed. Life Sci. 2005, 823(2), 189.
5. Keski-Hynnila, H.; Kurkela, M.; Elovaara, E.; Antonio, L.;
Magdalou, J.; Luukkanen, L.; Taskinen, J.; Kostiainen, R.;
Anal. Chem. 2002, 74(14), 3449.
6. Tuomainen, P.; Reenila, I.; Mannisto, P. T. J. Pharm. Biomed.
Anal. 1996, 14(5), 515.
7. Wikberg, T.; Ottoila, P.; Taskinen, J. Eur. J. Drug Metab.
Pharmacokinet. 1993, 18(4), 359.
8. Wikberg, T.; Vuorela, A.; Ottoila, P.; Taskinen, J. Drug Metab.
Dispos. 1993, 21(1), 81.
9. Karlsson, M.; Wikberg, T. J. Pharm. Biomed. Anal. 1992, 10(8), 593.
10. Hakala, K. S.; Suchanova, B.; Luukkanen, L.; Ketola, R. A.;
Finel, M.; Kostiainen, R. Anal. Biochem. 2005, 341(1), 105.
11. Guidance for industry: bioanalytical method validation, U.S.
Department of Health and Human Services, Food and Drug Ad- ministration, Center for Drug Evaluation and Research (CDER), Center for Biologics Evaluation and Research (CBER), May 2001.