초급성기 뇌경색 환자에서 가장 중요한 치료는 혈전용해술 등으로 폐색혈관을 조기에 개통시켜 허혈 부위의 혈류를 회복 시킴으로써 세포기능을 다시 살리는 것이다(1-3). 혈전용해 술 시행의 이론적 근거는 허혈성 반영부(ischemic penumbra)
의 존재로서 이는 혈류 저하에 의해 세포기능이 정지되어 있 으나 혈류공급이 재개되면 기능이 회복되는 가역적 손상을 받 은 부위로 혈류가 재개통 되지 않으면 경색으로 이행되는 부 위를 말한다(4). 허혈성 반영부를 평가하는 데는 여러 가지 방 법이 있으나 시간을 다투는 응급상황에서 적용하는 데는 현실 적으로 MR이 가장 유용하며 실제로 급성 뇌경색 환자에서 확 산 강조 및 관류 MR 영상을 이용하여 허혈성 반영부를 평가 하고 있다(5-7). 즉, 확산 강조 MR 영상은 경색부위를 발생
급성 뇌경색에서 확산 및 관류 MR 영상을 이용한 허혈성 반영부의 소생가능성 평가
1허미옥・김상준・이정현・이덕희・최충곤・서대철
목적: 초급성기 허혈성 경색환자에서 경색의 진행여부를 예측하는데 MR 영상을 이용한 관류- 확산 불일치부위의 존재여부가 유용하다. 그러나, 관류-확산 불일치부위가 모두 경색으로 진 행되는 것은 아니며 상당부분은 혈관 재개통이 없더라도 경색으로 진행되지 않는 저혈류 생존 부위인 것으로 알려져 있다. 본 연구에서는 관류 MR 영상을 정성적으로 분석하여 1) 경색위 험부위를 저혈류 생존부위와 구분할 수 있는지 2) 시간 경과에 따라 각 부위의 관류량에 차이 가 있는지 알고자 하였다.
대상과 방법: 중뇌동맥영역 경색환자 중 증상 발현 후 12 시간 이내에 확산 및 관류 MR을 촬
영한 환자 22명을 대상으로 하였다. 혈전용해술을 시행한 환자나 병변의 크기가 5 mL 이하로 작은 환자 및 평균통과시간(mean transit time; MTT)지도상 관류-확산 불일치부위가 없는 환 자는 제외하였다. MTT map과 초기 및 추적 확산영상을 이용하여 경색부위를 1) 초기경색부 위, 2) 경색진행부위, 3) 저혈류 생존부위로 나누고 관류지도상 각 부위에서 반대편 정상부위 와 비교한 뇌혈용적(relative cerebral blood volume; rCBV), 뇌혈류량(relative cerebral blood flow; rCBF), 및 평균통과시간의 상대치를 구하였다. 각 경색부위의 상대적 관류량의 평균치를 구하고 일원배치 분산분석(ANOVA)을 이용하여 유의한 차이가 있는지 검사하였으며 receiver operating characteristic(ROC) curve를 이용하여 각 병변 부위별 관류량의 경계치를 구했다.
또한 각 부위의 관류량이 경과시간과 상관관계가 있는지 분석하였다.
결과: 각 부위별 관류량의 평균은 rCBV, rCBF 및 MTT map상 유의하게 차이가 있었다 (ANOVA). 부위 2와 3 사이에는 rCBF 및 rCBV 값에 차이가 있었으나(ANOVA, Bonferroni post hoc test) rCBV의 경우 부위 2, 3의 관류량이 0.88 및 1.05로 정상부위와 유사하여 rCBV map상 육안적 구분이 어려웠다. rCBF 값은 부위 1, 2, 및 3에서 각각 0.40, 0.64, 0.84였으며 부위 2와 3 사이에 rCBF의 경계치는 0.75이었다. 증상발현 후 경과시간과 각 병변부위의 관 류량과는 유의한 상관관계가 없었다.
결론: 초급성 경색환자에서 초기경색부위, 경색진행부위, 저혈류생존부위 간에는 rCBF, rCBV 및 MTT에 유의한 차이가 있었으며, 경색진행부위와 저혈류생존부위를 가장 잘 구분할 수 있 는 것은 rCBF 값이었다. 이를 이용하면 생존이 가능한 경색위험부위의 존재여부를 파악하여 혈전용해술 등의 치료방침을 정하는 데 도움이 될 것으로 생각된다.
1울산대학교 서울아산병원 방사선과
본 연구는 아산생명과학연구소의 연구비 지원에 의하여 이루어졌음(2003- 336).
이 논문은 2006년 6월 19일 접수하여 2006년 8월 13일에 채택되었음.
후 수분 이내에 정확하게 찾아낼 수 있고 관류 MR 영상을 통 해 경색부위 주위의 혈류감소부위를 평가할 수 있는데 관류- 확산 불일치(perfusion-diffusion mismatch)부위가 허혈성 반 영부를 반영한다는 것이다. 그러나, 일반적으로 관류-확산 불 일치부위는 시간이 지나더라도 모두 경색으로 진행되는 것은 아니며 혈류가 감소되어 있지만 시간이 지나도 경색으로 이행 되지 않는 부위를 포함하므로 허혈성 반영부를 과다하게 평가 하는 것으로 알려져 있다(8). 따라서 관류 확산 불일치가 있 더라도 경색으로 진행될 부위와 생존할 부위를 구분하기 위해 서는 관류지도의 단순한 정성적 분석으로는 알기 어려우며 관 류 저하의 정도를 정량적으로 평가하여 두 부위를 구분하는 연구들이 시도되고 있다(9-11). 관류 정도를 정량적으로 평 가하는 데는 대체로 상대적 뇌혈류량(relative cerebral blood flow; rCBF), 뇌혈용적(relative cerebral blood volume;
rCBV), 및 평균통과시간(mean transit time; MTT) 지도를 이 용하며 지도상 경색진행부위와 생존부위의 관류량을 측정하여 경계치를 찾는 방법이 주로 사용된다. 그러나 현재까지 나온 결과는 어떤 관류지도가 가장 유용한지, 경계치가 얼마인지에 대한 의견은 서로 일치되지 않는다(9-11). 또한, 경색 후 시
간경과에 따라 각 부위의 측정치나 경계치가 달라질 수 있을 것으로 생각되나 이에 대한 연구는 찾기 어려웠다.
본 연구에서는 관류 MR 영상을 정성적으로 분석하여 1) 경 색위험부위를 저혈류 생존부위와 구분할 수 있는지 2) 시간 경 과에 따라 각 부위의 관류량에 차이가 있는지 알고자 하였다.
대상과 방법
대상환자
2003년 1월부터 2003년 12월까지 1년간 급성 뇌경색의 증 상으로 응급실로 내원한 환자 중 연구조건에 맞는 22명을 대 상으로 하였다. 연구에 포함시킨 조건은 1) 중뇌동맥영역의 뇌 경색 환자로 2) 증상 발생 후 12시간 이내에 확산 및 관류 영 상을 포함한 MR검사가 시행되었으며, 3) 1주일 이내에 추적 MR 또는 CT 검사를 시행했던 환자를 대상으로 하였고 1) 경 색부위 용적이 5mL 이하의 작은 경색, 2) MTT map상 관 류-확산 불일치가 없는 환자 및 3) 혈전용해술을 시행한 환 자는 제외하였다. 대상환자의 평균연령은 64.3세(23세-88세) 였고 성별은 남 11, 여 11명이었다.
A B
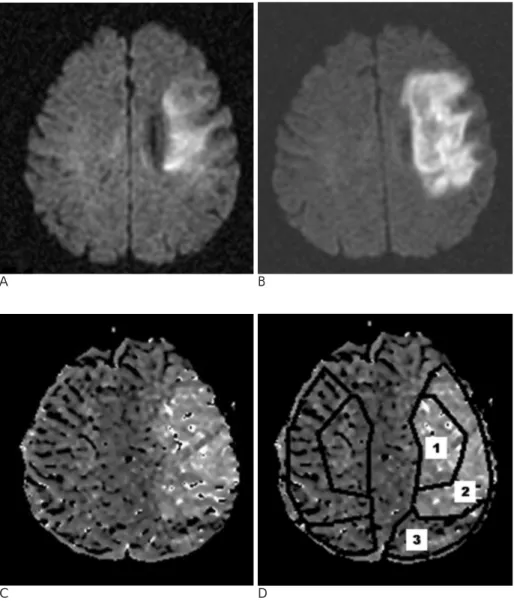
Fig. 1. A 40-year-old man with a right- sided weakness. Initial MR images were obtained at 4.8 hours from the onset of stroke.
A. Initial diffusion-weighted image, B.
the 4-day follow-up diffusion-weight- ed image, C. mean transit time(MTT) map, and D. diagram showing three regions of interest overlapped on the MTT map. Regions of interest on the left affected side and on the right unaf- fected side were outlined by a solid line. Region of interest 1 covers the ini- tial lesion on the DWI (the ischemic core). Region of interest 2 covers the area of the final infarct on the follow- up image subtracted from the area of the initial infarct (the mismatch area that progressed to an infarct). Region of interest 3 covers the area of the per- fusion abnormality on the MTT map but remained normal on the follow-up diffusion MR images.
C D
MR 검사방법
MR 영상은 1.5-T MR 기기에서 획득하였다(Signa CVi, GE Medical Systems, Milwaukee, WI). 급성 뇌경색 환자의 MR 프로토콜은 경사에코 영상, 확산강조영상, T2 강조영상과 3차 원 time-of-flight(TOF) MR 혈관조영술, 경동맥을 포함한 뇌 혈관의 조영증강 MR 혈관조영술 및 관류영상 등으로 구성되 었다.
확산강조영상은 single-shot, echo-planar imaging(EPI) 기 법으로 촬영하였다. b value 2,000 s/mm2로 3방향으로 확산 경사자계를 가한 후 영상을 얻고 추가로 b value 50 s/mm2로 영상을 얻었다. 촬영조건은 반복시간/에코시간(repetition time, TR/echo time, TE) 7,500/83.4 msec, field of view (FOV) 250 mm, matrix 128×128, 절편두께/간격 5/2 mm, number of excitation 2였다. 등방성 확산강조영상은 같은 콘솔에서 생 성하였다. 관류영상은 경사에코 EPI 기법으로 gadopentetate dimeglumine(Magnevist; Schering AG, Berlin, Germany)을 0.2 mmol/kg 용량으로 4 mL/sec의 속도로 주입한 후 획득하 였다. EPI 영상획득은 조영제 주입 10초 전부터 시작하여 40 series를 시행하였으며 각 series별로 10개의 단면을 얻었다.
촬영조건은 TR/TE 2,000/60 msec, FOV 250 mm, matrix 128×128, 절편두께/간격 5/2 mm, number of excitation 2였 다.
T2 강조영상은 TR/TE 4,000/118 msec, FOV 250 mm, matrix 256×256, 절편두께/간격 5/2 mm, single acquisition 으로 얻었다. 경사에코 영상은 TR/TE 500/30 msec, flip angle 20°, FOV 250 mm, matrix 256×256, 절편두께/간격 5/2 mm, single acquisition으로 얻었다.
추적 MR 검사는 첫 검사 후 1-5일(평균 2.7일)후에 얻었 으며 확산강조영상, T2-강조영상, 경사에코영상, 3D TOF MR 혈관조영술을 시행하였다.
영상분석방법
관류 MR 영상을 workstation(Ultra 60; Sun Microsystems, Milpitas, CA)으 로 옮 겨 workstation에 장 착 된 software(Voxtool 3.0; GE Medical Systems, Milwaukee, WI) 를 이용하여 각 rCBV, rCBF, 및 MTT map을 만들었다. 초기 및 추적 확산강조영상과 관류영상 중 MTT map을 바탕으로
측정부위를 세 부분으로 나누어 초기 확산강조영상에서 고신 호를 보이는 부위를 부위 1, 초기는 정상이나 추적검사상 고 신호를 보인 부위를 부위 2, MTT map상 비정상소견을 보이 나 추적검사상 경색이 발생하지 않은 부위를 부위 3으로 하였 다. 초기 확산강조영상에 관류영상을 중첩해 각 부위를 수기 로 그려 관심영역(region of interest, ROI)을 정하고 관류량 을 측정하였다(Fig. 1). 측정은 병변부위가 있는 모든 단면에 서 시행하였다.
통계분석
각 부위의 ROI의 평균치를 각 parameter 지도별로 구하여 부위 간 유의한 차이가 있는지 알아 보았고(ANOVA) 부위 2, 3간의 유의한 차이 여부를 알아보았다(Bonferroni 사후검정).
유의한 차이를 보이는 부위 간에는 수신기작동특성곡선 (Receiver operating characteristic(ROC) curve)을 이용하여 두 부위를 나누는 경계치를 구하였다.
시간경과에 따른 부위별 관류량의 차이가 있는지 알기 위하 여 대상환자를 경과시간에 따라 3시간 이전, 3-6시간, 6시간 이상 경과군으로 나누어 군별로 부위별 관류량에 차이가 있는 지 알아보았다(ANOVA). 또한, 경과시간과 부위별 관류량의 상관관계를 알아보았다(Pearson correlation).
결 과
증상발생부터 MR촬영까지의 경과시간은 평균 5.5시간(범 위: 1.8-12시간)이었다.
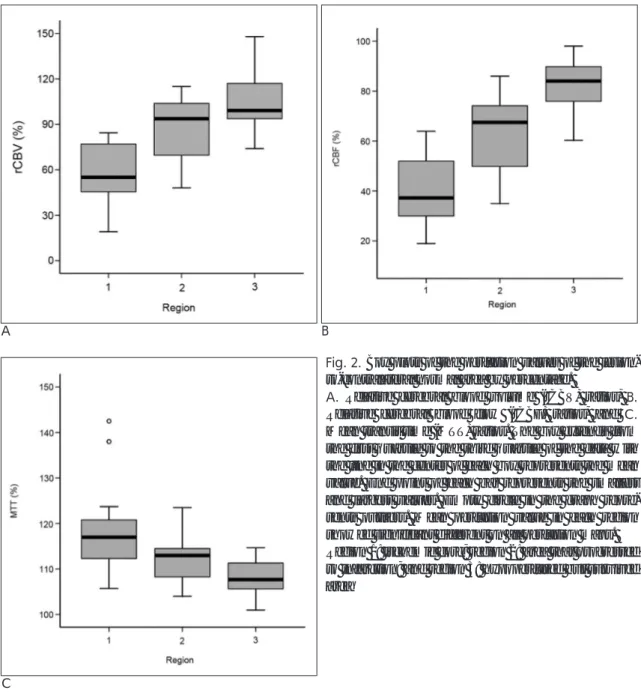
부위별 평균적인 상대적 관류량은 Table 1과 같다. 부위별 측정 숫자는 부위 1, 2, 및 3 별로 각각 21, 16, 및 20명이었 다. 부위 1, 2, 3의 각 부위별로 rCBV, rCBF, MTT 관류량에 유의한 차이가 있었으나 부위 2와 3 사이에는 rCBV 및 rCBF 값에 유의한 차이가 있었다. 부위별 rCBV 및 rCBF 값은 부위 1, 2, 3에서 각각 0.58, 0.88, 1.05 및 0.40, 0.64, 0.84로 나 타났다. rCBV는 rCBF에 비해 부위별로 모두 높았으며 부위 2에서 정상부위와 유사하였고 3에서는 정상부위보다 약간 높 아 rCBV map상 두 부위의 육안적 구분이 어려웠다. MTT 값 은 부위 1, 2, 3에서 점차 줄어드는 양상이었다. MTT 값은 부 위 2, 3 간에 유의한 차이는 없었다. Fig. 2는 관류량을 상자 도표로 나타낸 것이다. ROC를 이용하여 구한 부위 2, 3 사이 의 rCBF 값의 경계치는 0.75(95% confidence interval, 0.766-0.993)였으며 이는 민감도 90.0 %, 특이도 81.2 %였 다.
급성 경색 후 시간경과와 각 부위의 관류량과는 상관관계가 약하며 각 시간군별로 각 부위별 관류량 중 rCBF 및 MTT에 는 유의한 차이가 없었다(Fig. 3) (ANOVA, p > 0.05). rCBV 는 각 부위별로 시간 경과에 따라 증가하는 경향이 있었으나 유의성은 없었다(ANOVA, p > 0.05).
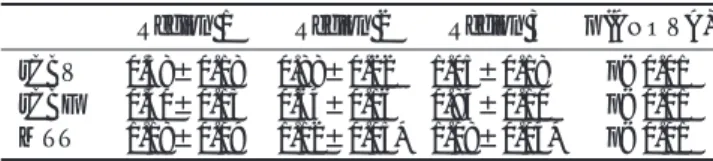
Table 1. Mean(± standard deviation) Perfusion Value in Each Region Compared to Contralateral Normal Region
Region 1 Region 2 Region 3 p (ANOVA) rCBV 0.58±0.18 0.88±0.22* 1.05±0.18* p<0.01 rCBF 0.40±0.13 0.64±0.16* 0.84±0.10* p<0.01 MTT 1.18±0.09 1.12±0.05* 1.08±0.04* p<0.01 Region 1: ischemic core; region 2: area that progressed to infarc- tion; and region 3: hypoperfused but survived area
rCBV: relative cerebral blood volume; rCBF: relative cerebral blood flow; and MTT: mean transit time
*: No significant difference between groups (Bonferroni post hoc analysis)
고 찰
저자들의 연구결과 초기경색부위와 경색진행부위 및 저혈류 생존부위의 관류량은 rCBV, rCBF 및 MTT 지도상 유의한 차 이를 보였다. 경색진행부위와 저혈류생존부위 간의 관류량은 rCBF 및 rCBV 값이 통계적으로 유의한 차이를 보였다. 경색 진행부위와 생존부위를 구분하는 rCBF 값의 경계치는 0.75였 다.
경색진행부위와 생존부위를 구분하는데 rCBF map이 가장 유용하다는 사실은 관류 MR을 이용한 유사한 연구에서 대체 로 일치된다(10-12). 그러나 각 부위의 평균 관류량에는 연 구자에 따라 차이가 있었으며 부위 1의 경우 rCBF ratio는 0.12-0.44, 부위 2의 경우 0.35-0.57, 부위 3은 0.58-0.78 등으로 보고되었다(Table 2) (4, 9-11, 13, 14). 저자들의
rCBF 값은 부위 1, 2, 3이 각각 0.40, 0.64, 0.84로 Grandin 등(9)이 발표한 0.44, 0.57, 0.78 연구결과와 매우 유사하였 다. 이에 비해 Rohl, Schaeffer 등(10, 11)의 연구에서는 각 부위 rCBF 값이 모두 적게 나타났다. 부위 2-3의 경계치도 저자들은 0.75로 Rohl 등(10)의 0.59와 차이가 있었다.
rCBV는 rCBF에 비해 높아서 부위별로 0.59, 0.88, 1.05로 나왔으며 이는 부위별로 유의한 차이가 있으나 실제 부위 2, 3의 관류량은 정상부위와 유사하여 두 부위의 구분이 사실상 어려웠으며 통계적 유의성과 상관없이 임상적으로는 의미가 적을 것으로 생각된다.
다른 연구에서도 rCBV 값은 유사한 결과를 보였는데 각 부 위별 유의성은 연구에 따라 차이가 있었다. rCBV 값이 높게 나타나는 것은 경색 후 뇌관류의 변화과정을 통해 설명될 수 있다. 경색 초기 혈류가 차단되어 뇌혈류량이 감소하면 이를 보상하기 위해 자동조절기능(autoregulation)이 작동하고 이에
A B
C
Fig. 2. Box plots of the perfusion values of the lesion- to-contralateral normal area by percentage.
A. Relative cerebral blood volume (rCBV) ratios, B.
Relative cerebral blood flow (rCBF) ratios, and C.
Mean transit time (MTT) ratios. The box extends from the first quartile to the third quartile of the data with the line in the center of each box represents the mean value. End point of each bar represents the smallest and largest values. Empty circle in the graph repre- sents outliers. Mean perfusion value in each region showed significant different on all perfusion maps.
Region 1: ischemic core; region 2: area that progressed to infarction; and region 3: hypoperfused but survived area
A B
C
Fig. 3. Changes of mean relative value of each region according to the time duration after symptom onset.
A. Mean relative CBV ratios, B. Mean relative CBF ra- tios, and C. Mean MTT ratios.
There was no significant correlation between perfu- sion values and time duration after symptom onset in each region on all maps
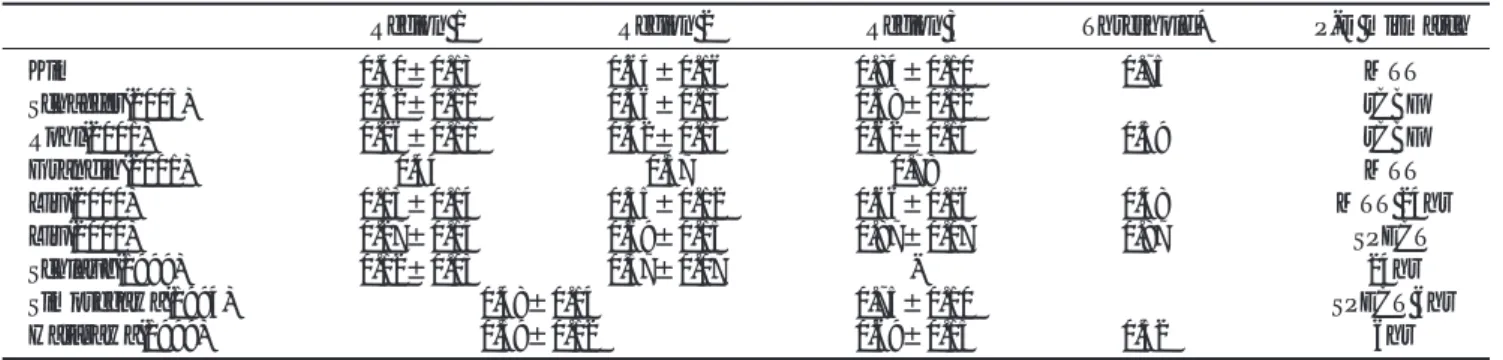
Table 2. Comparison of rCBF Value in Each Region with Other Reports
Region 1 Region 2 Region 3 Threshold* P-D mismatch
Kim 0.40±0.13 0.64±0.16 0.84±0.10 0.75 MTT
Schaefer(2003) 0.32±0.11 0.46±0.13 0.58±0.12 rCBF
Rohl(2001) 0.26±0.11 0.42±0.14 0.62±0.14 0.59 rCBF
Grandin(2001) 0.44 0.57 0.78 MTT
Liu(2000) 0.13±0.14 0.35±0.12 0.66±0.16 0.48 MTT 24hr
Liu(2000) 0.27±0.14 0.69±0.15 0.87±0.07 0.87 SPECT
Schlaug(1999) 0.12±0.03 0.37±0.07 - 24hr
Simosegawa(1994) 0.48±0.14 0.75±0.10 SPECT 6hr
Hatazawa(1999) 0.39±0.12 0.69±0.15 0.52 6hr
Region 1: ischemic core; region 2: area that progressed to infarction; and region 3: hypoperfused but survived area rCBV: relative cerebral blood volume; rCBF: relative cerebral blood flow; and MTT: mean transit time
P-D : Perfusion-Diffusion
SPECT: single photon emission computed tomography; hr:hour
* between regions 2 and 3
의해 rCBV는 증가한다(15). 경색이 진행되면 자동조절기능이 상실되어 rCBF와 rCBV가 같이 감소하며 이에 따라 조직은 경 색에 빠지게 된다. 저혈류 생존부위의 rCBV가 반대측 정상부 위보다 높게 나타나는 것은 자동조절기능에 의해 혈관이완이 일어난 것으로 해석될 수 있을 것이다. MTT 값도 부위 1, 2, 3에 따라 유의한 차이가 있는 것으로 나타났으나 부위 2, 3사 이에는 유의한 차이가 없었다. 각 부위의 평균 관류량이나 경 계치는 연구에 따라 차이가 있다. 이의 원인은 여러 가지가 있 을 수 있지만 확산관류 불일치를 판단할 때 어떤 관류지도를 바탕으로 한 것인지가 중요한 원인의 하나로 생각된다. 즉, 저 자들이나 Grandin 등(9)은 불일치를 판단하는 관류지도로 MTT 지도를 사용함으로써 관류 이상 범위를 가장 크게 평가 하게 되고 이에 따라 관류량 평균, 특히 생존부위의 평균 관 류량이 높게 나타났으며 이에 따라 두 부위 경계치도 높게 나 타난 것으로 생각된다. 이에 반해 Rohl, Schaeffer 등(10, 11) 은 불일치를 판단하는데 rCBF 지도를 이용하였으며 이는 각 부위 관류량, 특히 부위 3의 관류량이 적게 나타난 것으로 보 인다. 관류 확산 불일치를 판단하는데 어떤 관류지도를 기준 으로 하는 것이 좋은지에 대한 결론은 아직 없는 것으로 보이 며 일반적으로 혈류 저하에 민감도가 가장 높은 MTT 지도를 많이 사용한다. 조직의 생존 여부와 별개로 혈류가 떨어진 부 위를 가장 정확하게 반영한다는 점에서 저자들은 MTT지도를 사용하였고 또한 측정의 정확성도 다른 관류지도에 비해 높은 장점이 있는 점도 고려되었다(4, 9, 16, 17).
관류량 측정의 후처리 방법도 연구결과의 차이를 가져오는 원인이 될 수 있을 것으로 생각된다. 저자들이 사용한 관류 software program은 arterial input function을 측정하지 않고 따라서 deconvolution의 과정도 거치지 않았다. 그러므로 정확 한 정량적 측정으로 보기는 어렵다. 그러나 arterial input function의 측정 및 deconvolution의 과정 처리가 기술적으로 어렵고 시간이 오래 걸리며 또한 이러한 방법을 통해서도 정 확한 정량적 측정을 보장하기는 어려우므로 저자들의 경우와 같이 시간-신호강도곡선으로부터 각 관류량을 산출하는 방법 도 실제 임상환경에서는 사용되고 있으며 실용성의 측면에서 유용한 방법이다(18, 19). 그러나 이러한 측정방법의 차이에 의하여 서로 다른 연구 사이에서 각 부위 관류량의 차이가 나 타날 가능성이 있다. 그 외에도 대상환자를 경색 후 몇 시간 까지 포함했는지, ROI의 측정방법 등에 따라서도 차이가 날 수 있다.
실제 임상환경에서 정확한 관류량을 측정하기가 매우 어렵 고 사용하는 측정방법과 software program이 서로 달라 표준 적인 평균 관류량이나 경계치를 제시하기는 어렵다. 그러나 실 제 임상환경에서 뇌경색 환자의 치료방침을 정하거나 경색진 행을 예측하는데 이러한 수치는 참고로 사용될 수 있을 것이 다.
경과시간과의 상관관계
경색 후 경과시간에 따른 부위별 관류량은 rCBV의 경우 시 간경과에 따라 약간 증가하는 경향을 보였으나 통계적으로 유
의한 차이는 없었다. rCBF 및 MTT의 경우 시간경과와 상관 관계가 없었다. 이는 적어도 12시간 이내에는 부위별 관류량 의 변화가 적다는 것으로 해석될 수 있다. 이는 동물실험에서 시간경과에 따라 경색부위 및 주변부의 rCBF 및 rCBV가 감 소하는 소견과는 차이가 있었다(20). 그러나 본 연구에서는 각 집단의 환자에서 단일시점의 관류량을 비교한 것으로 같은 개체를 추적 관찰한 동물실험 결과와 직접적으로 비교하기는 어려울 것으로 생각된다. 12시간 이내의 급성경색기에 환자를 대상으로 관류량의 변화를 연구한 논문은 많지 않다. Fiehler 등(21)의 연구에서 6시간 이내의 경색환자를 MR을 시행한 경 과시간에 따라 3시간 이내 및 3-6 시간 집단으로 나누었을 때에 두 집단간 확산 및 관류이상 부위의 용적에 차이가 없는 것으로 보고하여 본 연구와 유사한 결과를 보였지만, Lin 등 (22)의 연구에서는 경색부위의 CBF 경계치가 2-4시간 경과 집단보다 4.5-6.5시간 경과집단에서 높게 나타나 본 연구와 는 차이가 있었다. 초급성기 경색부위와 주변부의 시간경과에 따른 관류량의 변화에 대해서는 연구가 많지 않고 그 결과도 일치되지 않는 것으로 보이며 이에 대해서는 더 연구가 되어 야 할 것으로 생각된다.
본 연구의 제한점으로는 첫째, 자발성 혈류 재개통환자가 포 함되었을 가능성이 있고 이에 따라 경색으로 진행될 부위가 저혈류 생존부위로 바뀌었을 가능성이 있다. 그러나 정확한 혈 류 재개통 시점을 알기 어려우므로 이러한 환자를 대상에서 배제하는 데는 한계가 있을 것으로 생각된다. 둘째, 관류량 측 정의 후처리에 있어 arterial input function을 계산하지 않은 점이며 이에 대해서는 앞서 고찰하였다. 셋째, 본 연구에서 시 간경과에 따른 변화는 같은 대상에서 순차적으로 측정한 것이 아니고, 다른 대상에서 단일 시점의 측정 결과를 분석한 것으 로 각 부위의 관류량의 변화를 정확하게 반영하기 어려운 면 이 있다.
본 연구에서는 초급성 경색환자의 초기경색부위, 경색진행 부위, 및 저혈류 생존부위의 관류량을 정량적으로 분석하였는 데 각 부위 간 rCBV, rCBF 및 MTT 값에 유의한 차이가 있 었으며 경색진행부위와 저혈류 생존부위를 구분할 수 있는 것 은 rCBF였다. 부위별 관류량은 시간경과에 따른 차이는 적었 다. 본 연구의 결과를 이용하면 경색위험부위의 존재 여부를 저혈류 생존부위와 구분하여 파악하고 혈전용해술 등의 치료 방침을 정하는데 도움이 될 것으로 생각된다. 그러나 MR 검 사방법이나 측정방법 등에 따라 부위별 관류량이나 경계치가 달라 일정한 수치를 제시하기는 어려우므로 현재로서는 보조 적 도구로 사용하는 것이 타당한 것으로 생각된다.
참 고 문 헌
1. National Institute of Neurological Disorders and Stroke rt-PA Stroke Study Group. Tissue plasminogen activator for acute is- chemic stroke. N Engl J Med 1995;333:1581-1587
2. Hacke W, Kaste M, Fieschi C, Toni D, Lesaffre E, von Kummer R, et al. Intravenous thrombolysis with recombinant tissue plasmino- gen activator for acute hemispheric stroke: the European
Cooperative Acute Stroke Study (ECASS). JAMA 1995;274:1017- 1025
3. Furlan A, Higashida R, Wechsler L, Gent M, Rowley H, Kase C, et al. Intra-arterial prourokinase for acute ischemic stroke. The PROACT II study: a randomized controlled trial. Prolyse in acute cerebral thromboembolism. JAMA 1999;282:2003-2011
4. Schlaug G, Benfield A, Baird AE, Siewert B, Lovblad KO, Parker RA, et al. The ischemic penumbra: operationally defined by diffu- sion and perfusion MRI. Neurology 1999;53:1528-1537
5. Kidwell CS, Saver JL, Mattiello J, Starkman S, Vinuela F, Duckwiler G, et al. Thrombolytic reversal of acute human cerebral ischemic injury shown by diffusion/perfusion magnetic resonance imaging. Ann Neurol 2000;47:462-469
6. Sunshine JL, Tarr RW, Lanzieri CF, Landis DM, Selman WR, Lewin JS. Hyperacute stroke: ultrafast MR imaging to triage pa- tients prior to therapy. Radiology 1999;212:325-332
7. Schellinger PD, Fiebach JB, Hacke W. Imaging-based decision making in thrombolytic therapy for acute ischemic stroke: present status. Stroke 2003;34:575-583
8. Kidwell CS, Alger JR, Saver JL. Beyond mismatch: evolving para- digms in imaging the ischemic penumbra with multimodal mag- netic resonance imaging. Stroke 2003;34:2729-2735
9. Grandin CB, Duprez TP, Smith AM, Oppenheim C, Peeters A, Robert AR, et al. Which MR-derived perfusion parameters are the best predictors of infarct growth in hyperacute stroke?
Comparative study between relative and quantitative measure- ments. Radiology 2002;223:361-370
10. Rohl L, Ostergaard L, Simonsen CZ, Vestergaard-Poulsen P, Andersen G, Sakoh M, et al. thresholds of ischemic penumbra of hyperacute stroke defined by perfusion-weighted MRI and appar- ent diffusion coefficient. Stroke 2001;32:1140-1146
11. Schaefer PW, Ozsunar Y, He J, Hamberg LM, Hunter GJ, Sorensen AG, et al. Assessing tissue viability with MR diffusion and perfusion imaging. AJNR Am J Neuroradiol 2003;24:436-443 12. Grandin CB, Duprez TP, Smith AM, Mataigne F, Peeters A,
Oppenheim C, et al. Usefulness of magnetic resonance-derived quantitative measurements of cerebral blood flow and volume in prediction of infarct growth in hyperacute stroke. Stroke 2001;32:
1147-1153
13. Liu Y, Karonen JO, Vanninen RL, Ostergaard L, Roivainen R, Nuutinen J, et al. Cerebral hemodynamics in human acute is- chemic stroke: a study with diffusion- and perfusion-weighted magnetic resonance imaging and SPECT. J Cereb Blood Flow Metab 2000;20:910-920
14. Hatazawa J, Shimosegawa E, Toyoshima H, Ardekani BA, Suzuki A, Okudera T, et al. Cerebral blood volume in acute brain infarc- tion: a combined study with dynamic susceptibility contrast MRI and 99mTc-HMPAO-SPECT. Stroke 1999;30:800-806
15. Powers W. Cerebral hemodynamics in ischemic cerebrovascular disease. Ann Neurol 1991;29:231-240
16. Sorensen AG, Copen WA, Ostergaard L, Buonanno FS, Gonzalez RG, Rordorf G, et al. Hyperacute stroke: simultaneous measure- ment of relative cerebral blood volume, relative cerebral blood flow, and mean tissue transit time. Radiology 1999;210:519-527 17. Neumann-Haefelin T, Wittsack HJ, Wenserski F, Siebler M, Seitz
RJ, Modder U, et al. Diffusion- and perfusion-weighted MRI. The DWI/PWI mismatch region in acute stroke. Stroke 1999;30:1591- 1597
18. Sorensen AG, Reimer P. Cerebral MR Perfusion Imaging:
Principles and Current Applications. New York, NY: Thieme Med Pub; 2001
19. Barbier EL, Lamalle L, Decorps M. Methodology of brain perfu- sion imaging. J Magn Reson Imaging 2001;13:496-520
20. Rohl L, Sakoh M, Simonsen CZ, Vestergaard-Poulsen P, Sangill R, Sorensen JC, et al. Time evolution of cerebral perfusion and appar- ent diffusion coefficient measured by magnetic resonance imaging in a porcine stroke model. J Magn Reson Imaging 2002;15:123-129 21. Fiehler J, Kucinski T, Knudsen K, Rosenkranz M, Thomalla G,
Weiller C, et al. Are there time-dependent differences in diffusion and perfusion within the first 6 hours after stroke onset? Stroke 2004;35:2099-2104
22. Lin W, Lee JM, Lee YZ, Vo KD, Pilgram T, Hsu CY. Temporal re- lationship between apparent diffusion coefficient and absolute measurements of cerebral blood flow in acute stroke patients.
Stroke 2003;34:64-70
J Korean Radiol Soc 2007;56:423-430
Address reprint requests to : Sang Jun Kim, M.D. Department of Radiology, University of Ulsan, Asan Medical Center 388-1 Poong Nap-dong, Songpa-gu, Seoul 138-736, Korea.
Tel. 82-2-3010-4400 Fax. 82-2-476-4719 E-mail: sjkim@amc.seoul.ac.kr
Assessment of Tissue Viability in Hyperacute Infarction with Using the Diffusion- and Perfusion-weighted Images
1Mi Ock Huh, M.D., Sang Joon Kim, M.D., Jeong Hyun Lee, M.D., Deok Hee Lee, M.D., Choong Gon Choi, M.D., Dae Chul Suh, M.D.
1Department of Radiology, University of Ulsan, Asan Medical Center
Purpose: The presence of a perfusion-diffusion mismatch is a useful indicator for predicting the progression of acute cerebral infarction. However, not all the area of the perfusion-diffusion mismatch progresses to infarc- tion and a large proportion survives with hypoperfusion. The purpose of this study was to assess 1) whether tissue viability can be predicted using quantitative perfusion values and 2) whether there is correlation be- tween the perfusion value and the time that elapsed after the onset of symptoms.
Materials and Methods: Twenty-two patients with acute infarction in the middle cerebral artery territory with- in 12 hours after symptom onset were included in this study. We excluded those patients in whom thromboly- sis was attempted or the lesion volume was less than 5 mL. Patients without perfusion-diffusion mismatch on the mean transit time (MTT) map were also excluded. We categorized the ischemic lesions into 3 areas: 1) the initial infarction, 2) the area that progressed to infarction, and 3) the hypoperfused but surviving area, based on the initial and follow up diffusion-weighted images and initial mean transit time (MTT) map. We obtained the relative cerebral blood volume (rCBV), the cerebral blood flow (rCBF) and the MTT in each area by com- paring to the contralateral normal area. Statistical analysis was performed using one-way ANOVA to test whether there was a difference in perfusion values between each area. The threshold value was calculated be- tween areas 2 and 3 using the receiver operating characteristics curve. We analyzed the correlation between the perfusion values of each area and the time that elapsed after the inset of symptoms.
Results: The perfusion values among each region were significantly different on the rCBV, rCBF and MTT maps. Between regions 2 and 3, the rCBV and rCBF maps showed a significant difference (Bonferroni post hoc analysis), but in case of rCBV, the mean perfusion values in each region approached to the normal level and it was difficult to differentiate between the two regions on the rCBV map. The rCBF in the regions 1, 2 and 3 was 0.40, 0.64, and 0.84, respectively. The difference of the threshold values of the rCBF between regions 2 and 3 was 0.75. There was no significant correlation between the time that elapsed after symptom onset and the perfusion values of each region on the rCBV, rCBF and MTT map.
Conclusion: The perfusion values between the area of the initial infarction, the area that progressed to infarc- tion and the hypoperfused but surviving area showed significant differences. The rCBF was the most useful parameter in differentiating between areas that progressed to infarction and the surviving areas. Quantitative measurement of the perfusion values may have a role in selecting the candidates for thrombolysis after they have suffered hyperacute stroke.
Index words :Brain, diffusion Brain, Infarction
Magnetic resonance (MR), diffusion study Magnetic resonance (MR), perfusion study