Numerical Study on Propulsion Performance Enhancement of Superdetonative mode Ram Accelerator by using strong mixture
Kunmin Sung and In-Seuck Jeung
Institute of Advanced Aerospace Technology, Seoul National University Shillim-dong, Gwanak-gu, Seoul, 151-742, Republic of Korea Keywords: RAMAC, Ram Accelerator, Detonation, Superdetonative
Abstract
A numerical study is conducted to investigate propulsion performance enhancement based on S225 experiment case of ISL (French-German Research Institute of Saint-Louis)’s superdetonative ram accelerator. For govern equation, multi-species Navier-Stokes equation coupled with Baldwin-Lomax turbulence modeling is used. Govern equation is discretized by Roe’s FDS and integrated by LU-SGS time integration. Detailed chemical reaction about H
2/O
2/CO
2for high pressure is considered.
2H
2+O
2+2.5CO
2mixture was used for propellant gas.
For the same over-driven factor, the launching speed of computation was faster than one of S225. Another configuration and condition of S225 was applied. A flame structure is very different from S225. For strong mixture case, it shows ignition by viscous effect.
Acceleration and speed increment is higher than S225 computation and experiment. By using more strong mixture, propulsion performance was enhanced.
Introduction
The concept of ram accelerator is that accelerating projectile with synchronized combustion in tube filled with pre-mixed combustible gas mixture. Projectile can be accelerated continuously along accelerating tube. Speed of ram projectile is limited by speed of combustion wave. Final speed of ram projectile can be very high by using multi-stage accelerating tube filled with optimum mixture. Ram accelerator is being developed for hypervelocity launchers or direct launcher to low earth orbit. Ram Accelerator facilities also have major benefits for hypersonic research. The gas dynamics phenomena in ram accelerator are very similar to those expected ones in scramjet and oblique detonation wave engines. Therefore, study on ram accelerator operation will enhance the understanding of supersonic combustion and hypersonic propulsion system.
Despite the number of research programs around the world, a maximum speed of 2.7 km/s was only available at the UW (University of Washington) ram accelerator facility starting with subsonic combustion behind the projectile which was moving initially at subdetonative speeds
1). Thus, to obtain higher velocities than 2.7 km/s, combustion mode must be the superdetonative mode, where ignition and
combustion occur at supersonic flow speeds in the space formed between projectile and tube wall.
Based on this motivation, ISL (French-German Research Institute of Saint-Louis) has developed a rail tube version of a ram accelerator facility named RAMAC 30 version II that directly launching projectile superdetonative speed (the speed faster than Chapman-Jouguet detonation wave speed). In this facility, a cylindrical projectile having conical fore- and after-bodies was launched by a powder gun and accelerated in a ram accelerator tube having four or five guide rails
2). Although the initial launching speed of a powder gun was only about 1.8 km/s, the superdetonative launch was possible by using the H
2/O
2/CO
2mixture having a lower C-J (Chapman- Jouguet) detonation wave speed.
ISL’s RAMAC 30 demonstrated that ignition and acceleration was successful with an aluminum projectile but acceleration was not observed with a steel projectile. An aluminum projectile suffered severe ablation with significant mass loss
3). These facts show that there is an important ignition mechanism which is strongly related to the melting and combustion of aluminum projectile by friction, and heat conduction.
At the earlier stage of ram accelerator studies, the superdetonative mode operation had been considered to be sustained by an oblique detonation wave in the combustor. Computational studies by Yungster and Bruckner
4)and Li et al.
5)using inviscid flow model and chemical kinetics showed that ram acceleration was possible through this concept at very high velocity ranges. However, more recent viscous analyses by Yungster
6)and Choi et al.
7)showed that combustion could be initiated in the boundary layer due to the aerodynamic heating associated with shock wave / boundary layer interaction at intermediate velocity ranges where shock-heating was insufficient for mixture ignition.
The ISL’s ram accelerator experiments, however,
revealed that the previous studies on superdetonative
combustion characteristics were not applicable to the
experimental case and the other combustion
characteristics might be more important for the low
speed superdetonative mode of operation. Therefore,
to understand the combustion mechanism, numerical
simulation [12][13] was conducted for ISL’s RAMAC
30. In this paper, numerical study was conducted to
investigate enhancement of propulsion performance
by using stronger mixture.
ISL’s RAMAC 30 II Test Facility
Based on the needs of hypersonic launching facility, ISL built two ram accelerators: a 30-mm- caliber-tube, called RAMAC 30, and 90-mm-one, RAMAC 90. The superdetonative mode operation has been mainly tested in RAMAC 30 which was implemented with rail tube version II since 1997.
Figure 1 shows the schematics of RAMAC 30 test facility, which consisted of a pre-accelerator tube, a ram tube containing a combustible gas mixture with both ends sealed by diaphragms, which were broken by the moving projectile fore-body nose tip, and a decelerator tube. Two tubes with each length of 2.4m each were used forming a total ram tube length of 4.8m. Projectiles had an inner magnesium core which was fully covered by an aluminum or steel (different by experimental shot. Cylindrical projectiles of 130g~150g, 3.0 cm caliber, and 16.1 cm long, could be accelerated to 1800 m/s at the exit of the pre- accelerator tube before penetrating through the mixture in the rail tube version II.
Fig. 1 Configuration of ISL’s RAMAC30
14° 15°
3cm 4.2cm
40bar, 300K 2H2+O2+xCO2
Accelerator Tube Computational
Domain
16.1cm Projectile
1cm 1cm
Fig. 2 Computational Domain
Numerical Methods
For computational study of ram accelerator, a fully coupled form of multi-species conservation equations and Reynolds averaged Navier-Stokes equations coupled with Baldwin-Lomax turbulence modeling was used for axisymmetric geometry. Because typical operational pressure of ram accelerator is higher than 50atm, reduced kinetic mechanism for low pressure is not valid. Therefore finite-rate chemistry model for high pressure should be considered. Petersen and Hanson
8)developed reduced mechanisms to model the combustion characteristics of typical ram accelerator mixtures at pressures approaching 300atm based on the GRI-Mech. In this study, fully detailed 10 species (H, H
2, O, O
2, OH, H
2O, HO
2, H
2O
2, CO, CO
2) and 29 step reaction model for reaction of H
2/O
2/CO
2mixture was considered. Govern equation is discretized by finite volume cell vertex approach. Viscous flux is discretized by central differencing and convective flux
is obtained by Roe’s flux difference splitting method
9). Primitive variables are extrapolated at cell interface by MUSCL (Monotonic Upstream method for Scalar Conservation Law) scheme
10). Discretized equation is integrated over time by using LU-SGS scheme
11). Thrust can be evaluated by surface integration of pressure and viscous drag on surface of projectile.
Acceleration and speed of projectile is computed from thrust. By accelerating of projectile, inflow speed is updated by every iteration step.
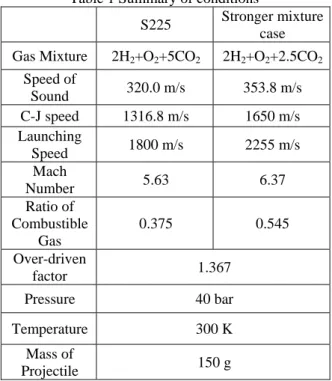
Table 1 Summary of conditions
S225 Stronger mixture
case Gas Mixture 2H
2+O
2+5CO
22H
2+O
2+2.5CO
2Speed of
Sound 320.0 m/s 353.8 m/s C-J speed 1316.8 m/s 1650 m/s Launching
Speed 1800 m/s 2255 m/s Mach
Number 5.63 6.37
Ratio of Combustible
Gas
0.375 0.545 Over-driven
factor 1.367
Pressure 40 bar
Temperature 300 K
Mass of
Projectile 150 g
Computational Modeling
Figure 2 shows computational conditions and domain. Diameters of a projectile and a tube are 3.0 cm and 4.2 cm, respectively. For the experiment, the tube wall had a decagonal cross-section with five rails but this study assumed circular for the axisymmetric simulations. The computational domain for the simulation was extended by 1cm before and after the projectile, and it was covered by the 380x100 computational grids that was uniformly distributed in the axial direction and clustered to both walls in the radial direction. Since these simulations had to cover overall flow features of the scale of the entire projectile, the computational resolution was limited.
Therefore, details of the detonation structure, such as the induction region, might not be well resolved. But our purpose was exploring the overall performance and development, so current grid resolution is enough to represent the shock and detonation position because the local transit time was sufficiently smaller than the induction time of 2H
2+O
2+2.5CO
2mixture behind the reflected shock where mixture ignition occurred.
Gas mixture used for S225 was 2H
2+O
2+5CO
2: a stoichiometric H
2/O
2mixture diluted with 5 moles of CO
2. For this study, 2H
2+O
2+2.5CO
2gas mixture is
tank powder gun
M4 M5 M6 M7 M8 M9 M10 M11
window
tank piston
decelerator tube
Ram-tube diaphragm Pressure-gauges
gas release
used: CO
2dilution decrease to half. Stoichiometric mixture ratio is 0.375 for 5CO
2dilution and 0.545 for 2.5CO
2. 2.5CO
2mixture is 45% stronger than 5CO
2dilution. C-J detonation wave speed is 1316.8m/s for of 5CO
2dilution and 1650m/s for 2.5CO
2dilution.
Over-driven factor of S225 experiment was 1.367. For same over-driven factor, initial launching speed of 2.5CO
2dilution case was 2255m/s. Mixtures for S225 experiment had a pressure and temperature of 40bar and 300K, respectively. The same condition is used for this study. Conditions for S225 experiment and computation of 2.5CO
2dilution are summarized in Table 1.
Result and Analysis Acceleration and Speed
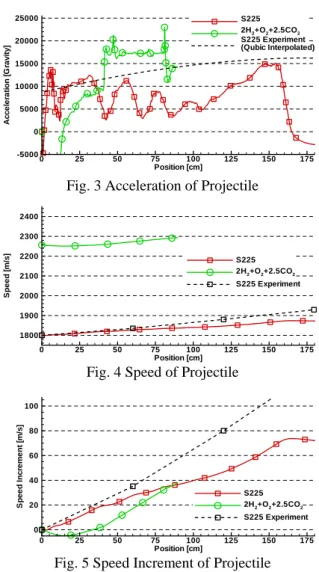
Figure 3 shows acceleration of projectile for two result of computation and experiment result of S225.
S225 experimental result shows increasing of acceleration from 10000G to 16000G by advance of projectile. Computational result of S225 shows fluctuation by detonation/shockwave oscillation [12].
An initial acceleration of computational result of 2.5CO
2dilution is negative, but it increase to 9500G near at 37cm. It jumps to 21000G near at 47cm and
stay at 17000G between 50cm and 80cm. An average acceleration is 17218G between two points. It suddenly jumps to 23000G at 81cm and decreases to 11000G at 83cm.
Figure 4 and 5 shows speed and speed increment of projectile. S225 experimental and computational results are agree about initial behavior, but computational result has difference by detonation/
shockwave oscillation. For 2H
2+O
2+2.5CO
2case, speed decrease between starting point and 14cm.
Speed increases after 14cm and recover starting speed near 34cm and continuously increasing to 50 cm.
Between 50cm and 80cm, speed increasing rate is almost constant and speed increment between two points is 22.24m/s.
Flame Structure
Figure 6 and 7 show pressure and temperature contour for computation result of 2H
2+O
2+2.5CO
2at 5.9cm. Pressure contour shows simple shockwave structure. Conical shockwave generated by fore-body is reflected on accelerator tube wall and hit projectile surface. Flame exists only at near projectile surface and does not contribute to thrust. Because initial acceleration is negative, speed is deceasing between starting point and 14cm. Figure 8 and 9 show results at 31.5 cm. Figure 8 shows fully developed shockwave reflection structure. Two figures shows typical shock induces combustion. Combustion is following shockwave and combustion wave is separated from shockwave. At this point, acceleration is about 8000G. Pressure of aft-body surface is relatively higher than one of fore-body. Figure 10 and 11 show results at 42.3cm. Two figures also show shock induced combustion. But, compare to figure 8 and 9, gap between combustion wave and shockwave is decrease. Pressure after shockwave is much higher than one of 31.5cm. Acceleration at this point is about 18000G. Figure 12 and 13 show results at 47.1cm.
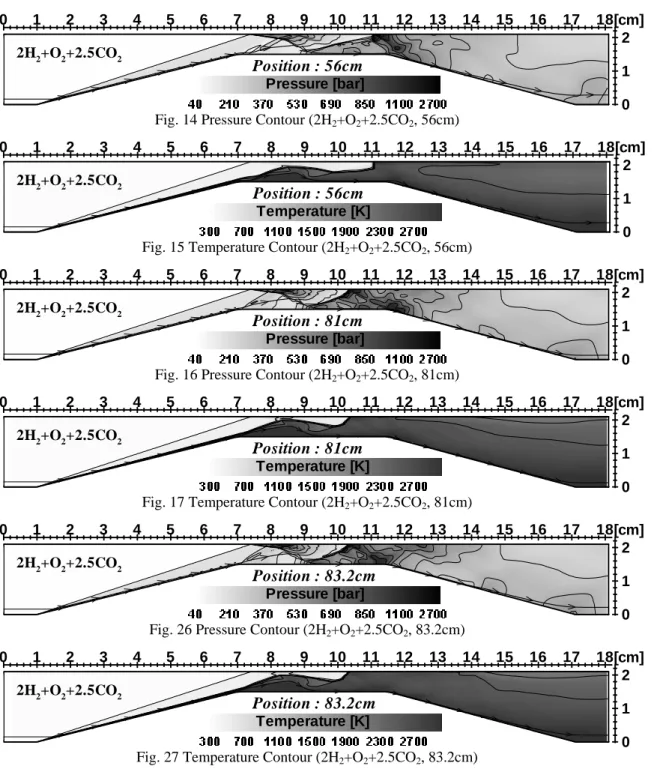
Combustion wave and shockwave is coupled at near the accelerator tube wall and developed to detonation wave. Global shockwave structure behind combustor section is similar to one of 42.3cm but pressure of expansion section is higher than one of 42.3cm by the detonation wave. Acceleration at this point is 21000G and higher than one of 42.3cm. Figure 14 and 15 show results at 56cm. High pressure region behind detonation wave contribute to high acceleration.
Acceleration is almost constant between 50cm and 80cm. Figure 16 and 17 show results at 81cm.
Detonation wave becomes stiffer than one of 56cm.
And expansion wave behind combustor is almost canceled by reflected shockwave at tube wall. As result this point shows maximum acceleration (about 23000G). Figure 18 and 19 show results at 83.2 cm.
The shockwave/detonation wave structure is not so much different. But impinging point by reflected shockwave move ahead and expansion wave is stronger than one of 81cm. So acceleration decreases to 10920G at this point.
Position [cm]
Acceleration[Gravity]
0 25 50 75 100 125 150 175
-5000 0 5000 10000 15000 20000 25000
S225 Experiment (Qubic Interpolated) S225
2H2+O2+2.5CO2
Fig. 3 Acceleration of Projectile
Position [cm]
Speed[m/s]
0 25 50 75 100 125 150 175
1800 1900 2000 2100 2200 2300 2400
S225 Experiment S225 2H2+O2+2.5CO2
Fig. 4 Speed of Projectile
Position [cm]
SpeedIncrement[m/s]
0 25 50 75 100 125 150 175
0 20 40 60 80 100
S225 Experiment S225 2H2+O2+2.5CO2
Fig. 5 Speed Increment of Projectile
0 1 2 3 4 5 6 7 8 9 10 11 12 13 14 15 16 17 18
0 1 2 Temperature [K]
[cm]
Position : 5.9cm
2H2+O2+2.5CO20 1 2 3 4 5 6 7 8 9 10 11 12 13 14 15 16 17 18
0 1 2 Pressure [bar]
[cm]
Position : 31.5cm
2H2+O2+2.5CO2Fig. 6 Pressure Contour (2H
2+O
2+2.5CO
2, 5.9cm)
Fig. 7 Temperature Contour (2H
2+O
2+2.5CO
2, 5.9cm)
Fig. 8 Pressure Contour (2H
2+O
2+2.5CO
2, 31.5cm)
Fig. 9 Temperature Contour (2H
2+O
2+2.5CO
2, 31.5cm)
0 1 2 3 4 5 6 7 8 9 10 11 12 13 14 15 16 17 18
0 1 2 Temperature [K]
[cm]
Position : 31.5cm
2H2+O2+2.5CO20 1 2 3 4 5 6 7 8 9 10 11 12 13 14 15 16 17 18
0 1 2 Pressure [bar]
[cm]
Position : 5.9cm
2H2+O2+2.5CO2Fig. 11 Temperature Contour (2H
2+O
2+2.5CO
2, 42.3cm)
Fig. 12 Pressure Contour (2H
2+O
2+2.5CO
2, 47.1cm)
Fig. 13 Temperature Contour (2H
2+O
2+2.5CO
2, 47.1cm) Fig. 10 Pressure Contour (2H
2+O
2+2.5CO
2, 42.3cm)
0 1 2 3 4 5 6 7 8 9 10 11 12 13 14 15 16 17 18
0 1 2 Temperature [K]
[cm]
Position : 42.3cm
2H2+O2+2.5CO20 1 2 3 4 5 6 7 8 9 10 11 12 13 14 15 16 17 18
0 1 2 Pressure [bar]
[cm]
Position : 42.3cm
2H2+O2+2.5CO20 1 2 3 4 5 6 7 8 9 10 11 12 13 14 15 16 17 18
0 1 2 Temperature [K]
[cm]
Position : 47.1cm
2H2+O2+2.5CO20 1 2 3 4 5 6 7 8 9 10 11 12 13 14 15 16 17 18
0 1 2 Pressure [bar]
[cm]
Position : 47.1cm
2H2+O2+2.5CO2Compare of Propulsion Performance
Acceleration of S225 experiment is increasing as advanced of projectile. An averaged acceleration near 50cm is about 12000G. For the case of 2.5CO
2dilution, steady acceleration between 50cm and 80cm is about 17200G. Steady acceleration performance is 43% higher by changing the mixture. For 2.5CO
2dilution, 3 mole is combustible in total 5.5 mole (2H
2+O
2+2.5CO
2, ratio of combustible gas is 37.5%).
For 5CO
2dilution, 3 mole is combustion in total 8 mole (2H
2+O
2+5CO
2, ratio of combustible gas is 54.5%). 2.5CO
2dilution mixture has 45% more effective combustible mixture and energy than 5CO
2dilution by simple theory. It shows good performance
increasing according to ratio of acceleration versus input energy.
Conclusion
A numerical study was conducted to investigate enhancement of propulsion performance by using stronger mixture. As result, acceleration increase by proportion of energy in gas mixture.
Acknowledgement
This work was supported by the Korea Science and Engineering Foundation (KOSEF) through the National Research Lab. Program funded by the Ministry of Science and Technology (No.
Fig. 14 Pressure Contour (2H
2+O
2+2.5CO
2, 56cm)
Fig. 15 Temperature Contour (2H
2+O
2+2.5CO
2, 56cm)
Fig. 16 Pressure Contour (2H
2+O
2+2.5CO
2, 81cm)
Fig. 17 Temperature Contour (2H
2+O
2+2.5CO
2, 81cm)
0 1 2 3 4 5 6 7 8 9 10 11 12 13 14 15 16 17 18
0 1 2 Temperature [K]
[cm]
Position : 56cm
2H2+O2+2.5CO20 1 2 3 4 5 6 7 8 9 10 11 12 13 14 15 16 17 18
0 1 2 Pressure [bar]
[cm]
Position : 56cm
2H2+O2+2.5CO20 1 2 3 4 5 6 7 8 9 10 11 12 13 14 15 16 17 18
0 1 2 Pressure [bar]
[cm]
Position : 81cm
2H2+O2+2.5CO20 1 2 3 4 5 6 7 8 9 10 11 12 13 14 15 16 17 18
0 1 2 Temperature [K]
[cm]
Position : 81cm
2H2+O2+2.5CO20 1 2 3 4 5 6 7 8 9 10 11 12 13 14 15 16 17 18
0 1 2 Temperature [K]
[cm]
Position : 83.2cm
2H2+O2+2.5CO20 1 2 3 4 5 6 7 8 9 10 11 12 13 14 15 16 17 18
0 1 2 Pressure [bar]
[cm]