Article https://doi.org/10.14478/ace.2020.1071
1. Introduction
1)Over the past 50 years, plasma spraying has become a well-estab- lished and widely used technology with various applications ranging from corrosion-, temperature-, and abrasion-resistant coatings to the production of monolithic and near-net shapes of metallic and ceramic parts[1-5]. Currently, more than 90% of industrial spray systems oper- ate on conventional direct current (DC) plasma torches with stick-type cathodes. An example of a DC torch is the Triplex® II plasma spray
† Corresponding Author: Gyeongnam National University of Science and Technology (GNTECH), Department of Energy Engineering, Future Convergence Technology Research Institute, Jinju 52725, Republic of Korea Tel: +82-55-751-3885 e-mail: [email protected]
pISSN: 1225-0112eISSN: 2288-4505 @ 2020 The Korean Society of Industrial and Engineering Chemistry. All rights reserved.
gun (Sulzer Metco AG, Wohlen, Switzerland), which is based on three counter insulated cathodes supplied by independent sources. The cath- odes distribute the electrical energy to three parallel arcs sticking at a unique anode preceded by insulating rings, which permits the gen- eration of a long arc of high voltage[6-8].
However, atmospheric plasma spraying (APS) is a complex process in which several factors influence the resulting coating proper- ties[9-12]. It is, especially, important to control the temperature on the surface of the substrate during spraying. For example, Bounazef et al.
suggested the correlations between the temperature (process parame- ters) and the friction coefficient mainly explained by the effect of the process parameters on the in-flight particle characteristics and the APS spray temperature[13]. Later, Soltani et al.[14] also reported the effect of atmospheric plasma spraying (APS) process parameters such as hy- drogen flow rate as the secondary plasma gas and coating temperature
대기압 플라즈마 용사 공정에서의 기판 코팅 온도 영향 연구
이기영*,**ㆍ오현철***,†
*경북대학교 미래과학기술융합학과, **경북대학교 나노소재공학부, ***경남과학기술대학교 에너지공학과 미래융복합연구소 (2020년 9월 4일 접수, 2020년 10월 19일 수정, 2020년 10월 20일 채택)
Measurement of the Coating Temperature Evolution during Atmospheric Plasma Spraying
Kiyoung Lee*,** and Hyunchul Oh***,†
*Department of Advanced Science and Technology Convergence, Kyungpook National University, Sangju 37224, Republic of Korea
**School of Nano & Materials Science and Engineering, Kyungpook National University, Sangju 37224, Republic of Korea
***Department of Energy Engineering, Future Convergence Technology Research Institute, Gyeongnam National University of Science and Technology (GNTECH), Jinju 52725, Republic of Korea
(Received September 4, 2020; Revised October 19, 2020; Accepted October 20, 2020)
초 록
대기 플라즈마 용사(APS)법을 이용한 지르코니아 열차폐 코팅의 보다 효과적인 온도 제어를 위해서는 기판 온도에 영향을 미치는 매개 변수에 대한 이해가 필수적이며 실험 데이터를 기반으로 한 더 많은 결과가 필요하다. 본 연구는 APS (atmospheric plasma sprayed) 공정에서 기판 온도 제어에 관한 연구를 목적으로 한다. 특히, APS 기판 코팅과정에 서 기판 표면 온도 제어를 위한 공랭 시스템, 플라즈마 가스 흐름, 분말 공급 속도, 로봇 속도 및 기판소재 영향 등을 보고하고 있다. 이러한 체계적인 접근은 APS 방식의 표면 코딩에서 온도를 제어하는데 도움이 되며, 이는 코팅 품질 의 향상으로 이어질 것이다.
Abstract
For more effective temperature control of atmospheric plasma sprayed (APS) zirconia thermal barrier coating, understanding of the parameters, which influence the substrate temperature, is essential and also more numerical results based on the ex- perimental data are required. This study aims to investigate the substrate temperature control during an APS process. The APS process deals with air-cooled systems, plasma-gas flow, powder feed rate, robot velocity, and substrate effect on the substrate surface temperature control during the process. This systematic approach will help to handle the temperature control, and thus lead to better coating quality.
Keywords: Thermal barrier coatings, Atmospheric plasma spray, Thermal spray processes
Figure 1. Important parameters within the operating system[13].
(spraying distance) on wear behavior. This coating temperature is also influenced to mechanical or chemical properties. Waki et al.[15] found that the high temperature thermal treatment in air was effective in in- creasing the bending strength and Young’s modulus in particular to APS coating. Rico investigated that the Isothermal oxidation at high temperature performed on nanostructured and conventional alumi- na-titania APS coatings at different exposure times in air environment.
They suggested that APS coating is successful deposition technique to manufacture nanostructured coating[16]. Thus, to achieve constant high coating quality, the influence of these factors on the surface temper- ature should be considered. Therefore, for more effective temperature control of plasma sprayed coating, it is necessary to understand the pa- rameters, which influence the surface temperature[17,18] (see Figure 1) and also, more experimental results are needed to support the influ- enced factors.
This study aims at investigating the effects of several parameters such as air cooling, plasma-gas flow, power feed rate, robot velocity, and substrate material on the surface coating temperature during APS.
2. Experimental
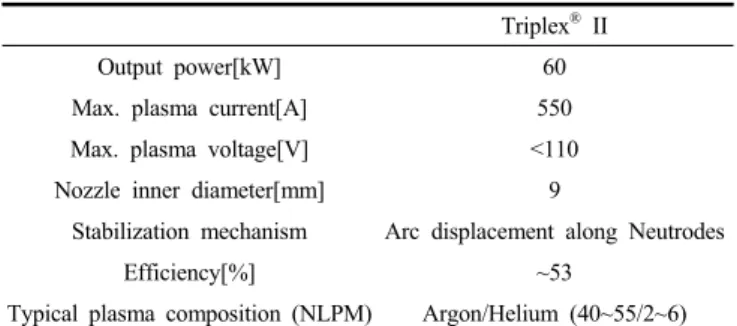
The three-cathode Triplex® II plasma spray gun (Sulzer Metco AG, Wohlen, Switzerland) was used for the liquid feedstock injection apparatus. All these torches are operated under atmospheric conditions.
The torches are operated with Argon as primary gas and secondary gases such as helium were used in order to increase the viscosity. The yttria stabilized zirconia (YSZ) are used as a feedstock since it is the material of choice for electrolyte layers in solid oxide fuel-cell (SOFC) and for the thermal barrier coating (TBC) systems. Tables 1 and 2 show the main torch parameters and detailed spray parameters used in this study. Substrate surface temperatures are monitored by the system 4 M8 pyrometer (Land instruments GmbH, Leverkusen). Figure 2 shows the simple schematic representation of the process. The coating is built up by scanning the plasma torch over the substrate with a me- ander-like movement. During the APS, a pyrometer is used to measure the center of the sample. After the measurement, a graph of the coating temperature evolution is plotted, and then the mean value of each cycle can be obtained.
Triplex® II
Output power[kW] 60
Max. plasma current[A] 550
Max. plasma voltage[V] <110
Nozzle inner diameter[mm] 9
Stabilization mechanism Arc displacement along Neutrodes
Efficiency[%] ~53
Typical plasma composition (NLPM) Argon/Helium (40~55/2~6) Table 1. Basic Plasma Torch Parameters
Sample Front P (bar)
Back P (bar)
Avg. T (℃)
# of Cycle
Ar flow rate (nlpm)
Robot speed (mm/s)
A 0 1 702.5 10 40 250
B 1 0 845.7 10 40 250
C 0 5 613.9 12 50 250
D 0 3 650.4 12 50 250
E 0 3 610.0 15 40 250
F 0 5 557.6 10 40 250
G 0 1 702.5 10 40 250
H 4 0 335.0 18 45 500
I 4 0 325.1 18 55 500
J 4 0 341.0 11 50 500
K 4 0 332.4 12 50 500
L 4 0 293.6 4 50 500
M 6 2 411.2 13 40 400
N 6 2 527.7 22 40 200
O 6 0 658.1 20 40 600
Table 2. Detailed Spray Parameters for Each Samples during APS Coating
Figure 2. Evaluation techniques for the measured curves. (a) Sche- matic representation of the process, (b) graphical representation of the coating temperature evolution with raw data, and (c) mean value of each cycle.
Figure 3. Comparison of the temperature difference between stationary temperatures of the front and back cooling system.
Figure 4 Comparison of the cooling ability between the back cooling system. (a) When the back pressure exceeds 3 bar, the graph is nearly the same as that of the back pressure of 3 bar. (b) Variation of the back cooling pressure with the cooling ability.
3. Results
Thermal barrier coatings (TBC) are sprayed on rectangular-shaped metallic substrates, and the thermal cycling test is performed on a burner-rig operated with a methane flame. During the heat up phase, the burner is aligned with the sample reaching 95% of the maximum temperature within 15 s. After lasting for 5 min, the burner is moved away from the sample. Then, a frontal cooling nozzle is moved for cooling down the front surface of the sample.
3.1. Air-Cooling systems
A cooling system is essential for any coating technology and thus, should be installed either at the front or back of the substrate.
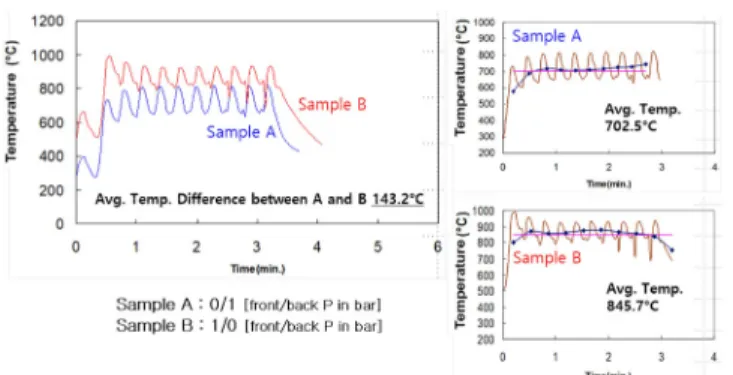
Intuitively, the efficiency of the back air-cooled system is better than that of the front and back air-cooled system as shown in Figure 3. All conditions were the same except for cooling air in pressure. The front/
back pressure of samples A and B are 0/1 and 1/0 bar, respectively.
The temperature difference between stationary temperatures was 143.2
℃. Moreover, when the back cooling pressure exceeds 3 bars, the graph of the coating temperature on the substrate surface is nearly the same as the back cooling pressure of 3 bars, as shown in Figure 4(a).
The front/back pressure of samples C and D are 0/5 and 0/3 bar, respectively. As observed in Figure 3(b), the more the cooling pressure is increased, the less the cooling ability. The front/back pressure of samples E, F, and G are 0/3, 0/5, and 0/1 bar, respectively, while the coating cycles of samples E, F, and G are 15, 10, and 10, respectively.
The stationary temperature displayed in Figure 5 can be probably changed according to the different conditions. However, when the tem-
Figure 5. Comparison of the cooling ability between the back cooling system.
Figure 6. Variation of temperature with time for samples H and I.
perature gap between the samples is near twice the amount, the ten- dency remains the same.
3.2. Plasma-gas flow and powder feed rate
The wave of the amplitude is changeable and depends on the plas- ma-argon flow. The only differences in Figure 6 are the plasma-argon and -helium flow. When the argon flow rate decreases, the spread length is higher. As shown in Figure 6, when the flow rate of argon is 45 nlpm, the spread length temperature is 57 ℃ and when the flow rate of argon is 55 nlpm, the spread length temperature is 30 ℃.
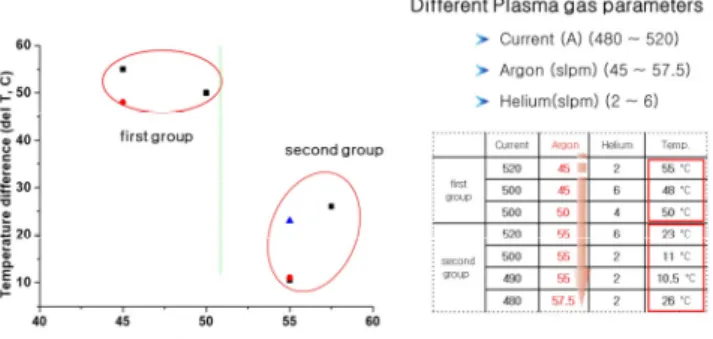
Although there are two different factors (argon and helium), the argon flow rate is only mentioned because of relativity. Other relevant factors exist, such as helium, power, etc. However, argon is the most relevant factor among the plasma-gas flow affecting the uniformity of surface temperature, which could be well explained by Figure 7. The table in Figure 7 shows different samples with various conditions. The temper- ature in the table represents the average temperature of the spread length of the last 5 cycles. Although each sample has various gas and power conditions, the temperature of the spread length tends to de- crease with increasing argon flow rate. Also, based on the argon flow rate, the temperature can be divided into two groups. The criterion adopted was the argon flow rate of 50 nlpm. This implies that the ar- gon flow rate of less than 50 nlpm has a higher spread length than that greater than 50 nlpm.
With this phenomenon, the lower the dose disk number (feedstock feeding-rate into the plasma-gas, 0.5 ml/s per 1 dose disk), the more the uniformity of the surface temperature. Figure 8 is the average
Figure 7. Different factors of the plasma affecting the uniformity of the surface temperature.
Figure 8. Comparison of the surface temperature uniformity between Dose disk numbers.
temperature of the spread length of the cycle. When the dose disk number is changed from 5 to 10 or 10 to 15, the temperature between them is 1.5 times higher or twice higher. This can be explained by the fact that the more the powder per spray cycle, the thicker the deposited layer per cycle and thus better isolation from the back cooling.
3.3. Robot velocity
The temperature decreases with the increasing robot speed of the Triplex® II plasma spray gun machine. When the robot velocity is high, the spray duration of the gun also reduces. Three different sam- ples with various robot speed and coating cycle were investigated as shown in Figure 9 (sample M: robot speed and the number of coating cycles of 400 mm/s and 13, respectively; sample N: robot speed, the number of coating cycles and a back cooling pressure of 200 mm/s, 22, and 2 bar, respectively; sample O: robot speed, the number of coat- ing cycles and a back cooling pressure of 600 mm/s, 40, and 0 bar).
Note that samples N and O have almost identical measurement time but the number of the measurement cycle is twice. Indeed, the temper- ature decreases with increasing robot speed. However, when the back cooling pressure is high, the temperature also decreases even with a low robot speed [Figure 9(b)]. This is an indication that the back cool- ing is more influenced than the robot velocity.
Controlling how fast or slow the goal surface temperature is reached can be defined by the following equation (1).
Y = P1 + P2 [1 - exp^(-t/P3)], (1)
Figure 9. (a) Variation of temperature with time for the sample. The temperature decreases with increasing robot speed. (b) Comparison of the variation of temperature with time for samples O and N. The effect is that cooling pressure > robot velocity (Sample M: robot speed 400 cycle/min, coating cycles 13; sample N: robot speed 200 cycle/min, coating cycles 22, 6~2 bar; and sample O: robot speed 600 cycle/min, coating cycles 40, 6~0 bar).
Figure 10. The process of the fitting method.
Figure 11. The relativity between P3 and the robot speed.
where P1 is the initial temperature (T), P2 is the temperature difference between the initial and saturation temperatures, and P3 is a time scale for reaching the final saturation temperature.
At first, the mean value of each cycle was obtained from the raw data and then fitted using the above equation. P3 is a factor that is used to observe how fast the temperature grows (Figure 10).
After obtaining the P3 values from random experiments, a tendency can be observed in Figure 11. Even though the samples did not experi- ence the same conditions (which results in low speed), the radial tem- perature gradient (P3) increased with increasing robot velocity. This is an indication that the saturated temperature is attained at high speed.
An operator can be used to control how fast or slow the goal surface temperature is attained by the robot velocity.
Figure 12. Comparison of the surface temperature for different sub- strates.
Figure 13. Comparison of the surface cooling temperature for different substrates.
3.4. Substrate material
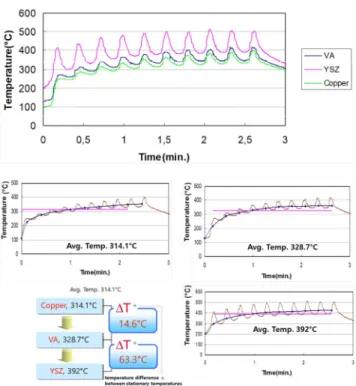
The surface temperature of the substrate differs and is a function of the substrate material. All conditions were fixed except the substrate material, of which YSZ, VA (chromium-nickel) stainless steel, and copper were used. The thermal conductivities of YSZ, VA, and copper are about 2, 20, and 400 W/Km, respectively, at room temperature and could be less due to the porosity produced during spraying. Figure 12 shows that YSZ has the highest surface temperature followed by VA and copper. The interesting thing is that the difference between the sur- face temperature of VA and copper substrates is not much even though the thermal conductivities are different.
The cooling duration after the coating process differs for the differ- ent substrate materials. Figure 13 shows that YSZ has the fastest cool- ing speed, followed by VA and copper, which can be explained by the
YSZ Copper Stainless steel Density 6.5 g/cm3 8.94 g/cm3 7.9 g/cm3 Volume 11.25 cm3 9.375 cm3 8.5 cm3 Specific heat capacity 0.278 J/gㆍK 0.385 J/gㆍK 0.46 J/gㆍK
Tf - Ts 565 K 505 K 527 K
Table 3. Parameters of the Substrate Materials
following equations (2):
E = m⋅Cp (Tf - Ts)
= δ⋅v⋅Cp (Tf - Ts) (2)
where E: Energy inside of the substrate m: Mass
Cp: Specific heat capacity Tf: Finishing temperature Ts: Starting temperature δ: Density
V: Volume
The energy of YSZ, VA, and Cu substrates are 11.5, 16.2, and 16.3 KJ, respectively, and are shown in Table 3. YSZ could possess a smaller amount of internal energy compared to the other materials. Thus, it should need less time to emit such energy.
A series of experiments, mostly based on the characterization of the sprayed feedstock, air cooling, robot speed and resulting coatings, were analyzed. These results were to establish the correlations between sub- strate temperature and feedstock properties, which were positively cor- related to spray and process efficiencies. Based on these optimization of operating parameter, APS coating can be used in the application of TBC in aeroengines and power generation land based turbines that is increasing in demand. In particular, enhanced turbine cooling by TBC will increase the compressor efficiency. Likewise, in solid oxide fuel cells (SOFC), YSZ coating were also used for electrolyte layer of pla- nar SOFC systems. By optimizing injection parameter, denser YSZ coating layer can be achieved, resulting in the higher efficiency.
Hence, the coating temperature variation on the plasma sprayed YSZ substrates seeking for the optimization of the TBC coating or APS sprayed electrolyte layer of planar SOFC systems, will be dataset of paramount importance in both cases.
4. Conclusion
The following conclusions were obtained from this investigation:
For air-cooled systems, the back air-cooled system was more effi- cient than the front air-cooled system. Increasing the air pressure in the back cooling systems enhanced the cooling ability slightly. For the plasma-gas flow and feedstock feed rate, the uniformity of the sub- strate surface temperature could be optimized by controlling the argon flow rate (criteria of 50 nlpm was adopted) and the feedstock amount.
For the robot velocity, the temperature saturation was quickly reached
by increasing the speed rate, while the surface temperature was lower.
The surface temperature and cooling rate of the three substrates were in the order of YSZ > VA > Copper.
Acknowledgments
This work was supported by the research invigoration program of 2020 Gyeongnam National University of Science and Technology.
References
1. E. Pfender, Thermal plasma technology: Where do we stand and where are we going?, Plasma Chem. Plasma Proc., 19, 1-31 (1999) 2. A. Vardelle, C. Moreau, J. Akedo, H. Ashrafizadeh, C. C. Berndt, J. O. Berghaus, M. Boulos, J. Brogan, A. C. Bourtsalas, A.
Dolatabadi, and M. Dorfman, Thermal spray roadmap, J. Therm.
Spray Technol., 25, 1376-1440 (2016).
3. R. C. Tucker, Thermal Spray Technology, 1st (Ed.), ASM Hand- book, Volume 5A, OH, USA (2013).
4. L. Xie, D. Chen, E. H. Jordan, A. Ozturk, F. Wu, X. Ma, B. M.
Cetegen, and M. Gell, Formation of vertical cracks in solution-pre- cursor plasma-sprayed thermal barrier coatings, Surf. Coat. Technol., 201, 1058-1064 (2006).
5. S. Samukawa, M. Hori, S. Rauf, K. Tachibana, P. Bruggeman, G.
Kroesen, J. C. Whitehead, A. B. Murphy, A. F. Gutsol, S.
Starikovskia, and U. Kortshagen, The 2012 plasma roadmap, J.
Phys. D Appl. Phys., 45, 253001 (2012).
6. P. Fauchais, G. Montavon, M. Vardelle, and J. Cedelle, Develop- ments in direct current plasma spraying, Surf. Coat. Technol., 201, 1908-1921 (2006).
7. Fr.-W. Bach, A. Laarmann, and T. Wenz, Triplex II - Develop- ment of an economical high-performance plasma spray system for highest‐quality demands even under challenging production xondi- tions, In: H. Zimmermann and H.‐M. Höhle (eds.). Modern Surf.
Tech., 159-178 Wiley‐VCH Verlag GmbH & Co. KGaA, Germany (2006).
8. G. Mauer, M. O. Jarligo, D. Marcano, S. Rezanka, D. Zhou, and R. Vaßen, Recent developments in plasma spray processes for ap- plications in energy technology, IOP Conf. Series: Materials Sci.
Eng., 181, 012001 (2017).
9. L. Zhao, K. Seemann, A. Fischer, and E. Lugscheider, Study on atmospheric plasma spraying of Al2O3 using on-line particle mon- itoring, Surf. Coat. Technol., 168, 186-190 (2003).
10. D. Thirumalaikumarasamy, K. Shanmugam, V. Balasubramanian, Influences of atmospheric plasma spraying parameters on the po- rosity level of alumina coating on AZ31B magnesium alloy using response surface methodology, Prog. Natural Sci.: Materials Int., 22, 468-479 (2012).
11. D. Thirumalaikumarasamy, K. Shanmugam, and V. Balasubramanian, Comparison of the corrosion behaviour of AZ31B magnesium al- loy under immersion test and potentiodynamic polarization test in NaCl solution, J. Magnesium Alloys, 2, 140-153 (2014).
12. F. Azarmi, T. W. Coyle, and J. Mostaghimi, Optimization of atmo- spheric plasma spray process parameters using a design of experi- ment for alloy 625 coatings, J. Thermal Spray Technol., 17, 144-155 (2008).
13. M. Bounazef, S. Guessasma, G. Montavon, and C. Coddet, Effect of APS process parameters on wear behaviour of alumina-titania coatings, Mater. Lett., 58, 2451-2455 (2004).
14. R. Soltani, M. Heydarzadeh-Sohi, M. Ansari, F. Afsari, and Z.
Valefi, Effect of APS process parameters on high-temperature wear behavior of nickel-graphite abradable seal coatings, Surf. Coat.
Technol., 321, 403-408 (2017).
15. H. Waki, T. Kitamura, and A. Kobayashi, Effect of thermal treat- ment on high-temperature mechanical properties enhancement in LPPS, HVOF, and APS CoNiCrAlY coatings, J. Therm. Spray Te- chnol., 18, 500 (2009).
16. A. Rico, J. Rodríguez, and E. Otero, High temperature oxidation behaviour of nanostructured alumina-titania APS coatings, Oxid.
Met., 73, 531-550 (2010).
17. E. Lugscheider, C. Barimani, P. Eckert, and U. Eritt, Modeling of the APS plasma spray process, Comput. Mater. Sci., 7, 109-114 (1996).
18. D. Tejero-Martin, M. Rezvani Rad, A. McDonald, and T. Hussain, Beyond traditional coatings: A review on thermal-sprayed func- tional and smart coatings, J. Thermal Spray Technol., 28, 598-644 (2019).
Authors
Kiyoung Lee; Dr.-Ing., Associate Professor, Department of Advanced Science and Technology Convergence, Kyungpook National University, School of Nano & Materials Science and Engineering, Kyungpook National University, Sangju 37224, Republic of Korea;
Hyunchul Oh; Dr.rer.nat., Associate Professor, Department of Energy Engineering, Gyeongnam National University of Science and Technology (GNTECH), Jinju 52725, Republic of Korea; oh@
gntech.ac.kr