39
수입 식육의 안전성 확보를 위한 polychlorinated dibenzo-p-dioxins와 dibenzofurans 분석
김미경*·김동규·김수연·최시원·권진욱·윤선종·송성옥·정갑수 국립수의과학검역원
(게재승인: 2008년 1월 30일)
Analysis of polychlorinated dibenzo-
p-dioxins and dibenzofurans to assure safety of imported meat
MeeKyung Kim*, Dong-Gyu Kim, Sooyeon Kim, Si Weon Choi, Jin-Wook Kwon, Seon Jong Yun, Sung Ok Song, Gab-Soo Chung
National Veterinary Research and Quarantine Service, Anyang 430-824, Korea (Accepted: January 30, 2008)
Abstract :Polychlorinated dibenzo-p-dioxins (PCDDs) and dibenzofurans (PCDFs) are ubiquitous and can contaminate the food chain. A study monitoring PCDD/Fs in imported meat was conducted at the National Veterinary Research and Quarantine Service (NVRQS, Republic of Korea) in order to maintain food safety from the bioaccumulative PCDD/Fs. Seventeen PCDD/Fs with toxic equivalency factors (TEFs) established by World Health Organization (WHO, 1998) were analyzed in imported beef, pork, and chicken by high resolution gas chromatography/mass spectrometry (HR-GC/MS). Results of the monitoring for the last 5 years are presented.
The levels of PCDD/Fs were similar to other studies except two unusually high concentrations in pork and beef. Excessive levels greater than the Korean provisional maximum residue limit of PCDD/Fs were found in a sample of pork imported from Chile and a sample of beef imported from U.S, and those products were rejected and returned. There was no obvious trend or differences with respect to time or origin of meat in this study.
Keywords :beef, chicken, monitoring, PCDDs, PCDFs, pork
서 론
산업의 가속화에따른환경오염이증가하면서 환경 오염물질이인체에 직·간접적으로영향을 미치며특 히식품을통하여인체건강이위협을받게되었다. 국 가간의왕래가활발해지고무역장벽이완화되면서식 품의수·출입도크게증가하고 있으며우리나라도식 품의 수입의존도가 갈수록늘어가고 있는추세이다. 1999년벨기에축산물의다이옥신오염사고는당시돼
지고기를수입한우리나라에도큰파장을불러일으켰 다. 동사건은 그동안미생물에의한식품사고에집중 되었던연구와관심을체내축적성이있는환경유래유
해물질이식품에잔류할수있음을상기시키는계기 가되었다.
다이옥신은 polychlorinated dibenzo-p-dioxin(PCDDs)
이성질체 75종과 polychlorinated dibenzofuran(PCDFs) 이
성질체 135종을합하여일컫는용어이며독성이알려진
7종 PCDDs와 10종 PCDFs를각매체에서분석하여다
이옥신함량으로표시한다. 다이옥신등의유해물질은
다양한화학제품의생산및폐기과정에서환경으로배 출되어곡류나물, 토양등을오염시킨다. 오염된동물
또는식물이먹이사슬을통하여동물과사람의체내로 유입되며유해물질의이행이계속적으로일어나게된다
[13, 16]. 체내에서의다이옥신반감기를길게는 8년까지
*Corresponding author: MeeKyung Kim
National Veterinary Research and Quarantine Service, Anyang 430-824, Korea [Tel: +82-31-467-1982, Fax: +82-31-467-1872, E-mail: [email protected]]
로추정하며환경에서자연현상이나화학작용에의해 다이옥신의양이감소하거나독성이변화되기는하나 일단환경으로배출된다이옥신은오랜기간동안순환
하게된다 [14]. 또한다이옥신은지방친화적인화학적
성질로인하여지방이많은동물성식품및어류에많 이축적된다.
1999년벨기에에서발생한축산물의 다이옥신오염
사건은 사료용유지에 polychlorinated biphenyls(PCBs)
가혼입되었고, PCBs에포함되어있던다이옥신의인체 독성으로인하여문제가되었던사건이다. 따라서동사
건에관련된시료에서일차적으로 PCBs를분석하고일
정량이상의 PCBs가검출된경우다이옥신분석을실
시하였다. 다이옥신분석은시간이오래걸리고분석비
용이비싸므로문제의유지로부터검출된 PCBs와다이 옥신의농도비율을조사하여설정한방법이었다. 당시 우리나라는벨기에로부터수입된돼지고기에대하여같 은방법으로검사를실시하여축산물의안전성을검증 하였다.
이후국립수의과학검역원에서는 2000년 9월 1일부터
수입축산물에대한다이옥신검사를실시하여안전한 축산물의국내유통을확보하고자하였다. 이에본글에 서는다이옥신분석방법과최근 5년간수행한수입축산
물의다이옥신분석결과에대한고찰을통하여축산물 안전성확보의결실을소개하고자하였다.
재료 및 방법
국립수의과학검역원의 “축산물중유해물질분석법
편람”에수록된축산물중다이옥신 분석법과미국환
경보호청(US EPA)의다이옥신분석법 “Method 1613”
에따라동위원소희석법으로시료전처리및기기분석을 실시하였다 [1, 7].
표준물질 및 시약
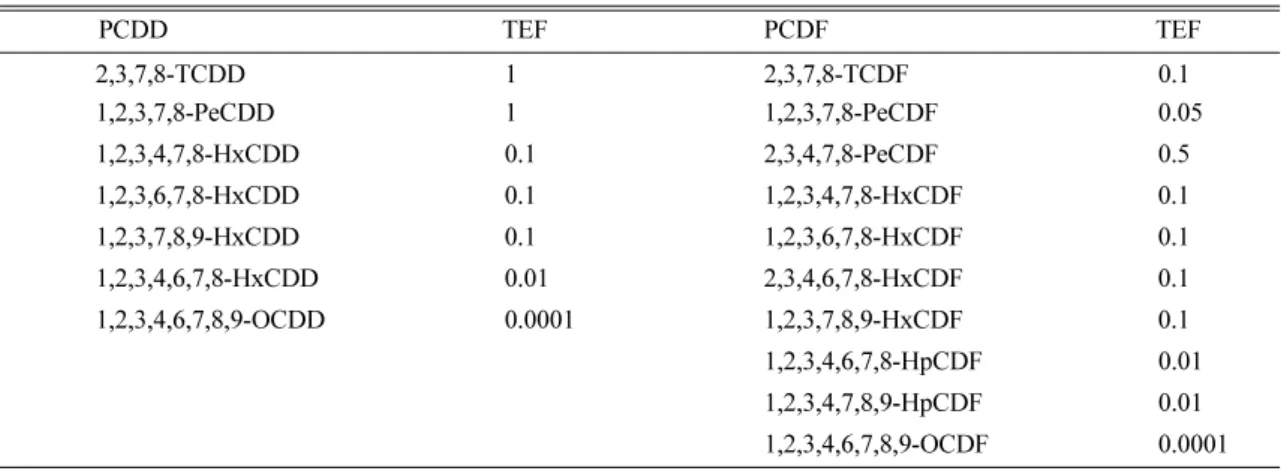
세계보건기구(WHO, 1998)에서설정한독성등가계수 (toxic equivalency factor, TEF)를 지닌 2,3,7,8-tetrachlo- rodibenzo-p-dioxin 등 17종 PCDD/Fs 을분석대상물질로
선정하였다(Table 1). 동위원소표지된표준물질(labeled compound spiking solution, LCS), 정제용표준물질(cleanup standard solution, CSS), 기기보정용 표준물질(internal standard solution, ISS)로 사용된 PCDD/Fs는 Wellington
Laboratories(Canada) 제품을사용하였고검량선작성용표
준물질(calibration standard solution, CS3, CS4, CS5)은 Cambridge Isotope Labolatories(USA) 제품을사용하였다.
헥산, 노난, 메틸렌클로라이드, 에틸아세테이트, 벤젠, 톨 루엔등은모두분석시약급(HPLC grade) 이상을사용하
였으며실리카겔은 Merck(Germany) 제품으로입자크기
0.063~0.2mm의칼럼크로마토그래피용을사용하였다.
분석대상시료
국립수의과학검역원에수입신고되어진제품중수 입자동화 정보시스템(Automatic Import Information
System, AIIS)에의해무작위로선정되는쇠고기, 돼지
고기, 닭고기를시료로사용하였다.
분석기기
고분해능 질량분석기(High Resolution Mass Spectro- meter; Micromass, UK) AutoSpec-Ultima NT, 기체크로
마토그래프(Gas Chromatograph, GC; Hewlett Packard,
USA) HP6890, 자동시료주입장치(Autosampler; CTC,
Swiss) A200SE를 사용하였고 GC 칼럼은 DB-5MS
capillary column(60 m×0.25 mm i.d., 0.25 µm film thickness; J & W, USA)을사용하였다. 다이옥신정제장
치는 Power-Prep(Fluid Management System, USA)을이 용하였다.
Table 1. Toxic equivalency factor (TEF) for PCDD/Fs (WHO, 1998)
PCDD TEF PCDF TEF
2,3,7,8-TCDD 1 2,3,7,8-TCDF 0.1
1,2,3,7,8-PeCDD 1 1,2,3,7,8-PeCDF 0.05
1,2,3,4,7,8-HxCDD 0.1 2,3,4,7,8-PeCDF 0.5
1,2,3,6,7,8-HxCDD 0.1 1,2,3,4,7,8-HxCDF 0.1
1,2,3,7,8,9-HxCDD 0.1 1,2,3,6,7,8-HxCDF 0.1
1,2,3,4,6,7,8-HxCDD 0.01 2,3,4,6,7,8-HxCDF 0.1
1,2,3,4,6,7,8,9-OCDD 0.0001 1,2,3,7,8,9-HxCDF 0.1
1,2,3,4,6,7,8-HpCDF 0.01 1,2,3,4,7,8,9-HpCDF 0.01 1,2,3,4,6,7,8,9-OCDF 0.0001
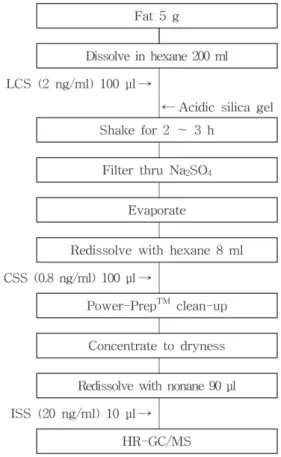
시료 전처리
식육의 지방부분을세절하여쇠고기와돼지고기는
80oC 이하, 닭고기는 50oC 이하의오븐에서지방을액 화하였다 [3, 6]. 액화한지방 5 g을 500 ml 병에취한후
헥산 200 ml를넣어혼합한후 LCS 100 µl를첨가하였
다. 30% 산성실리카겔 30~100 g을넣고 2 h 동안흔들 어지방을제거한후추출액을무수황산나트륨에통과
시켜 잔존하는 수분을 제거하고 SpeedVac System
(AES2010; Savant Instrument, USA)을이용하여 1~2 ml
로농축하였다. 농축액을다시헥산으로용해시키고 CSS
100 µl를첨가한후실리카, 알루미나, 활성탄칼럼이장
착된정제장치 Power-Prep을이용하여다이옥신이외의
불순물을제거하였다. 이때칼럼을통과시켜주는 용매
는헥산 90 ml와 2% 메틸렌클로라이드/헥산 60 ml로실 리카칼럼과알루미나칼럼을차례로통과시켜주었고,
이어서 50% 메틸렌클로라이드/헥산 120 ml로실리카, 알 루미나, 활성탄칼럼을통과시켰다. 활성탄에흡착된다 이옥신을 1차로에틸아세테이트/벤젠(1 : 1, v/v) 4 ml로
용출하고이어서헥산 10 ml 및톨루엔 80 ml로용출하
였다. 이용출액을회전식증발농축기를이용하여건조 시킨후다시소량의헥산으로충분히녹여 GC 바이알
에옮기고질소농축기를이용하여헥산을완전히날려
보낸후다시노난 90 µl로용해시켰다. 이노난용액에
ISS 10 µl를첨가하여 HR-GC/MS 분석용검액으로사용
하였다. Fig. 1에시료전처리과정을도식으로나타내었다.
기기 분석
물질의분리및확인을위한 GC 조건은 Table 2와같
다. 질량분석기의조건은 Table 3에이온화원(EI+)을포
함한조건을, Table 4에정성분석을위한이온질량을
다이옥신에치환된염소수에따라 5 그룹으로나누어 나타내었다. 최종검액 1~2 µl를기기에주입하여분석 하였다.
Fig. 1. Flow chart for analysis of fatty samples.
Table 2. GC conditions for the PCDD/Fs
Descriptor Condition
Instrument HP 6890
Column DB-5MS (60 m×0.25 mm i.d., 0.25µm film thickness)
Carrier gas Helium (1.0 ml/min)
Injection port temperature 260oC
Oven temperature program Initial temperature: 180oC
Time (min) Rate (oC/min) Temp. (oC)
10 15 240
10 10 260
12 5 290
Table 3. HR-MS conditions for the PCDD/Fs
Descriptor Condition
Source temperature 260oC
Electron energy 35 eV
Trap 500µA
Interface temperature
Capillary line 1 and 2 260oC
Re-entrant 260oC
PFK septum 160oC
다이옥신 농도 계산
지방이많은시료의경우, 다이옥신농도는 HR-GC/
MS에서분석하여계산된농도를분석시료의지방무게 로나누어준후독성등가계수를곱하여 g 지방당다이
옥신농도로표기하였다. 독성등가계수를곱하여계산
된농도를독성등가값에해당하는 TEQ(Toxic equivalent)
농도라한다.
결과 및 고찰
호주 등 5개국가에서 수입된쇠고기에 대한 국가 별, 연도별다이옥신 분석결과를 Table 5에나타내었
다. 시료의무작위추출비율은수입물량에비례하게
되므로 호주에서쇠고기 수입이많았음에따라 분석 시료수도가장많았다. 5년간분석한총시료수는 340 Table 4. Group of m/z for PCDD/Fs
Channel Group 1 Group 2 Group 3 Group 4 Group 5
1 303.9016
(TCDF) 335.8597
(PeCDF) 373.8207
(HxCDF) 407.7818
(HpCDF) 441.7428
(OCDF)
2 305.8987 341.8568 375.8178 409.7788 443.7398
3 315.9419
(13C-TCDF) 351.9000
(13C-PeCDF) 385.8610
(13C-HxCDF) 419.8220
(13C-HpCDF) 457.7377 (OCDD)
4 317.9389 353.8970 387.8580 421.8191 459.7348
5 319.8965
(TCDD) 355.8546
(PeCDD) 389.8156
(HxCDD) 423.7767
(HpCDD) 469.7780
(13C-OCDD)
6 321.8936 357.8517 391.8127 425.7737 471.7750
7 331.9368
(13C-TCDD) 367.8949
(13C-PeCDD) 401.8559
(13C-HxCDD) 435.8169 (13C-HpCDD)
8 333.9338 369.8919 403.8530 437.8140
Table 5. Levels of PCDD/Fs in beef imported from five countries for year 2002-2006 (pg WHO-TEQ/g fat)
Country 2002 2003 2004 2005 2006
N Mean
(min.~max.) N Mean
(min.~max.) N Mean
(min.~max.) N Mean
(min.~max.) N Mean (min.~max.) Australia 39 0.02
(nd~0.34) 18 80.002
(nd~0.02) 62 0.18
(nd~2.79) 40 0.10
(nd~0.95) 25 0.02 (nd~0.40)
Canada 86 0.19
(0.04~0.44) 81 0.01
Mexico 82 0.74
(nd~1.47) 81 0.38 New Zealand 26 0.06
(nd~0.61) 85 nd 25 0.20
(nd~0.88) 18 0.11
(nd~0.41) 11 0.03 (nd~0.19)
USA 36 0.13
(nd~1.42) 22 0.22
(nd~1.15) 82 0.07
(nd~1.67) N: Number of samples. nd: not detected.
시료이었으며 이중 2006년 12월미국산수입 쇠고기
1개시료(Table 5에서제외하였음)에서우리나라잠정
잔류허용기준(5 pg/g fat)을초과한 6.26 pg/g fat의다 이옥신이검출되어해당제품이반송되었다. 국가별, 연
Table 6. Levels of PCDD/Fs in pork imported from fifteen countries for year 2002-2006 (pg WHO-TEQ/g fat)
Country 2002 2003 2004 2005 2006
N Mean
(min.~max.) N Mean
(min.~max.) N Mean
(min.~max.) N Mean
(min.~max.) N Mean (min.~max.)
Australia 1 0.03 1 nd 6 0.14
(nd~0.85) 1 0.85
Austria 4 0.01
(nd~0.03) 1 nd 3 0.12
(nd~0.36) 4 0.11
(nd~0.02) 2 0.002 (nd~0.003)
Belgium 12 0.01
(nd~0.09) 5 0.003
(nd~0.01) 17 0.10
(nd~0.93) 3 0.01
(nd~0.04) 4 0.001 (nd~0.004)
Canada 2 0.001
(nd~0.001) 3 0.14
(nd~0.43) 6 0.03
(nd~0.16) 2 nd 6 nd
Chile 89 0.06
(nd~3.32) 17 0.06
(nd~0.38) 6 0.03
(nd~0.15) 7 nd
Denmark 7 0.002
(nd~0.01) 3 0.002
(nd~0.01) 7 0.01
(nd~0.08) 2 0.01
(nd~0.02) 3 nd
Finland 1 nd 1 nd
France 2 nd 12 0.003
(nd~0.02) 4 0.05
(nd~0.18) 1 nd
Hungary 6 0.05
(nd~0.20) 4 nd 5 0.03
(nd~0.11) 2 nd 4 nd
Mexico 1 0.01
The Netherlands 1 0.004 1 nd 8 0.01
(nd~0.05) 2 0.11
(nd~0.21)
Poland 3 nd 2 nd 1 0.83 5 0.16
(nd~0.81)
Spain 3 0.001
(nd~0.002) 2 0.005
(nd~0.01)
Sweden 1 nd 1 nd
USA 3 0.37
(0.001~1.11) 4 0.11
(nd~0.44) 13 0.08
(nd~0.64) 6 0.06
(nd~0.18) 16 0.03 (nd~0.23) N: Number of samples. nd: not detected.
도별검출농도에서큰차이는없었으며, 다이옥신이환 경에널리 산재되어있으므로소의성장과정중환경 을통한직접노출또는오염된 사료를 통한간접노 출이식육의 다이옥신잔류농도에변화를 줄수있었 을것이다.
Table 6에돼지고기에서다이옥신을분석한결과를국
가별, 연도별로분류하여놓았으며, 2002년부터 2006년
까지총 15개국가에서수입된돼지고기중 338 시료를
분석하였다. 주로유럽국가로부터돼지고기수입이많
았으며, 2003년에는칠레에서돼지고기수입이많았는
데 90 시료분석중 1개시료(Table 6에서제외하였음)
에서 7.5 pg/g fat의다이옥신이검출되어해당제품이반
송되었다. 일반적으로돼지고기의다이옥신농도는쇠 고기에비하여 낮았으며쇠고기와마찬가지로국가별,
연도별검출농도에서큰차이는보이지않았다.
브라질등 8개국가에서수입된닭고기 139개시료에
서 분석한 다이옥신 농도를 Table 7에 나타내었다.
2002~2003년도에는태국과 미국으로부터닭고기 수입
이많았으나최근에는브라질과덴마크로부터의수입이 증가되고있다. 분석대상시료수는연도별로수입신고
되어진물량에따라비례적으로선정되었다.
종합적으로, 여러국가에서수입되어진쇠고기, 돼지 고기및닭고기에서분석된다이옥신농도를연도별로 평균및검출범위를계산하여 Table 8에나타내었다.
2002년부터 2006년까지분석된시료의검출범위는, 쇠
고기는불검출에서최대 2.79 pg/g fat, 돼지고기는불검
출에서 최대 3.32 pg/g fat, 닭고기는 불검출에서최대
3.44 pg/g fat이었다. 쇠고기, 돼지고기, 닭고기에서각각 의최대검출치 1건을제외하고는대부분의시료에서검
출된다이옥신농도는불검출~1.5 pg/g fat 수준이었다.
기준초과다이옥신이검출된 2003년돼지고기 1개시
료와 2006년쇠고기 1개시료는관련된해당제품이반
송되었으므로 Table 5, 6, 7 및 8의시료수와검출농도 계산에서제외하였다.
각국가의환경및급여하는동물용사료가다르고,
한국가라할지라도지역과연도에따라변화가있을수
Table 7. Levels of PCDD/Fs in chicken imported from eight countries for year 2002-2006 (pg WHO-TEQ/g fat) Country
2002 2003 2004 2005 2006
N Mean
(min.~max.) N Mean
(min.~max.) N Mean
(min.~max.) N Mean
(min.~max.) N Mean
(min.~max.)
Brazil 1 0.63 9 1.17
(0.27~3.44)
Canada 2 0.96
(nd~1.92)
China 1 1.26
Denmark 6 0.03
(nd~0.05) 5 0.18
(nd~0.41)
England 1 0.01
France 5 0.05
(nd~0.16)
Thailand 23 0.21
(nd~1.45) 15 0.27
(nd~1.67) 1 nd
USA 30 0.18
(nd~1.30) 28 0.08
(nd~1.09) 2 nd 4 0.12
(nd~0.17) 6 80.004 (nd~0.02) N: Number of samples. nd: not detected.
Table 8. Levels of PCDD/Fs in imported beef, pork, and chicken in each year (pg WHO-TEQ/g fat)
Year Beef Pork Chicken
N Mean
(min.~max.) N Mean
(min.~max.) N Mean
(min.~max.)
2002 107 0.08
(nd~1.42) 41 0.04
(nd~1.11) 56 0.24
(nd~1.92)
2003 46 0.10
(nd~1.15) 113 0.06
(nd~3.32) 43 0.15
(nd~1.67)
2004 89 0.20
(nd~2.79) 101 0.06
(nd~0.93) 14 0.03
(nd~0.16)
2005 59 0.11
(nd~0.95) 31 0.09
(nd~0.85) 11 0.18
(nd~0.63)
2006 38 0.07
(nd~1.67) 51 0.03
(nd~0.81) 15 0.73
(nd~3.44) N: Number of samples. nd: not detected.
Table 9. Levels of PCDD/Fs in meat from various studies
Country Food Concentration (pg WHO-TEQ/g fat) Reference
Belgium beef 1.56 88
pork 0.17
chicken 0.35
Egypt beef 2.88 ~ 2.95 89
chicken 1.35 ~ 1.37
Italy beef 0.160 10
pork 0.109
poultry 0.126
Japan pig fat 0.63 11
chicken fat 1.71
The Netherlands beef 2.05 12
pig 0.47
poultry 2.78
Slovak Republic beef 1.15 13
pork 0.30
chicken 0.51
Spain beef 0.7 14
pork 0.3
chicken 0.8
USA beef 0.75 15
hogs 0.16
young chicken 0.18
있으므로, 다이옥신분석결과에서특정한농도변화가
관찰되지는않았다. 소에비하여생장기간이짧은돼지
와닭에서도다이옥신농도는유사하였으며특히닭에 서는다소높은경향을나타내기도하였다. 이는가축
사료와사육환경이다이옥신의가축체내축적에영향 을미칠수있음에도불구하고다양한국가의여러지 역에서생산된제품의평균농도와검출범위로표현되 었기때문일것이다. 각국가또는지역의사육환경과 급여사료의종류를파악할수는없으므로잔류다이 옥신의오염원은알수가없었고, 다이옥신발생원을줄
이는근본적인대책이각국가마다수행되어야식품의
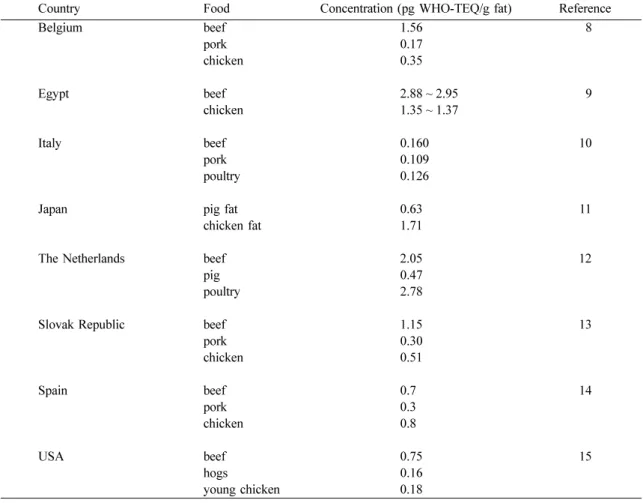
다이옥신오염을감소시킬수있을것이다. Table 9에
각국가별로조사된식육의다이옥신농도를정리하였 다. 벨기에에서돼지고기, 네덜란드에서닭고기, 미국에 서쇠고기, 돼지고기및닭고기가수입되었으며, 본연 구에서분석한평균농도는외국의검출사례에비하여 유사하거나다소낮은농도를보였다 [2, 4, 5, 8-10, 12,
15]. 이는분석결과계산에서불검출을처리하는방법에
따라달라질수있는농도의차이와불검출시료수에따 라낮아질수있는평균값에기인한것으로추정된다.
본연구에서는불검출(not detected, nd)을 “0”으로계산
하였고연구자에따라 nd = LOD 또는 nd = LOD로계
산하기도한다. 불검출 처리를 nd = LOD 또는 nd =
LOD로처리함은다이옥신이이미자연에널리존재하 므로많은식품에서다이옥신이검출될수있음을전제
로바탕농도(background level)를부여하는계산법이다
[11, 17].
다이옥신분석은고도로숙련된전문인력과고가의 분석장비및비용이필요하며오랜분석시간이소요 되는관계로어려움이있으나식육의안전성확보를위 하여수행되어지고있다.
결 론
수입식육의안전성확보를위하여쇠고기, 돼지고기 및닭고기에서 PCDD/Fs 17종을분석하였다. 분석방법
은미국환경보호청(US EPA)의 Method 1613B를근간 으로하였고, 지방이많은시료의전처리방법중일부
를개선하여 HR-GC/MS에의해정성및정량분석을
실시하였다. 외국의다이옥신잔류조사자료에비하여 많은시료가분석되었고 다이옥신이검출되지않은시 료가많았으며전체적으로안전한수준이었다. 가축의
사육환경과급여하는사료에따라가축체내로유입되 는다이옥신농도에차이가있을수있으나, 본연구결 과에서는연도별, 국가별, 품목별다이옥신농도에서큰
차이는발견할수없었다.
참고문헌
1. 국립수의과학검역원.축산물중유해물질분석법편
람: 환경유래유해물질편. pp. 3-34, 국립수의과학검 역원, 안양, 2002.
2. Baars AJ, Bakker MI, Baumann RA, Boon PE, Freijer JI, Hoogenboom LAP, Hoogerbrugge R, van Klaveren JD, Liem AKD, Traag WA, de Vries J.
Dioxins, dioxin-like PCBs and non-dioxin-like PCBs in foodstuffs: Occurrence and dietary intake in The Netherlands. Toxicol Lett 2004, 151, 51-61.
3. Bester K, De Vos P, Le Guern L, Harbeck S, Hendrickx F, Kramer GN, Linsinger T, Mertens I, Schimmel H, Sejerøe-Olsen B, Pauwels J, De Poorter G, Rimkus GG, Schlabach M. Preparation and certification of a reference material on PCBs in pig fat and its application in quality control in monitoring laboratories during the Belgian “PCB-crisis”.
Chemosphere 2001, 44, 529-537.
4. Bocio A, Domingo JL. Daily intake of polychlorinated dibenzo-p-dioxins/polychlorinated dibenzofurans (PCDD/
PCDFs) in foodstuffs consumed in Tarragona, Spain:
A review of recent studies (2001-2003) on human PCDD/PCDF exposure through the diet. Environ Res 2005, 97, 1-9.
5. Chovancová J, Ko an A, Jursa S. PCDDs, PCDFs and dioxin-like PCBs in food of animal origin (Slovakia). Chemosphere 2005, 61, 1305-1311.
6. Covaci A, Ryan JJ, Schepens P. Patterns of PCBs and PCDD/PCDFs in chicken and pork fat following a Belgian food contamination incident. Chemosphere 2002, 47, 207-217.
7. EPA. Method 1613: Tetra-through octa-chlorinated dioxins and furans by isotope dilution HRGC/HRMS (Revision B). US EPA, Washington DC, 1994.
8. Focant JF, Eppe G, Pirard C, Massart AC, André JE, De Pauw E. Levels and congener distributions of PCDDs, PCDFs and non-ortho PCBs in Belgian foodstuffs: Assessment of dietary intake. Chemosphere 2002, 48, 167-179.
9. Guruge KS, Seike N, Yamanaka N, Miyazaki S.
Polychlorinated dibenzo-p-dioxins, -dibenzofurans, and biphenyls in domestic animal food stuff and their fat.
Chemosphere 2005, 58, 883-889.
10. Huwe J, Hoffman MK, Deyrup C, Hulebak K, Larsen G, Zaylskie R, Lorentzsen M, Clinch N. A Survey of PCDD/Fs and co-planar PCBs in the US meat and poultry supply in 2002-2003. Organohalogen
12---
12---
cê
Compd 2004, 66, 1942-1946.
11. Huwe JK, Smith DJ. Laboratory and on-farm studies on the bioaccumulation and elimination of dioxins from a contaminated mineral supplement fed to dairy cows.
J Agric Food Chem 2005, 53, 2362-2370.
12. Loutfy N, Fuerhacker M, Tundo P, Raccanelli S, Ahmed MT. Monitoring of polychlorinated dibenzo-p- dioxins and dibenzofurans, dioxin-like PCBs and polycyclic aromatic hydrocarbons in food and feed samples from Ismailia city, Egypt. Chemosphere 2007, 66, 1962-1970.
13. McLachlan M. A simple model to predict accumulation of PCDD/Fs in an agricultural food chain.
Chemosphere 1997, 34, 1263-1276.
14. Sinkkonen S, Paasivirta J. Degradation half-life times of PCDDs, PCDFs and PCBs for environmental fate
modeling. Chemosphere 2000, 40, 943-949.
15. Taioli E, Marabelli R, Scortichini G, Migliorati G, Pedotti P, Cigliano A, Caporale V. Human exposure to dioxins through diet in Italy. Chemosphere 2005, 61, 1672-1676.
16. Wagrowski DM, Hites RA, Partitioning of polychlorinated dibenzo-p-dioxins and dibenzofurans between the atmosphere and corn. Environ Sci Technol 1998, 32, 2389-2393.
17. Winters D, Cleverly D, Meier K, Dupuy A, Byrne C, Deyrup C, Ellis R, Ferrario J, Harless R, Leese W, Lorber M, McDaniel D, Schaum J, Walcott J.
A statistical survey of dioxin-like compounds in United States beef: A Progress Report. Chemosphere 1996, 32, 469-478.