요약문 본 연구에서는 Landsat-8과 Sentinel-2 위성영상을 활용하여 2019년과 2020년의 위성영상 산출물 각 17종을 구축하였다. 결론적으로 총 68종의 위성영상 분석자료를 제작했다. 구축 범위는 남한 전체이며 해상도는 30m이며 좌표계는 UTM-K 좌표이다. 구축된 자료는 남한 통판 자료와 권역 자료로 각각 제공된다. 또한 자료의 접근성을 확대하기 위하여 ASCII, ArcGIS Grid, GeoTIFF의 3가지 자료 형태로 변환하여 제공한다. 이러한 모든 위성영상 분석 데이터는 환경 비즈니스 빅데이터 플랫폼인 환경빅데이터 홈페이지(www.bigdata-environment.kr)에서 무료로 다운로드 가능하다.
주요어: Landsat-8, Sentinel-2, 정규화지수, 환경 비즈니스 빅데이터 플랫폼
Abstract In this study, 17 types of satellite analysis maps were generated using Landsat-8 and Sentinel-2 satellite images acquired at 2019 and 2020. Totally, 68 of satellite analysis data were produced. The scope of deployment is South Korea as a whole, with a resolution of 30 meters, and the coordinate system is UTM-K coordinates. The established data will be provided in both South Korean and regional data respectively. In addition, it is provided by three data format:
ASCII, ArcGIS Grid, and GeoTIFF for enhancing accessibility of the data. All these satellite analysis data can be downloaded free of charge from the Environmental Big Data website (www.bigdata-environment.kr), an environmental business big data platform.
keywords: Landsat-8, Sentinel-2, Normalized index, Environmental business big data platform
[Geology] A R T IC LE
위성영상 분석 데이터 구축 및 서비스
백원경1·박숭환2·유진우1·윤영웅1·정형섭1*
1서울시립대학교 공간정보공학과, 서울 02504, 대한민국
2한국해양과학기술원 해양재난재해연구센터, 부산 49111, 대한민국
Construction of Analyzed Satellite Image and Service
Won-Kyung Baek1·Sung-Hwan Park2·Jin-Woo Yu1·Young-Woong Yoon1·Hyung-Sup Jung1*
1Department of Geoinformatics, University of Seoul, Seoul 02504, Republic of Korea
2Marine disaster research center, Korea institute of ocean science & technology (KIOST), Busan 49111, Republic of Korea
Received: 25 November 2020, Revised: 07 December 2020, Accepted: 15 December 2020
*Corresponding author: hsjung@uos.ac.kr
1. 서론
위성영상은 넓은 지역에 대한 동시적인 분석을 가능하게 한다. 따라서 전 국토에 대한 모니터링을 수행하는 데에 효과적이 다. 하지만 위성은 촬영일자와 조건에 따라 분광특성이 크게 달라지므로 영상 낱장의 분석을 통하여 전체 국토를 동일한 기 준으로 분석하는 것이 불가능하다. 이에 따라 본 연구에서는 남한 전체를 아우르는 총 68종의 위성영상 산출물을 제공한다.
이를 위하여 미국 항공우주국과 지질조사국의 Landsat-8과 유럽항공우주국의 Sentinel-2에서 제공하는 위성 자료를 수집하였 으며, 전처리 및 가공을 통하여 대기저항식생지수를 포함한 각 15종의 위성 환경 데이터와 RGB 및 CIR 자료를 산출했다.
또한, 추후 시계열적 양상에 대한 분석을 위하여 2019년과 2020년에 취득된 자료를 각각 제작하였다.
2. 연구 자료
위성영상 인덱스를 제작하기 위한 기초자료는 전술한 Earth Explorer와 Copernicus Open Access hub를 활용하여 수집했 다. 2019년과 2020년의 봄 (3월) 부터 여름 (7월) 사이에 촬영된 영상을 검색했으며, 그중 운량이 가능한 적으면서 비슷한 시기에 촬영된 영상들을 선택하였다. 또한, 기상 조건에 의해 해당 시기에 적절한 영상을 찾을 수 없는 경우에 한하여 1월에 촬영한 영상을 활용하였다.
Landsat-8 위성은 미항공우주국과 미지질조사국이 1972년부터 진행해온 공동 주관 프로젝트에서 가장 최근 발사되어 운용 중인 위성이다. Landsat-8 데이터는 Earth Explorer(https://earthexplorer.usgs.gov/)에서 다운로드 가능하며, 처리 레벨에 따 라 단순 보정만 마친 Level 1 제품과 대기보정이 수행된 Level 2 Science Product 데이터도 제공하고 있다. 본 연구에서는 Level 2 Science Product의 Surface Reflectance Band 2, Band 3, Band 4, Band 5, Band 6 (Blue, Green, Red, NIR, SWIR1) 을 사용하였다 (Table 1).
유럽항공우주국의 Copernicus Sentinel-2 미션은 동일한 Sentinel-2A와 2B 두 대의 위성을 활용하여 운용 중이다.
Sentinel-2 데이터는 Copernicus Open Access Hub (https://scihub.copernicus.eu/dhus/#/home)을 통하여 다운로드가 가능 하다. 보정 단계에 따라 Level 1 데이터 외에 대기보정이 적용된 Level 2A가 존재하며, 본 과정에서는 Level 2A 제품의 Band 레벨에 따라 Band 2, Band 3, Band 4, Band 8A, Band 11 (Blue, Green, Red, NIR, SWIR 1) 을 사용하였다 (Table 1).
Table 1. 연구에 활용된 Landsat-8 및 Sentinel-2 촬영 밴드
사용 밴드 Landsat-8 Sentinel-2
Blue Band 2 Band 2
Green Band 3 Band 3
Red Band 4 Band 4
NIR Band 5 Band 8A
SWIR Band 6 Band 11
3. 자료 산출 방법
본 연구에서는 Landsat 위성영상과 Sentinel-2 위성영상을 사용하여 각종 인덱스를 계산하였다. 총 17종의 자료이며, Landsat-8과 Sentinel-2로 2019년과 2020년에 촬영된 영상을 활용하여 각각 제작했다.
수집된 영상 데이터는 Scene 별로 제공되며 촬영 일자에 따라 분광 특성이 크게 달라지므로 모자이크가 수행되어야만 한 다. 이에 따라 전체적인 작업 절차를 1) 좌표체계변환, 2) 모자이크, 3) RGB 및 CIR 이미지 생성과 4) 정규화지수 결과 생성 의 순으로 진행하였다.
3.1. 좌표계 변환
Landsat-8과 Sentinel-2 위성영상은 UTM 투영법을 기반으로 제공된다. 한편, 환경빅데이터 플랫폼에 구축된 기존 자료들은 UTM-K 좌표계로 제작되었으므로 데이터의 일관성을 유지하기 위하여 UTM-K로 좌표변환을 수행하였다.
3.2. 모자이크
모자이크 작업은 Geomatica 2018의 Mosaic Tool 소프트웨어를 사용하였다. Minimum relative difference 방법을 활용하여 Seamline을 계산했으며 이때의 Blend with는 200 픽셀로 설정했다. 모자이크 작업 결과물을 벡터 파일로 제공받은 행정경계 데이터를 이용하여 불필요한 부분을 clip함으로써 최종 모자이크 파일을 생성하였다.
3.3. RGB 및 CIR 이미지 저장
모자이크 작업 단계 이후, 모자이크 결과물로부터 RGB와 CIR 가시화 이미지를 추출하여 저장하였다. RGB 이미지는 Red 밴드, Green 밴드, Blue 밴드에 해당하는 이미지 채널 3개를 조합하여 저장하였으며 CIR 이미지는 Near Infrared 밴드. Red 밴드, Green 밴드에 해당하는 채널 3개를 조합하여 저장하였다.
3.4. 정규화지수 계산
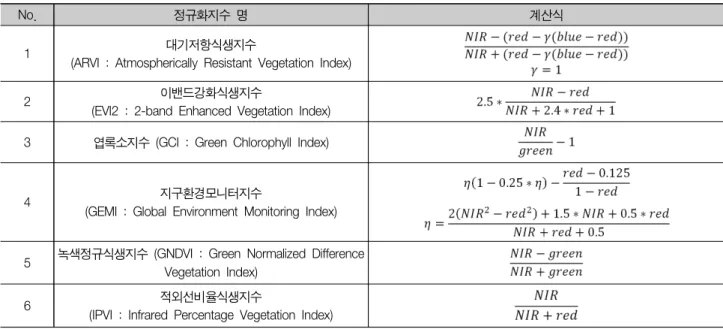
RGB 및 CIR 이미지 조합 외에 Blue, Red, Green, NIR, SWIR 밴드를 이용하여 정규화지수 결과물을 생성하였다. 래스터 밴드 간 연산은 정규화지수 별로 아래의 연산식 (Kaufman and Tanre, 1992; Huete et al., 2008; Schlemmer et al., 2013;
Myneni et al., 1995; Ustuner et al., 2014; Crippen, 1990; Ren et al., 2018; Penuelas et al., 1995; Gobron et al., 2000;
Gitelson et al., 2002; Jin and Sader, 2005; Ji et al., 2009)을 활용하였다 (Table 2).
Table 2. 정규화지수 계산식
No. 정규화지수 명 계산식
1 대기저항식생지수
(ARVI : Atmospherically Resistant Vegetation Index)
2 이밴드강화식생지수
(EVI2 : 2-band Enhanced Vegetation Index) 3 엽록소지수 (GCI : Green Chlorophyll Index)
4 지구환경모니터지수
(GEMI : Global Environment Monitoring Index)
5 녹색정규식생지수 (GNDVI : Green Normalized Difference Vegetation Index)
6 적외선비율식생지수
(IPVI : Infrared Percentage Vegetation Index)
4. 결과
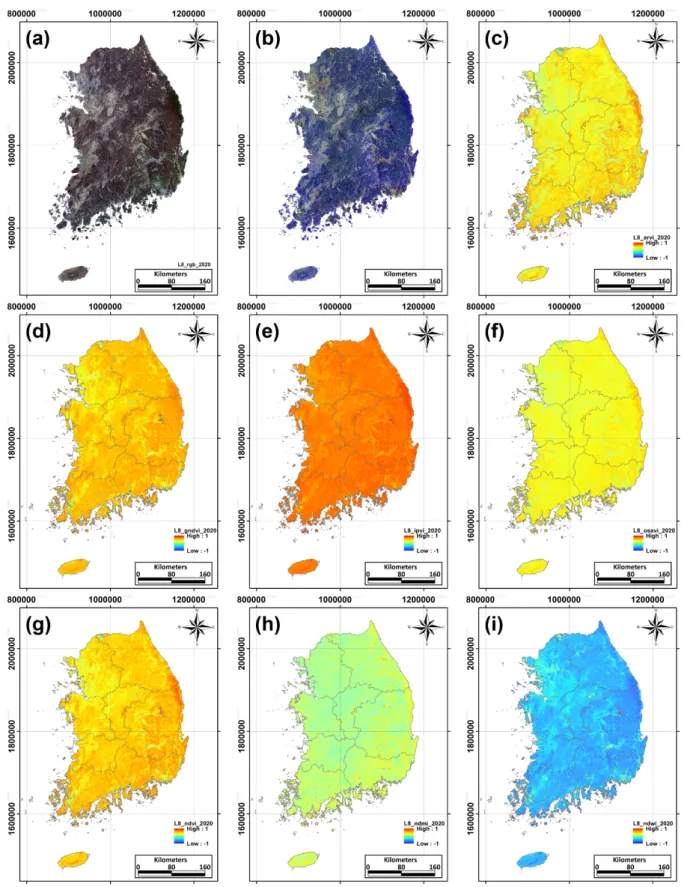
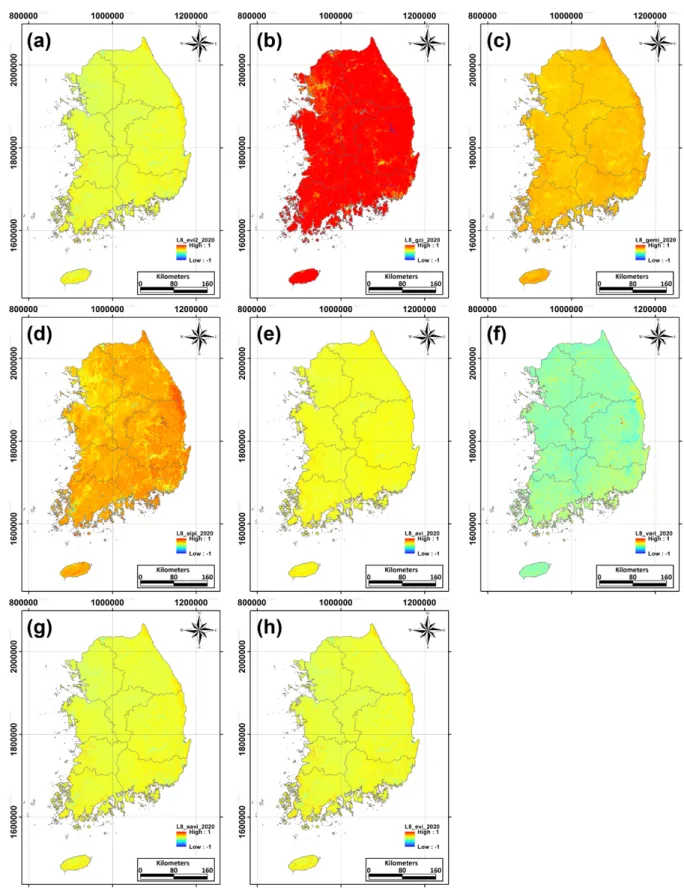
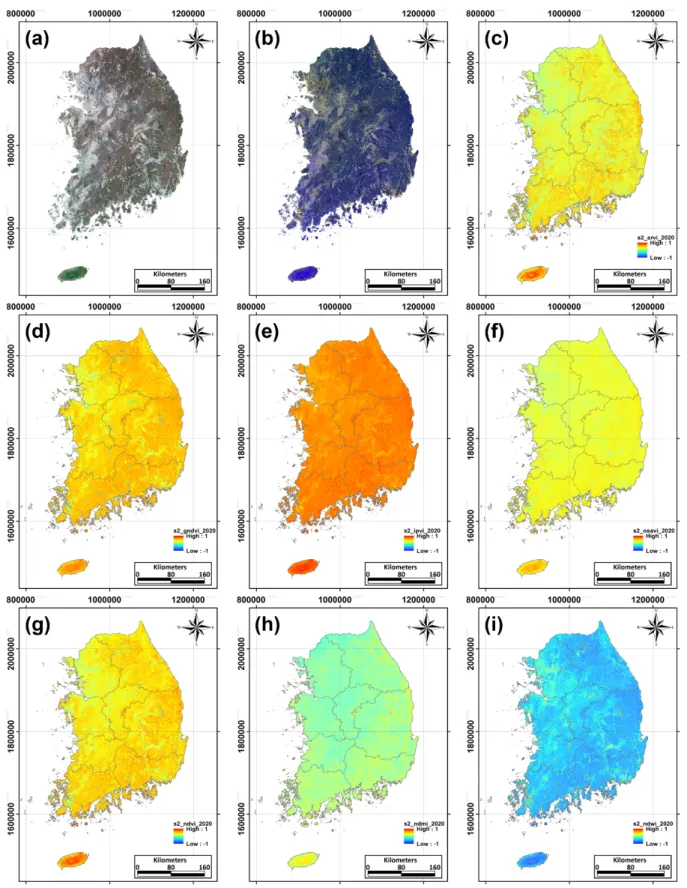
이상의 과정을 통하여 각 위성에 대하여 RGB 및 CIR 이미지와 15개의 정규화지수 자료를 각각 산출했다. Fig. 1. - Fig.
4.는 2019년과 2020년에 LANDSAT-8과 Sentinel-2로 촬영한 자료 중 2020년 영상자료를 활용하여 제작한 위성영상 산출물을 나타낸다.
No. 정규화지수 명 계산식
7 최적토양조정식생지수
(OSAVI : Optimized Soil Adjusted Vegetation Index)
8 구조둔감색소지수
(SIPI : Structure Insensitive Pigment Index)
9 변형식생지수
(AVI : Advanced Vegetation Index)
10 가시적대기저항지수
(VARI : Visible Atmospherically Resistant Index)
11 정규식생지수
(NDVI : Normalized Difference Vegetation Index)
12 정규습윤지수
(NDMI : Normalized Difference Moisture Index)
13 정규물지수
(NDWI : Normalized Difference Water Index)
14 토양조정식생지수
(SAVI : Soil Adjusted Vegetation Index)
15 식생강화지수 (EVI : Enhanced Vegetation Index)
Fig. 1. 2020년에 촬영한 Landsat-8 위성영상으로부터 제작한 (a) RGB; (b) CIR; (c) ARVI; (d) GNDVI; (e) IPVI; (f) OSAVI;
(g) NDVI; (h) NDMI; (i) NDWI;
Fig. 2. 2020년에 촬영한 Landsat-8 위성영상으로부터 제작한 (a) EVI2; (b) GCI; (c) GEMI; (d) SIPI; (e) AVI; (f) VARI;
(g) SAVI; (h) EVI;
Fig. 3. 2020년에 촬영한 Sentinel-2 위성영상으로부터 제작한 (a) RGB; (b) CIR; (c) ARVI; (d) GNDVI; (e) IPVI; (f) OSAVI;
(g) NDVI; (h) NDMI; (i) NDWI;
Fig. 4. 2020년에 촬영한 Sentinel-2 위성영상으로부터 제작한 (a) EVI2; (b) GCI; (c) GEMI; (d) SIPI; (e) AVI; (f) VARI;
(g) SAVI; (h) EVI;
5. 결론
본 연구에서는 2019년과 2020년에 Landsat-8과 Sentinel-2로 촬영된 영상을 활용하여 RGB와 CIR 영상과 15종의 정규화지 수 자료를 제작하였다. 결론적으로, 현재 2개년도 각 34종의 자료가 제작되었다. 제작된 자료는 추후 활용성과 접근성을 높이 기 위하여 다시 ASCII, ARCGIS GRID, GEOTIFF의 세 가지 데이터형으로 각각 변환했다. 또한, 모든 데이터는 남한 통판 자료와 9개 권역(경기, 강원, 충북, 충남, 경북, 경남, 전북, 전남, 제주)으로 분할한 형태로도 제공된다. 제작된 자료는 다양한 인덱스 자료를 기반으로 한 전국 단위의 분석에 활용될 수 있을 것으로 전망한다. 또한, 현재는 2년 치의 자료가 누적되었는 데, 지속적인 자료 누적을 통하여 각 인덱스 자료에 대한 시계열적 양상 분석 역시 가능할 것으로 전망한다. 분석된 위성 영상 산출물은 환경 비즈니스 빅데이터 플랫폼인 환경빅데이터 홈페이지(www.bigdata-environment.kr)에서 무료로 다운로드 가능하며, 매년 동일한 데이터를 누적하여 구축할 계획이다.
6. 사사
본 연구는 환경 비즈니스 빅데이터 플랫폼 및 센터 구축 사업의 지원으로 수행되었음.
7. 참고문헌
Crippen RE (1990) Calculating the vegetation index faster. Remote Sensing of Environment 34(1):71-73.
Gitelson AA, Kaufman YJ, Stark R, Rundquist D (2002) Novel algorithms for remote estimation of vegetation fraction.
Remote Sensing of Environment 80(1):76-87.
Gobron N, Pinty B, Verstraete MM, Widlowski JL (2000) Advanced vegetation indices optimized for up-coming sensors:
Design, performance, and applications. IEEE Transactions on Geoscience and Remote Sensing 38(6):2489-2505.
Ji L, Zhang L, Wylie B (2009) Analysis of dynamic thresholds for the normalized difference water index. Photogrammetric Engineering & Remote Sensing 75(11):1307-1317.
Jiang Z, Huete AR, Didan K, Miura T (2008) Development of a two-band enhanced vegetation index without a blue band. Remote sensing of Environment 112(10):3833-3845.
Jin S, Sader SA (2005) Comparison of time series tasseled cap wetness and the normalized difference moisture index in detecting forest disturbances. Remote Sensing of Environment 94(3):364-372.
Kaufman YJ, Tanre D (1992) Atmospherically resistant vegetation index(ARVI) for EOS-MODIS. IEEE Transactions on Geoscience and Remote Sensing 30(2):261-270.
Myneni RB, Hall FG, Sellers PJ, Marshak AL (1995) The interpretation of spectral vegetation indexes. IEEE Transactions on Geoscience and Remote Sensing 33(2):81-486.
Penuelas J, Baret F, Filella I (1995) Semi-empirical indices to assess carotenoids/chlorophyll a ratio from leaf spectral reflectance. Photosynthetica 31(2):221-230.
Ren H, Zhou G, Zhang F (2018) Using negative soil adjustment factor in soil-adjusted vegetation index(SAVI) for aboveground living biomass estimation in arid grasslands. Remote Sensing of Environment 209:439-445.
Schlemmer M, Gitelson A, Schepers J, Ferguson R, Peng Y, Shanahan J, Rundquist D (2013) Remote estimation of nitrogen and chlorophyll contents in maize at leaf and canopy levels. International Journal of Applied Earth Observation and Geoinformation 25:47-54.
Ustuner M, Sanli FB, Abdikan S, Esetlili MT, Kurucu Y (2014) Crop type classification using vegetation indices of rapid eye imagery. The International Archives of Photogrammetry, Remote Sensing and Spatial Information Sciences 40(7):195-198.
8. 데이터셋에 대한 메타데이터


