• 검색 결과가 없습니다.

Cross-Cultural Comparisons of Customer Perception at Restaurant Franchises in Beijing, Tokyo, and Seoul

N/A
N/A
Protected

Academic year: 2021

Share "Cross-Cultural Comparisons of Customer Perception at Restaurant Franchises in Beijing, Tokyo, and Seoul"

Copied!
8
0
0

로드 중.... (전체 텍스트 보기)

전체 글

(1)

ISSN 1225-0988 | EISSN 2234-6457 <Original Research Paper>

Cross-Cultural Comparisons of Customer Perception at Restaurant Franchises in Beijing, Tokyo, and Seoul

Pilsung Choe

*†

․Pei-Luen Patrick Rau․Gicheol Jeon

*

Department of Industrial Engineering, Tsinghua University, Beijing, P.R. China

북경 , 동경, 서울 소재 체인 음식점에서의 문화 차이에 따른 고객 인식 비교 연구

최필성․라우 패트릭․전기철 칭화대 산업공학과

Global restaurant franchises are becoming more and more popular in China, Japan, and South Korea. Understan- ding target customers’ needs for restaurant franchises is considered one of the most important factors for their business success. In this study, four domains-food-related domain (FRD), interior-related domain (IRD), staff- related domain (SRD), and convenience-related domain (CRD)-and 24 elements were classified. A survey with 450 respondents in the three capital cities (Beijing, Tokyo, and Seoul) was then conducted to examine the effect of the factors influencing customer satisfaction. After statistical analysis, thirteen main elements were found as factors influencing customer satisfaction. The analysis result showed that the food-related domain (FRD) was the most important in Beijing. The interior-related domain (IRD) and the convenience-related domain (CRD) were considered the most important in Tokyo and Seoul. Some cultural differences in customer satisfaction were also found. The results provide a guideline for better customer experience management of a restaurant franchise in the three cities.

Keywords: Service Quality, Customer Experience, Restaurant Franchise, Cross-Cultural Differences

1. Introduction

As a business globalizes, managing the experience of local customers is very important. Customer experience is what customers sense, feel, and think and how they act in relation to a company and its brands (LaSalle and Britton, 2003;

Schmitt, 1999; Shaw and Ivens, 2005). Customer experience is often explained at different customer levels, such as natio- nality, emotion, sense, spirit, and so on because these qual- ities are subjective perceptions (LaSalle and Britton, 2003;

Meyer, 2007; Schmitt, 1999). In this regard, understanding

local customers’ requirements is very important for a business success.

As a typical globalized business, restaurant franchises are becoming more and more popular. A franchise agreement is a contract between the franchiser and the franchisee. The fran- chiser is a parent company that has developed some products or services for sale, and the franchisee buys the right to sell them (Chin, 2008; Rubin, 1978).

Recently, restaurant franchises such as McDonald’s, KFC, and SUBWAY have become very common in China, Japan, and South Korea, along with their increased influence on the world economy. According to International Monetary Fund

This study was supported by a 2009 young researcher grant from Asia Research Center in Tsinghua University.

†Corresponding author : Pilsung Choe, Associate Professor, Department of Industrial Engineering, Tsinghua University, Beijing, China, Tel : +86-10-62796593, Fax : +86-10-62794399, E-mail : pchoe@tsinghua.edu.cn, pschoe@gmail.com

Received November 27, 2012; Revision Received February 6, 2013; Accepted April 9, 2013.

(2)

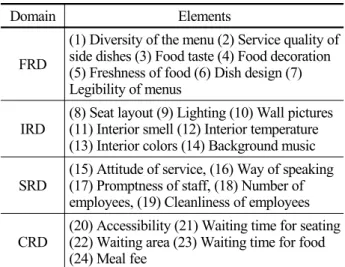
Table 1. Four domains and 24 elements

Domain Elements

FRD

(1) Diversity of the menu (2) Service quality of side dishes (3) Food taste (4) Food decoration (5) Freshness of food (6) Dish design (7) Legibility of menus

IRD (8) Seat layout (9) Lighting (10) Wall pictures (11) Interior smell (12) Interior temperature (13) Interior colors (14) Background music

SRD (15) Attitude of service, (16) Way of speaking (17) Promptness of staff, (18) Number of employees, (19) Cleanliness of employees

CRD (20) Accessibility (21) Waiting time for seating (22) Waiting area (23) Waiting time for food (24) Meal fee

(IMF; http://www.imf.org), the gross domestic products (GDPs) for the year 2012 of China, Japan, and South Korea are the second, third, and fifteenth largest, respectively, among all countries, and their GDP figures have been increasing rapidly.

Along with the rapid economic growth of these countries, in- dustrial cooperation or cultural exchange among these three countries is also increasing rapidly. This tendency is more distinct in their capital cities of Beijing, Tokyo, and Seoul.

These three cities are seemingly similar because of their geo- graphical proximity, shared history, and close economic rela- tionships. Customer experience, customer behavior, and ser- vice quality in these three countries, on the other hand, are considered quite different. Understanding the differences and providing quality services accordingly could make franchise businesses more successful and competitive.

The present study aims to investigate the important factors influencing customer satisfaction at restaurant franchisers and to examine how much different they are among three cit- ies of Beijing, Tokyo, and Seoul. This study then proposes guidelines for designing a restaurant franchise based on quantitative analyses using data obtained from a survey. The analyses will help restaurant franchisers or decision makers efficiently design a restaurant franchise or implement mar- keting strategies for quality service. This study is expected to ultimately enhance service quality and increase customer sat- isfaction at restaurant franchises in the three cities under investigation.

2. Literature Review

Measuring consumer perceptions related to a service is very useful when analyzing service quality. For example, SER- VQUAL (Parasuraman et al., 1988) has been used widely to analyze the quality of some types of services (Devaraj et al., 2002; Gounaris and Dimitriadis, 2003; Jiang et al., 2002,

Kang and Bradley, 2002). But, its applicability to a specific service environment has been controversial. So, we devel- oped a conceptual model of customer experiences at restau- rant franchises based on a literature review and brainstorm- ing to ensure our study design was suitable to examine res- taurant franchising. After reviewing other studies related to customer experience at restaurant franchises, four domains and 24 elements influencing customer satisfaction at restau- rants were initially identified as shown in <Table 1>. The four domains include the food-related domain (FRD), interior design-related domain (IRD), staff-related domain (SRD), and convenience-related domain (CRD).

2.1 Food-Related Domain

The food-related domain (FRD) included food and menu- related factors. Food is the main service at restaurants. A menu is the list of dishes that customers can order. Menu was included in the FRD in that diverse dishes in the menu can increase the possibility of ordering the food that a customer wants to eat. Many researchers have mentioned that food is the most important attribute that increases customer loyalty to a restaurant (Clark and Wood, 1998; Davis and Vollmann, 1990; Kivela et al., 2000; Susskind and Chan, 2000; Sulek and Hensley, 2004). Kivela et al. (2000) found that the first and the last impressions have the greatest impact on re- peat-purchase intentions, followed by excellence in service and food quality. Sulek and Hensley (2004) investigated the relative importance of food quality, physical settings, and service in a full-service restaurant and reported that food quality is the most significant predictor of customer satisfac- tion. Food quality involves taste, presentation, textures, colors, temperature, variety, healthy options, freshness, size of the portions, and entrée complexity (Sulek and Hensley, 2004).

Related to menus, a well organized menu has been known to help customers easily interpret the food and expected food quality (Parsa and Kahn, 1991, 1989). Service quality of side dishes (Han, 2009) and dish design (Parsa and Kahn, 1989) have been classified as factors influencing customer satisfac- tion in other research.

2.2 Interior Design-Related Domain

Interior design has been considered another important fac-

tor for quality service at restaurants. In the present study’s

context, the interior design-related domain (IRD) included

factors related to interior setting (Susskind and Chan, 2000),

the physical environment (Lambert and Watson 1984, Wake-

field and Blodgett, 1999), atmosphere or background music

(Milliman, 1986; Smith and Curnow, 1966), and seat layouts

or seating comfort (Sulek and Hensley, 2004; Wakefield and

Blodgett, 1996) all of which influenced customers’ cogni-

tions, emotions, feelings, or behaviors. In addition to these

elements, interior smells were considered a factor that influ-

enced customer satisfaction (Han, 2009).

(3)

2.3 Staff-Related Domain

In addition to the food and design aspects of a restaurant, staffing has been considered an important factor affecting customer satisfaction. The staff-related domain (SRD) in- cluded elements that influence interactions with customers.

The first mission of working staff at restaurants is to make customers comfortable (Erickson, 2004). They have to prop- erly speak, move, and serve (Testa and Sipe, 2006; Whyte, 1964) the restaurant’s customers. Customers’ perceptions re- garding how they are treated by working staff affects custo- mer satisfaction (Fitzsimmons and Maurer, 1991; Smith et al., 1999; Sparrow et al., 1992). Staff skills should include sensi- tivity, presence, helpfulness, friendliness, cleanliness, and politeness (Mittal and Lassar, 1996, Bitner, 1990; Knutson, 2000).

2.4 Convenience-Related Domain

Convenience can be considered as a significant advantage of restaurant franchises, because they are seen everywhere and the menu and taste have been standardized and verified.

The convenience-related domain (CRD) includes elements related to ease-of-use in terms of time, place, and cost. Loca- tion is an important factor to customer satisfaction of a res- taurant (Namkung and Jang, 2007) and convenience and ac- cessibility can be considered an important strength of restau- rant franchisees. Waiting time (Sulek and Hensley, 2004;

Clark and Wood, 1998) or the conditions in the waiting area (Baker and Cameron, 1996) have also been mentioned as im- portant factors in customer experience at restaurants. Percei- ved waiting time, for example, can be changed based on the condition of the waiting area (Baker and Cameron, 1996). A roomy waiting area tends to increase a customer’s willing- ness to wait for seating even if the restaurant is busy (Davis and Vollmann, 1990). In addition, perceived service quality has been researched as a function of the service price (Dube et al., 1999; Ryu and Jang, 2007; Varki and Colgate, 2001;

Zeithaml, 1988).

2.5 Research Framework

Customer experience at restaurant franchises in different countries can be very different, because cultures influencing customer experience differ among countries. Cross-cultural differences can be explained with many factors such as the economy, history, politics, education, beliefs, art, morals, customs, laws, and so on (Pheng and Yuquan, 2002). China, Japan, and South Korea are considered to have different cul- tures in that they differ in the factors noted above. The capi- tal cities of these three countries-Beijing, Tokyo, and Seoul- were chosen for the present research comparing cross-cul- tural differences because those capital cities are very influen- tial in their respective national economies.

<Figure 1> illustrates a framework of the present study de- scribing customer experiences at restaurant franchises.

Figure 1. Research framework of customer experience at restaurant franchises As shown in the figure, this study hypothesized that cus- tomer experience at restaurant franchises is influenced main- ly by four domains (FRD, IRD, SRD, CRD) with a collective total of 24 elements. The exhibit also shows that the degree of the impact by factors-domains and elements-differ among the three cities.

This study hypothesized that customer experience at res- taurant franchises is influenced mainly by four domains (FRD, IRD, SRD, CRD) with a total of 24 elements.

3. Method

To examine the present study’s research questions, a survey was conducted in the three capital cities, Beijing, Tokyo, and Seoul, between March and September 2010. A questionnaire asking about the respondents’ experiences at the restaurant franchise was used for the survey.

3.1 Questionnaire

A questionnaire was developed to measure customers’ per-

ceptions of the four domains and 24 elements affecting their

experiences at restaurant franchises <Appendix A>. The

questionnaire was first developed in English and then trans-

lated into Chinese, Japanese, and Korean for the respondents

within each city. To secure translation validity, the transla-

tion-retranslation approach was used. In addition, to improve

the questionnaire, a pilot survey was conducted with 30 stu-

dents representing the three nationalities (China, Japan, and

South Korea) at Tsinghua University in China. The question-

naire was composed of four parts including a prologue, dem-

ographic information, the main questions, and an epilogue

(Lehto and Buck, 2008). The demographic information in-

cluded the frequency of using restaurant franchises in the

(4)

past in addition to asking respondents for their basic infor- mation such as age, gender, and income. In this demographic information part, respondents were asked to choose one res- taurant franchise they visited most often and to answer the main questions based on their experiences at that restaurant’s franchises. The questionnaire included 24 questions intended to measure the customers’ perceptions on each of the 24 ele- ments <Table 1>. One additional question about general cus- tomer satisfaction at the restaurant franchise was included as a dependent variable. A 7-point Likert scale was used to cap- ture respondents’ answers.

3.2 Respondents

A total of 450 effective questionnaires (150 questionnaires per city) were collected after excluding 56 incomplete questionnaires. The survey respondents were chosen mainly near universities (Tsinghua University in Beijing, Waseda University in Tokyo, and Hanyang University in Seoul) be- cause restaurant franchises are very popular within college communities in these cities. As such, the majority of the re- spondents were college students (59% in Beijing, 77% in Tokyo, and 62% in Seoul). The number of males and females were fairly balanced in Beijing and Tokyo. In Seoul, however, females (69%) were the majority. The restaurant franchises they most preferred were somewhat different among three cities. In each case, the number in parentheses indicates the frequency of answers. Respondents in Beijing preferred Mc- Donald’s (27), KFC (26), Ma La You Huo (13), Xia Bu Xia Bu (11), and Yong He Da Wang (9). In Tokyo they favored Saizeriya (46), McDonald’s (22), Gusto (20), and Coco ichi- banya (20). In Seoul the top franchises were Outback Steak House (28), McDonald’s (18), Kim Bap Chun Guk (11), and Ashley (11).

4. Analyses and Results

Cronbach’s alpha (Cronbach, 1951) was conducted initially for all of the data from the three cities to check the internal consistency. The Cronbach’s alpha coefficients in each do- main were 0.7 or higher (0.70, 0.79, 0.84, and 0.70 for FRD, IRD, SRD, and CRD, respectively), which indicates that the questionnaire could be considered internally consistent. Fac- tor analysis was then conducted to confirm the four domains as factors. A stepwise multiple linear regression analysis was then performed to determine the relationship between the four domains and customer satisfaction.

4.1 Factor Analysis

An initial confirmatory factor analysis was conducted to find main elements for positive customer experiences. After obtaining the rotated component matrix with 24 elements, el-

ements whose factor loadings were less than 0.6 were re- moved for analysis. From the analysis, 13 out of the 24 ele- ments were considered main elements. These included : wall pictures, lighting, interior color, interior smell, attitude of service, way of speaking, promptness of staff, number of em- ployees, food taste, food decoration, waiting time for seating, waiting time for food, and accessibility. The eleven elements that were not in the four factors were regarded as relatively unimportant to increase customer satisfaction at restaurant franchises, and the 13 elements were then considered for fur- ther analysis.

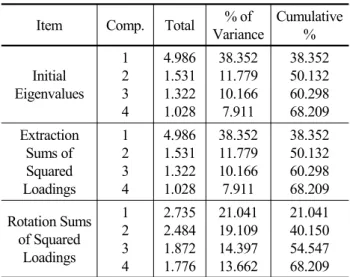
Factor analysis with the elements was conducted. As shown in <Table 2>, the upper four components explained about 68% of the total variance. Each initial eigenvalues for the four components were greater than 1.

Table 2. Variance ratios for top four components

Item Comp. Total % of

Variance

Cumulative

%

Initial Eigenvalues

1 2 3 4

4.986 1.531 1.322 1.028

38.352 11.779 10.166 7.911

38.352 50.132 60.298 68.209 Extraction

Sums of Squared Loadings

1 2 3 4

4.986 1.531 1.322 1.028

38.352 11.779 10.166 7.911

38.352 50.132 60.298 68.209 Rotation Sums

of Squared Loadings

1 2 3 4

2.735 2.484 1.872 1.776

21.041 19.109 14.397 13.662

21.041 40.150 54.547 68.209

Table 3. Rotated component matrix

Elements Component

1 2 3 4

Way of speaking Attitude of service Promptness of staff Number of employees

.842 .842 .731 .666 Wall pictures

Lighting Interior smell Interior color

.816 .702 .698 .680 Waiting time for seating

Waiting time for food Accessibility

.820 .796 .617 Food taste

Food decoration .825

.745 The final rotated component matrix was then obtained

<Table 3>. As shown in <Table 3>, all factor loadings great-

(5)

er than 0.6 after the varimax rotation were included in the matrix. The results revealed that the four factors are well rep- resented with the 13 elements. More specifically, (1) attitude of service, way of speaking, promptness of staff, and number of employees; (2) wall pictures, lighting, interior color, and interior smell; (3) waiting time for seating, waiting time for food, and accessibility; and (4) food taste and food deco- ration were grouped as factors. The latter results support the fact that the four factors from the factor analysis correspond to four domains of SRD, IRD, CRD, and FRD, which were defined at the beginning of the research.

4.2 Regression

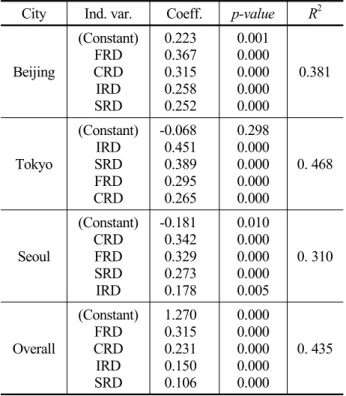
A stepwise multiple linear regression analysis was con- ducted to determine the relationship between the four do- mains as independent variables and customer satisfaction (at the restaurant franchise) as the dependent variables. As shown in <Table 4>, all domains turned out to be significant pre- dictors of customer satisfaction (α = 0.05).

Table 4. Regression analysis with domains City Ind. var. Coeff. p-value R

2

Beijing

(Constant) FRD CRD IRD SRD

0.223 0.367 0.315 0.258 0.252

0.001 0.000 0.000 0.000 0.000

0.381

Tokyo

(Constant) IRD SRD FRD CRD

-0.068 0.451 0.389 0.295 0.265

0.298 0.000 0.000 0.000 0.000

0. 468

Seoul

(Constant) CRD FRD SRD IRD

-0.181 0.342 0.329 0.273 0.178

0.010 0.000 0.000 0.000 0.005

0. 310

Overall

(Constant) FRD CRD IRD SRD

1.270 0.315 0.231 0.150 0.106

0.000 0.000 0.000 0.000 0.000

0. 435

Overall, the FRD was considered the most important for customer satisfaction with the regression coefficient, 0.315.

But, the importance of the FRD varied by city (first in Beijing, third in Tokyo, and second in Seoul). The FRD was the most important domain in Beijing. For the Japanese (respondents in Tokyo), the most important domain was IRD, whereas it was the least important in Beijing and Seoul. In Tokyo, the SRD was considered more to be important than the FRD and the CRD, which were the first two important factors in Tokyo and Seoul. The CRD for Koreans was the

most important, whereas it was considered the least in Tokyo.

Another stepwise multiple linear regression analysis was conducted (α = 0.05) with the 13 <Table 5>. Interestingly, accessibility was overall the most important element influ- encing customer satisfaction with the regression coefficient of 0.220. This results demonstrate the importance of restau- rant franchise be accessible, which is related to the number of franchises, transportation, and location. Food taste (0.207), food decoration (0.152), way of speaking (0.139), waiting time for food (0.125), and lighting (0.122) were also sig- nificantly important for customer satisfaction. Other elements, including attitude of service, promptness of staff, number of employees, interior color, interior smell, waiting time for seating, and food decoration were eliminated in the stepwise procedure of the analysis.

Food taste was important in all three cities. Beijing and Seoul showed the same tendencies as the overall result. Ligh- ting, however, was the most important for Japanese respon- dents. Even accessibility and way of speaking were consid- ered more important than food taste in Tokyo. In fact, only in Tokyo were lighting and way of speaking found to be im- portant elements to customer satisfaction. In addition to food taste, waiting time for food was the next important element in Seoul, which showed Koreans are impatient when being served in franchise restaurants.

Table 5. Regression analysis with elements

City Ind. var. Coeff. p-value R

2

Beijing

(Constant) Food taste Wall pictures Accessibility

-2.920 0.357 0.164 0.127

0.000 0.000 0.001 0.017

0.415

Tokyo

(Constant) Lighting Accessibility Way of speaking

Food taste

-4.139 0.244 0.231 0.222 0.150

0.000 0.000 0.000 0.000 0.001

0. 536

Seoul

(Constant) Food taste Waiting time for food

Wall pictures

-3.407 0.290 0.250 0.140

0.000 0.000 0.000 0.002

0. 344

Overall

(Constant) Accessibility

Food taste Food decoration Way of speaking Waiting time for food

Lighting

-3.576 0.220 0.207 0.152 0.139 0.125 0.122

0.000 0.000 0.000 0.001 0.001 0.002 0.004

0. 407

4.3 Duncan’s Multiple Range Test

To check for any specific differences among the cities,

Duncan’s multiple range test was conducted (α = 0.05) after

confirming a significant difference using ANOVA (α = 0.05)

(6)

on a domain or an element. In terms of domains, the FRD was the only domain showing significance, with the other do- mains remaining insignificant. As shown in <Table 6>, all of the three cities showed significant difference on the FRD (α

= 0.05). Respondents in Beijing (Chinese) were influenced by the FRD with 19.94; Koreans and Japanese followed with 18.47 and 17.51, respectively.

Table 6. Duncan’s multiple range test with the FRD

City Subset1 Subset2 Subset3

Tokyo 17.51

Seoul 18.47

Beijing 19.94

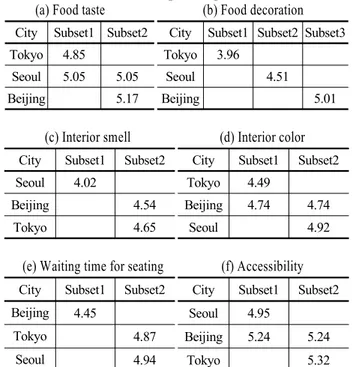
Among the 13 elements, food taste, food decoration, in- terior smell, interior color, waiting time for seating, and ac- cessibility, showed significant differences (α = 0.05) among the three counties <Table 7>. We found no significant differ- ence with the elements in the SRD.

Table 7. Duncan’s multiple range test with elements (a) Food taste (b) Food decoration City Subset1 Subset2

Tokyo 4.85

Seoul 5.05 5.05

Beijing 5.17

City Subset1 Subset2 Subset3 Tokyo 3.96

Seoul 4.51

Beijing 5.01

(c) Interior smell (d) Interior color City Subset1 Subset2

Seoul 4.02

Beijing 4.54

Tokyo 4.65

City Subset1 Subset2

Tokyo 4.49

Beijing 4.74 4.74

Seoul 4.92

(e) Waiting time for seating (f) Accessibility City Subset1 Subset2

Beijing 4.45

Tokyo 4.87

Seoul 4.94

City Subset1 Subset2

Seoul 4.95

Beijing 5.24 5.24

Tokyo 5.32

Food taste showed a significant difference between Japa- nese (4.85) and Chinese (5.17) respondents. This result revea ls that Chinese expectations for food at the restaurant fran- chise are higher than those of the Japanese. But, no significant difference between the Japanese and Koreans or the Koreans and the Chinese was found on food taste. Food decoration was more important to Chinese (5.01) than to Koreans (4.51) or to Japanese (3.96). Interior smell was more important to Chinese (4.65) and Japanese (4.54) than to Koreans (4.02).

Interior color was more important to Koreans (4.92) and Chinese (4.74) than to Japanese (4.49). Waiting time for seat-

ing was more important to Koreans (4.94) and Japanese (4.87) than to Chinese (4.45). Accessibility was more impor- tant to Japanese (5.32) and Chinese (5.24) than to Koreans (4.95).

The following summarizes some noticeable results based on the previous analyses. First, the most influential domain for customer satisfaction was different among the three cities.

The FRD, the IRD, and the CRD were the most important domains for Chinese, Japanese, and Koreans respectively.

This result seems to reflect the character of customers in each city (or a stereotype of each country) quite well. This result also provides information for a key success factor for the business in that the food taste in the same type of restaurant franchise is commonly similar. For Koreans for example, the investment to improve the convenience of using the restau- rant franchises might be a better strategy than decorating the restaurant to attract customers. Second, the IRD and SRD for Japanese and the FRD and CRD for Chinese and Koreans were more important domains. Interestingly, the importance of the SRD was higher in the country with the higher GDP per capita (Japan-South Korea-China). This result may show the tendency that the relative importance of the SRD has among FRD, IRD, SRD, and CRD will be growing in all countries as their economies grow. This also represents the relative importance of staff training for restaurant franchises in the long run. But, there were no significant differences among three cities in all domains except for the FRD. Third, the most influential element for customer satisfaction was slightly different among the three cities. Food taste was dom- inantly important for Chinese. For Japanese respondents, lighting, accessibility, and way of speaking were more im- portant than food taste. For Korean’s the waiting time for food was second next to food tastes. Interestingly, the im- portance of food decoration in Beijing was significantly higher than in Tokyo or in Seoul. These results can provide marketing guidelines for restaurant franchises in three cities.

That is, excluding food taste, which should be important for any location, improving the quality of the element evaluated to be important in each city can an efficient way to increase customer satisfaction.

5. Discussion and Conclusions

The present study classified four domains and 24 elements in

the customer experience at restaurant franchises based on the

literature review. A survey to compare the three cities (Bei-

jing, Tokyo, and Seoul) was then conducted. Thirteen ele-

ments were identified based on the factor analysis. The anal-

yses showed that important domains and elements affecting

customer satisfaction were very different among the three

cities. In conclusion, this research supported the hypothesis

that customer experience at restaurant franchises is influ-

(7)

enced by four domains and elements in different degrees among three cities, Beijing, Tokyo, and Seoul. Based on the latter result, this study provides a customer experience man- agement (CEM) guideline for restaurant franchisees in the three cities to increase customer satisfaction. This result sup- ported the fact that implementing localized marketing strat- egies for a global restaurant franchise business could be an effective strategy to efficiently penetrate the market of the three cities.

Based on the statistical analyses introduced in Section 4, some strategies for customer experience management can be provided. For example, menu development, food global- ization, or food localization can be important strategies in Beijing because the food taste there was the most important to customer satisfaction. Customizing illuminations depend- ing on customer preference or the type of the restaurant should be very important in Tokyo. Some types of staff-re- lated programs such as staff training, staff rewards, or a com- plaint reporting system might be applicable solutions to im- prove the SRD in Tokyo. To ensure speedy service or to make the waiting time for food less boring in Seoul, some novel approaches can be considered. Improving the service flow or redesigning the layout can decrease service time.

Providing entertainment such as magazines is an inexpensive way for waiting customers to pass the time. To improve ac- cessibility, providing free transportation (e.g., a shuttle bus) or advertising the restaurant franchise with directions to the nearest locations should be very helpful.

Despite the useful information the present study generated, some careful interpretations should be made. The differences in influential domains or elements of customer satisfaction among cities may arise from complicated reasons. The rea- sons can be classified into primary factors caused by service providers (restaurant franchisees) and secondary factors in- cluded in cultures. The primary factors are related directly to all services provided from the restaurant franchises. Having different lengths of history, restaurant franchises in the three cities may have different qualities of service, service know- how, or service systems that cause customer satisfaction. The secondary factors (cultures) can also influence customers both directly and indirectly. Customer satisfaction is very subjective. Customers in different cultures (different cities or countries) may have different perceptions with the same experience. For example, food taste was commonly im- portant to respondents in all three cities, but the present study did not inquire about which food taste was preferred. Take wall pictures as another example; the kind of pictures re- spondents like can be highly influenced by their cultures. In this regard, customer preferences and requirements for each domain and element need to be examined clearly to give a complete CEM guideline for a restaurant franchiser. Further studies with more diversified populations from the three countries will be necessary to generalize the results from this research considering that only three cities were compared.

References

Baker, J. and Cameron, M. (1996), The Effects of the Service Environment on Affect and Consumer Perception of Waiting Time : An Integrative Review and Research Propositions, Journal of the Academy of Marketing Science, 24(4), 338-349.

Bitner, M. J., Booms, B. H., and Tetreault, M. S. (1990), The Service Encounter : Diagnosing Favorable and Unfavorable Incidents, Journal of Marketing, 54(1), 71-84.

Chin, J. B. (2008), A Study of Taiwan Takeout Beverage Franchise Chain Business Performance Model, IEEE Xplore, 8(2), 1-5.

Cronbach, L. (1951), Coefficient Alpha and the Internal Structure of Tests, Psychometrika, 16(3), 297-334.

Clark, M. A. and Wood, R. C. (1998), Consumer Loyalty in the Restaurant Industry : A Preliminary Exploration of the Issues, International Journal of Contemporary Hospitality Management, 10(4), 139-144.

Davis, M. M. and Vollmann, T. E. (1990), A Framework for Relating Waiting Time and Customer Satisfaction in a Service Operation, Journal of Services Marketing, 4(1), 61-69.

Devaraj, S., Fan, M., and Kohli, R. (2002), Antecedents of B2C Channel Satisfaction and Preference : Validation E-Commerce Metrics, Informa- tion Systems Research, 13(3), 316-333.

Dube, L., Johnson, M. D., and Renaghan, L. M. (1999), Adapting the QFD Approach to Product Design in Extended Service Transactions, Produc- tion and Operations Management, 8(3), 301-317.

Erickson, K. (2004), Bodies at Work : Performing Wervice in American Restaurants, Space and Culture, 7(1), 76-89.

Fitzsimmons, J. A. and Maurer, G. B. (1991), A Walk-through Audit to Im- prove Restaurant Performance, The Cornell Hotel and Restaurant Admi- nistration Quarterly, 31(4), 94-99.

Gounaris, S. and Dimitriadis, S. (2003), Assessing Service Quality on the Web : Evidence from Business-to-Consumer Portals, Journal of Services Marketing, 17(5), 529-548.

Han, H. and Ryu, K. (2009), The Roles of the Physical Environment, Price Perception, and Customer Satisfaction in Determining Customer Loyalty in the Restaurant Industry, Journal of Hospitality and Tourism Research, 33(4), 487-510.

Jiang, J. J., Klein, G., and Carr, C. L. (2002), Measuring Information System Service Quality : SERVQUAL from the Other Side, MIS Quarterly, 26(2), 145-166.

Kivela, J., Inbakaran, R., and Reece, J. (2000), Consumer Research in the Restaurant Environment. Part 3 : Analysis, Findings and Conclusions, International Journal of Contemporary Hospitality Management, 12(1), 13-30.

Kang, H. and Bradley, G. (2002), Measuring the Performance of IT Services : An Assessment of SERVQUAL, International Journal of Accounting Information Systems, 3(3), 151-164.

Knutson, B. J. (2000), College Students and Fast Food : how Students Perceive Restaurant Brands, Cornell Hotel and Restaurant Administration Quarterly, 41(3), 68-74.

Lambert, C. U. and Watson, K. M. (1984), Restaurant Design : Researching the Effects on Customers, Cornell Hotel and Restaurant Administration Quarterly, 24(4), 68-76.

LaSalle, D. and Britton, T. A. (2003), Priceless : Turning Ordinary Products into Extraordinary Experiences, Harvard Business School Press, Boston, MA.

Lehto, M. R. and Buck, J. R. (2008), Introduction to Human Factors and

Ergonomics for Engineers, Lawrence Erlbaum Associates, New York,

(8)

NY.

Meyer, C. and Schwager, A. (2007), Understanding Customer Experience, Harvard Business Review, 85(2), 116-126.

Milliman, R. E. (1986), The Influence of Background Music on the Behavior of Restaurant Patrons, Journal of Consumer Research, 13(2), 286-289.

Mittal, B. and Lassar. W. M. (1996), The Role of Personalization in Service Encounters, Journal of Retailing, 72(1), 95-109.

Namkung, Y. and Jang, S. (2007), Does Food Quality Really Matter in Restaurants? Its Impact on Customer Satisfaction and Behavioral Inten- tions, Journal of Hospitality & Tourism Research, 31(3), 387-410.

Parasuraman, A., Zeithaml, V. A., and Berry, L. L. (1988), SERVQUAL : A Multiple-Item Scale for Measuring Consumer Perceptions of Service Quality, Journal of Retailing, 6(1), 12-40.

Parsa, H. G. and Khan, M. A. (1989), Analysis of Menu Trends in Fast Food Industry, Journal of Hospitality Education and Research, 13(3), 545.

Pheng, L. S. and Yuquan, S. (2002), An Exploratory Study of Hofstede’s Cross-Cultural Dimensions in Construction Projects, Management Deci- sion, 40(1), 7-16.

Rubin, P. H. (1978). The Theory of the Firm and the Structure of the Franchise Contract, Journal of Law and Economics, 21(1), 223-233.

Ryu, K. and Jang, S. S. (2007), The Effect of Environmental Perceptions on Behavioral Intentions through Emotions : The Case of Upscale Restau- rants, Journal of Hospitality and Tourism Research, 31(1), 56-72.

Schmitt, B. H. (1999), Experience Marketing : How to Get Customers to Sense, Feel, Think, Act, Relate to Your Company and Brands, Simon and Schuster Inc, New York, NY.

Shaw, C. and Ivens, J. (2005), Building Great Customer Experiences.

Palgrave MacMillan, New York, NY.

Smith, A. K., Bolten, R. N., and Wagner, J. (1999), A Model of Customer Satisfaction with Service Encounters Involving Failure and Recovery, Journal of Marketing Research, 36(3), 356-372.

Smith, P. C. and Curnow, R. (1966), Arousal Hypothesis and the Effects of Music on Purchasing Behavior, Journal of Applied Psychology, 50(June), 255-286.

Sparrow, J, Ingold, T., Huyton, J., and Baker, J. (1992), Experienced Staff and Tailoring Food Service, International Journal of Contemporary Hospi- tality Management, 4(1), 4-10.

Sulek, J. M. and Hensley, R. L. (2004), The Relative Importance of Food, Atmosphere, and Fairness of Wait : the Case of a Full-Service Restaurant, Cornell Hotel and Restaurant Administration Quarterly, 45(3), 235-247.

Susskind, A. M. and Chan, E. K. (2000), How Restaurant Features Affect Check Averages : A Study of the Toronto Restaurant Market, Cornell Hotel and Restaurant Administration Quarterly, 42(6), 56-63.

Testa, M. R. and Sipe, L. J. (2006), A Systems Approach to Service Quality : Tools for Hospitality Leaders, Cornell Hotel and Restaurant Administra- tion Quarterly, 47(1), 36-48.

Varki, S. and Colgate, M. (2001), Role of Price Perceptions in an Integrated Model of Behavioral Intentions, Journal of Service Research, 3(3),

232-240.

Wakefield, K. L. and Blodgett, J. G. (1996), The Effect of the Servicescape on Customers’ Behavioral Intentions in Leisure Service Settings, Journal of Services Marketing, 10(6), 45-61.

Whyte, W. F. (1964), Part III. Human Relations in the Restaurant Industry, Cornell Hotel and Restaurant Administration Quarterly, 5, 35-47.

Zeithaml, V. A. (1988), Consumer Perceptions of Price, Quality, and Value : A Means-end Model and Synthesis of Evidence, The Journal of Marke- ting, 52(3), 2-22.

<Appendix A> Questions of the Questionnaire

Mark the following questions using 7-likert scale based on your experience at the restaurant franchise.

1. I was satisfied with the diversity of the menus.

2. I was satisfied with quantity or quality of the free side dishes.

3. The food taste was good to me.

4. I was satisfied with the food decoration.

5. The material for the food was fresh.

6. I was satisfied with the dish’s design.

7. The menus were easy to read.

8. The seat layout was satisfactory.

9. I was satisfied with the interior lighting.

10. I was satisfied with the picture hanging on the wall.

11. The indoor smell was good.

12. The interior temperature was proper.

13. The interior color was good.

14. The background music of the restaurant was good.

15. I was satisfied with employees’ attitude for service.

16. I was satisfied with way of speaking of employees.

17. The employees quickly responded to customers’ order.

18. The number of employees was enough for service.

19. The employees were clean.

20. The restaurant was easy to go.

21. I was satisfied with the waiting time for seating.

22. I was satisfied with the waiting place for seating.

23. I was satisfied with the waiting time for food after being seated.

24. The meal fee was reasonable.

25. I was satisfied with the restaurant franchise.

수치

Table 1. Four domains and 24 elements
Table 2. Variance ratios for top four components
Table 4. Regression analysis with domains City Ind. var. Coeff. p-value R 2
Table 7. Duncan’s multiple range test with elements       (a) Food taste                           (b) Food decoration City Subset1 Subset2

참조

관련 문서

This study aims to investigate the students' motivation and satisfaction on college English course by English majors and non-majors. Three research questions

Secondly, the important factors to attract T/S cargo at Kwangyang Port are geographical location, promotion activity to introduce Port and expansion of

The effects of economic and cultural factors, state autonomy, institutional level, and policy network are crucial in accounting for the developmental pathway influencing

In conclusion, this study examines the impact of the security quality level of Busan port on port service quality, customer satisfaction, and customer loyalty, and

The purpose of this study is to identify how the Customer Satisfaction (CS) policy affects the employees'level of stress and satisfaction, and to minimize the

The purpose of this study is to analyze the effects of service quality on customer satisfaction and revisit intention perceived by Chinese golf range

Objective: The purpose of this study is to investigate the relationship between employee satisfaction and patient safety and quality improvement after compulsory certification

The purpose of this study is to determine customer satisfaction and repurchase intentions based on various characteristics when Korean Chinese consumers actually