1. INTRODUCTION
Nowadays electricity load forecasting is the routine for power generation unit schedule. It is vi- tal for the security and reliability of the electric power transmission system. Generally, load fore- casting aims to extrapolate pattern of load con- sumption under the effect of factors, such as weather and day-of-week, etc. However, it is a complex nonlinear problem linked with social con- siderations, economic factors, and weather varia- tions, then it is difficult to obtain accurate and real- istic models for such methods.
There are many methods existing in electricity load forecasting. As time series, auto-regressive integrated moving average model (ARIMA) is typ- ically used by many researchers as a sophisticated benchmark for evaluating alternative proposals [1,2]. The regression related methods [3,4] and ex- ponential smoothing ones [5,6] are always attrac- tive because they are easily implemented. Nowadays
data mining technique also becomes attractive and widespread due to their flexibility and explanation capabilities [7]. In paper [7], it provided a compar- ison of Seasonal ARIMA and Holt-Winters model.
Differing from previous studies, it classified load pattern into 4 types and handled them respectively.
It mentioned k-NN algorithm and used the algo- rithm in classification. However, it did not address the the issue of dimension reduction. The papers [8,9] belong to the sort of k-NN based forecasting.
And they do not discuss dimension reduction either.
In this paper, we propose an approach of di- mension reduction suiting for k-NN based short- term load forecasting. As we known, the under- lying principle of k-NN based forecasting is to find observations in the past which may similar to the object that to be predicted. In short-term load fore- casting, temperature variations cause uncertainty mostly. Therefore, the novel of the approach we proposed is to eliminate the features which are not
An Approach of Dimension Reduction in k -Nearest Neighbor Based Short-term Load Forecasting
FaZheng Chu
†, Sung-Hwan Jung
††ABSTRACT
The k-nearest neighbor (k-NN) algorithm is one of the most widely used benchmark algorithm in classification. Nowadays it has been further applied to predict time series. However, one of the main concerns of the algorithm applied on short-term electricity load forecasting is high computational burden.
In the paper, we propose an approach of dimension reduction that follows the principles of highlighting the temperature effect on electricity load data series. The results show the proposed approach is able to reduce the dimension of the data around 30%. Moreover, with temperature effect highlighting, the approach will contribute to finding similar days accurately, and then raise forecasting accuracy slightly.
Key words: Load Forecasting, k-Nearest Neighbor, Dimension Reduction
※ Corresponding Author: Sung-Hwan Jung, Address:
20 Changwondaehak-ro, Uichang-gu Changwon-si, Gyeongsangnam-do, 51140 Korea, TEL: +82-55-213-3815, FAX: +82-55-286-7429, E-mail: [email protected] Receipt date : Jul. 4, 2017, Revision date : Aug. 28, 2017 Approval date : Aug. 31, 2017
††Economics and Management College of Qingdao Agricultural University
(E-mail: [email protected])
††Dept. of Computer Engineering, Changwon National University
sensitive to temperature variation. It is different from the past studies which focus on if the feature is helpful to discriminate the observations.
The rest of the paper is organized as the follow- ing sections: Section 2 analyzes the decisive fac- tors on short-term electricity load and raises as- sumptions of our approach. Section 3 elaborates the principle we proposed for dimensionality reduction on load data series and shows comparison between a conventional k-NN method[10] and the method we proposed. Section 4 consists of summary and conclusion.
2. DECISIVE FACTORS ON SHORT-TERM LOAD
Due to the wide application of electricity in mod- ern economic life, there are a lot of factors impact- ing on the electricity consumption, such as eco- nomic growth, population, industrial restructuring, technique developing and renewable energy. The influence from these factors on electricity load var- ies with time span. As to short-term load forecast- ing, date attributes and weather condition are widely accepted as decisive factors.
2.1 Date Attribute
Date attribute refers to what day is the date and whether the day is a holiday or not. The typical load profile of day-of-week in Fig. 1, based on the average of daily electricity load from New York, March 2015. It is very easy to distinguish the pat- tern of weekdays from those of weekend. Additio- nally, the figure also indicates that the gap between Saturday and Sunday is bigger than those among weekdays.
The load profiles for days in a week are easily distinguished, furthermore it is easy to ascertain date attribute of any specific date. Hence taking date attribute as an input is a zero-cost measure to improve k-NN based load forecasting, since we can locate similar days more accurately with date
attribute.
2.2 Temperature
Electricity load is strongly impacted by weather conditions which include precipitation, high and low temperatures, thunderstorms and snowfall.
Because of the significant correlation among these weather indicators, conventionally temperature was introduced as the only one variable in load forecasting methods for purpose of simplicity. It is worth noting that when the temperature rises upon a critical point the electricity load would increase drastically. Average electricity load to average outdoor temperature is plotted in Fig. 2, based on the data of New York, 2015. The turning point shown in the figure is about 55 Fahrenheit degrees.
2.3 Assumptions
According to the analysis above, we raise two assumptions:
1. Short-term electricity load is only decided by two factors: date attribute and weather.
2. Similar days are the days of similarity on both date attribute and weather condition simultaneously.
Based on the two assumptions, it is feasible to denote short-term electricity load L on time point t simply as:
t t t
t
f w v
L = ( , ) + e (1)
Fig. 1. Daily electricity load profile of day-of-week [New York].
where w denotes weather condition, and v denotes date attribute, ε∼N(μ,σ) denotes error term.
Then, as to forecast the L
t+1, forecasting meth- ods intend to find the k nearest neighbor as L
t-s1, L
t-s2, L
t-s3, L
t-s4, ..., L
t-sk, which close to the L
t. Considering the Eq. (1), even though two days are close on value L, it cannot guarantee the two days are close on both w and v. Following assump- tion (2), the two days are not surely the similar days.
To filter out nearest neighbors which are not identical to L
ton day-of-week, as we call it
“day-alignment”, would be beneficial to k-NN based load forecasting. That has been reported in [3].
Following the assumptions, we propose a meth- od as “weather-alignment” to improve k-NN based short-term load forecasting.
3. METHODOLOGY
Conventionally, we take temperature as the main input for weather factor. During a day, the sensi- tivity of load to temperature variation is changing constantly. To evaluating the sensitivity and re- move the data that insensitive to temperature will lighten computational burden and improve k-NN based short-term load forecasting.
3.1 Sensitivity of Load to Temperature Variation In fact, the sensitivity to temperature variation of electricity load is different for each user group, such as residential user, commercial user and in- dustrial user. Temperature Sensitivity (TS) of electricity load is defined as:
T E
TS
= D / D (2)
where ΔE is difference of electricity load and ΔT is difference of temperature.
The temperature sensitivity of each user group in Taiwan are shown as Fig. 3, industrial user is usually of less sensitivity to high temperature than the others. But in recent years, the temperature sensitivity of residential user keeps increasing due to the pursuit of high quality life [11].
The correlation of temperature and electricity load is also helpful for weather-alignment. Usually, Pearson Correlation Coefficient (PCC) is used to measure correlation of two variables. However, load data series is usually non-stationary, it often presents changing mean and variance over time.
For that reason, we suggest Zhang-Yaoting index to measure the correlation of electricity load and temperature [12].
Zhang-Yaoting index is derived from the notion of probabilistic. For independent event A and B, the probability of simultaneous occurrence of them is
) ( ) ( )
(
AB P AP BP
= (3)
Accordingly, the rules could be employed to
Fig. 2. Electricity load to temperature [New York].Fig. 3. Temperature sensitivity of electricity load [Taiwan].
evaluate the correlation of A and B as shown in Table 1.
Specific to our issue of the correlation between electricity load and temperature variation, the in- dex can be calculated as following description.
Given any two time points i and j, the corre- sponding electricity load and temperature are de- noted by L
i, L
jand T
i, T
jrespectively. Let event A is L
i>L
jand event B is T
i>T
j.
When event A occurs, there are three situations for event B:
1. The event B rarely occurs: They are of neg- ative correlation.
2. The event B frequently occurs: They are of positive correlation.
3. The event B occurs in nearly half of the possi- ble: They are of independent.
Now, let a
ijequals the value of sign function of (L
i-L
j), that is:
. ..., , 2 , 1 , , , , 1 , 0 , 1 ) (
sgn i j i j n
L L
L L
L L L
L a
j i
j i
j i j
i
ij < =
ï î ïí ì
<
-
=
>
= -
=
(4)
So is b
ijfor term (T
i-T
j) :
. ..., , 2 , 1 , , ),
sgn(
T T i j i j nbij
=
i-
j< = (5)
Then, Zhang-Yaoting correlation index Q could be implemented as:
j n i
n b
Q aij ij ¹
=
å
- , ) 1 (2
(6)
It is obvious that Zhang-Yaoting correlation in- dex Q located in [-1, 1], that close to 1 indicates a significant positive correlation, and -1 for sig- nificant negative correlation.
Zhang correlation index of temperature and electricity load at 24 hours of day are shown as Fig. 4. According to the figure, the electricity load of period from 11 a.m. to 8 p.m. responds to the
temperature variation outstandingly, on the con- trary the load of period before 8 a.m. is not sensi- tive to the temperature variation.
Fig. 4. Zhang correlation index of load and temperature.
3.2 Dimensionality Reduction
According to the temperature sensitivity of elec- tricity load and level of correlation to temperature, we can rank the 24 hours of day. Consequently, temperature insensitive data should be removed.
For the purpose, a new parameter d (d<24) is in- troduced to denote the size of dimension of load data. The parameter d and the number of nearest neighbor k should be determined during training.
3.3 Parameter Determination
As mentioned above, parameter k and d should be determined by the training process. Since k de- notes the number of nearest neighbors, a small k would subject to overfitting, and a large k would pull forecasting accuracy down because it took more dissimilar neighbors into account. Moreover, parameter k is partly depended on how long the term of training data series, especially when the data series are not stationary obviously.
Normally, in our approach, parameter d has no consistent influence on forecasting accuracy
Table 1. Criterion for correlation judgmentP(AB)=P(A)P(B) P(B|A)-P(B)=0 Independent
P(AB)>P(A)P(B) P(B|A)-P(B)>0 Positive correlation
P(AB)<P(A)P(B) P(B|A)-P(B)<0 Negative correlation
clearly. It should be determined in training com- pletely. With our method, keeping accuracy and achieving dimension reduction is possible.
Parameter k and d interact with each other, it will be different from case to case.
3.4 Result
The load time series was collected from New York Independent System Operator [13]. It is of New York city in 2010 to 2016. As a benchmark, Table 2 shows the result of standard k-NN based forecasting. That indicates when k=9 it gets the minimum MAPE 5.372%.
According to our approach, the 24 hours in a day are sorted in ascending order by electricity load sensitivity to temperature effect. In our case, they are sorted as:
5, 4, 3, 1, 2, 6, 7, 24, 9, 8, 23, 21, 10, 22, 20, 11, 12, 13, 19, 14, 15, 16, 18, 17
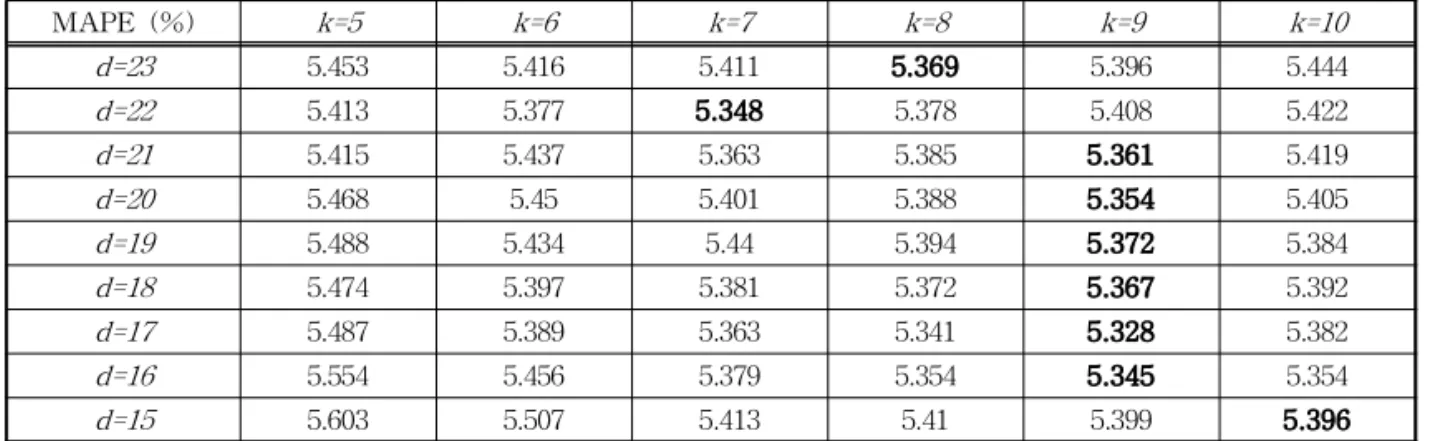
In training, the MAPE under each given param- eter k and d is shown in Table 3. After training, the parameters k and d should be 9 and 17 re- spectively with the proposed method.
So, the final comparison is shown in Table 4, the proposed method reduced the dimension size (parameter d) from 24 to 17, at the same time, the
MAPE dropped slightly.
In conclude, considering sensitivity to temper- ature variation, the proposed method of dimension- ality reduction is effective for k-NN based short- term load forecasting.
Table 4. Result of comparison
Method k-NN method Proposed method Parameter k=9, d=24 k=9,d=17
MAPE(%) 5.372 5.328
4. SUMMARY AND CONCLUSION
The idea of k-NN based short-term load fore- casting is to provide prediction based on selected neighbors. In the paper, we consider the ideal neighbors should close to each other on both date attribute and weather condition. Meanwhile, di- mensionality reduction is always main concern in k-NN based method. Therefore, we propose a new idea for dimensionality reduction which is follow- ing the principles of highlighting the temperature effect on electricity load variation. The proposed method contributes to select appropriate neighbors out, in the same time, it achieves dimensionality reduction well. Compared to standard k-NN based
Table 2. MAPE with k-NN based method (d=24)k-NN method k=5 k=6 k=7 k=8 k=9 k=10
MAPE (%) 5.427 5.431 5.387 5.393 5.372 5.424
Table 3. MAPE under each given k and d pair
MAPE (%) k=5 k=6 k=7 k=8 k=9 k=10
d=23 5.453 5.416 5.411 5.369 5.396 5.444
d=22 5.413 5.377 5.348 5.378 5.408 5.422
d=21 5.415 5.437 5.363 5.385 5.361 5.419
d=20 5.468 5.45 5.401 5.388 5.354 5.405
d=19 5.488 5.434 5.44 5.394 5.372 5.384
d=18 5.474 5.397 5.381 5.372 5.367 5.392
d=17 5.487 5.389 5.363 5.341 5.328 5.382
d=16 5.554 5.456 5.379 5.354 5.345 5.354
d=15 5.603 5.507 5.413 5.41 5.399 5.396
forecasting on hourly load data series, our ap- proach can reduce dimension of hourly load data series by about 30%, and does not degrade the ac- curacy of the method.
REFERENCE
[ 1 ] N. Mohamed, M.H. Ahmad, Z. Ismail, and Suhartono, "Double Seasonal ARIMA Model for Forecasting Load Demand," MATEMA- TIKA, Vol. 26, No. 2, pp. 217-231, 2010.
[ 2 ] C.M. LEE and C.N. Ko, "Short-term Load Forecasting Using Lifting Scheme and ARIMA Models,” Expert Systems with Applications: An International J ournal ar- chive, Vol. 38, No. 5, pp. 5902-5911, 2011.
[ 3 ] H.S. Migon and L.C. Alves, "Multivariate Dynamic Regression: Modeling and Forecast- ing for Intraday Electricity Load," Applied Stochastic Models in Business and Industry, Vol. 29, No. 6, pp. 579-598, 2013.
[ 4 ] A. Goia, C. May, and G. Fusai, "Functional Clustering and Linear Regression for Peak Load Forecasting," International Journal of Forecasting, Vol. 26, No. 4, pp. 700-711, 2010.
[ 5 ] P.S. Kalekar, “Time Series Forecasting Using Holt-Winters Exponential Smoothing,” Kanwal Rekhi School of Information Technology 4329008, pp. 1-13, 2004.
[ 6 ] J.W. Taylor, "Short-Term Load Forecasting with Exponentially Weighted Methods," IEEE Transactions on Power Systems, Vol. 27, No.
1, pp. 458-464, 2012.
[ 7 ] B.G. Koo, M.S. Kim, K.H. Kim, H.T. Lee, J.H.
Park, and C.H. Kim, "Short-term Electric Load Forecasting Using Data Mining Technique,"
Proceeding of Intelligent Systems and Con- trol, 2013 7th International Conference on IEEE, pp. 153-157, 2013.
[ 8 ] A. Sasu, "k-Nearest Neighbor Algorithm for Univariate Time Series Prediction," Bulletin of the Transilvania University of Brasov, Vol.
5, No. 54, pp. 147-152, 2012.
[ 9 ] F.H. Al-Qahtani and S.F. Crone, "Multivar- iate k-Nearest Neighbor Regression for Time Series Data—A Novel Algorithm for Fore- casting UK Electricity Demand," Proceeding of The 2013 International Joint Conference on IEEE Neural Networks, pp. 1-8, 2013.
[10] S.H. Jung, “A Study on Data Classification of Raman OIM Hyperspectral Bone Data,”
J ournal of Multimedia Society, Vol. 14, No.
8, pp. 1010-1019, 2011.
[11] M.S. Kang, The Study of Load Characteristics in Taipower and Its Effect on Power System Operation, Ph. D. Thesis, National Sun Yat- Sen University, Kaohsiung, Taiwan, ROC, 2001.
[12] H.P. Zhang, Y.T. Zhang, and J. Huang, Development of Modern Statistics and Related Topics, World Scientific, 2003.
[13] The New York Independent System Operator,
http://www.nyiso.com, (accessed Jan. 13, 2017).
FaZheng Chu
He received the B.S. and M.S.
degrees in Economics from Qingdao University, China in 1999 and 2004 respectively. He is a lecturer in Economics and Management College of Qingdao Agricultural University, China since 2004. He received the Ph. D. degree in Computer Engineering from Department of Computer Engineer- ing, Changwon National University in August, 2017.
His research interests include econometric modelling and forecasting, and image processing.
Sung-Hwan Jung
He received the B.S., M.S., and Ph. D. degrees in Electronic Engineering (information and communication major) from Kyungpook National University, Korea in 1979, 1983, and 1988, respectively. He had worked for the Electronic and Telecommunication Research Institute in Korea as a research staff, where he had experienced some national research projects including developing a portable computer. In 1988, he joined the faculty of Department of Computer Engineering at Changwon National University in Korea, where he is currently working as a full professor.
From 1992 to 1994, he was a postdoctoral research staff of the Department of Electrical and Computer Engineering at the University of California at Santa Barbara (UCSB). From 1999 to 2000, he also worked for the Colorado School of Mine (CSM) in Golden, Colorado as an exchange professor. From 2008 to 2009, he had experience on the medical information process- ing at the Dental School of the University of Missouri at Kansas City (UMKC), as a visiting professor. He is an Information System Auditor and P.E. in the area of Information Processing and Electronic Computer.
His research interests include content-based image retrieval, steganography, watermarking, medical im- age processing, computer vision and pattern recog- nition, etc. He is a co-author of nine image processing related books including “Visual C++ Digital Image Processing Using Open Source CxImage,” “Practical Computer Vision Programming Using VC++ and Open CV,” and Image Processing and Its Application with OpenCV.”
![Fig. 1. Daily electricity load profile of day-of-week [New York].](https://thumb-ap.123doks.com/thumbv2/123dokinfo/4762408.516770/2.892.465.800.142.383/fig-daily-electricity-load-profile-week-new-york.webp)
![Fig. 3. Temperature sensitivity of electricity load [Taiwan].](https://thumb-ap.123doks.com/thumbv2/123dokinfo/4762408.516770/3.892.94.428.138.394/fig-temperature-sensitivity-of-electricity-load-taiwan.webp)