Vol. 19, No. 12 pp. 332-339, 2018
Apartment Framework Design using Data
Jang-Soon Choi
School of Architecture, Architectural Engineering and Civil Engineering, Kangwon National University
데이터를 활용한 공동주택 프레임워크 디자인
최장순
강원대학교 건설융합부 건축학전공
Abstract This research explains a new process in architecture frameworks. A complete analysis on implementation of the specific frameworks can be conducted by a special system. Moreover, the system can be installed anywhere, and it produces a unique result, which is customized based on the contents of architectural designs by users. Before using the system, an architect should think about the design and the process of constructing frameworks because a computer sometimes computes misleading results although the architect describes architectural structures, which the designer wants. If the architect inputs the same process into the computer, and the result of frameworks changes, it is not a proper architectural design. Hence, a tool, which precisely treats data, is needed. Therefore, when constructing the proper architecture, a new paradigm of architecture should be used to distinguish the issues of discussion by using various data. Also, based on this information, an apartment housing complex design, related to possible parameters, which can be expressed by combining various fusion tables and geocloud, and architectural designs, is proposed.
요 약 본 연구는 새로운 건축 설계 과정을 설명하는데 있어 특정한 시스템을 이용해서 건축 프레임워크에 대한 수행을 분석하는 것이 가능하다. 또한, 이러한 시스템은 컴퓨터가 설치되어있고 인터넷망이 구축되어 있으면 장소에 구애받지 않은 채로 가동이 가능하며, 사용자가 컴퓨터에 입력한 내용을 기반으로 한 독특한 프레임워크 결과물을 산출해 낼 수 있다. 이러 한 시스템을 사용하기 전에, 건축가가 설계를 제대로 했을지라도, 컴퓨터가 잘못 인식할 수도 있으므로 건축 설계자는 원하는 결과를 얻을 수 있도록 사전에 건축 디자인과 설계 과정을 생각해야 한다. 그런데 같은 과정을 입력했는데도 불구하고 건축 계획의 프레임워크 결과가 달라진다면, 그것은 제대로 된 건축 설계라고 볼 수 없다. 그러므로 정확하게 데이터 처리를 할 수 있는 도구가 건축 디자인과 설계를 함에 있어서 필요하다. 따라서 건축을 설계할 때, 건축의 새로운 패러다임으로 각종 데이터를 활용하여 논의의 사안을 찾아 구별해야 한다. 또한 이것을 바탕으로 다양한 정보융합과 공간클라우드를 접목하여 나타낼 수 있는 파라미터정보와 건축디자인을 연관시킨 공동주택계획안을 제시하였다.
Keywords : Data, Users, Contents, Form, Framework, Architecture
This study was supported by 2017 Research Grant from Kangwon National University(No. 620170008).
*Corresponding Author : Jang Soon Choi(Kangwon National Univ.) Tel: +82-33-570-6597 email: [email protected]
Received September 4, 2018 Revised (1st October 11, 2018, 2nd November 6, 2018) Accepted December 7, 2018 Published December 31, 2018
1. Introduction
1.1 A new form of architecture
A new paradigm of architecture and the development of architectural forms are needed because the previous paradigm has pursued Post Modernism
styles, and many architects have sought for
architectural appearance, not internal functionality of
buildings. However, stellar performance and absolute
accuracy take priority in the state-of-the-art trend of
architecture unlike the former architecture trend, which
has followed the superficial facade of Post Modernism.
By this, architects serve their users well, and tries to exactly indicate the issues and demands of user.
Because stellar performance based on architecture designs has not be a fresh concept, it can never be applied to some methods before, but the computer programs in architecture, related to architectural design process, are steadily changing. They are useful to design only an essential portion of buildings and provides improved results of architecture forms.
Since it is difficult for users to suddenly utilize computer-aided tools in specific cases or at the end of the process of the architectural design, there has been a gap between those who use the tools and the potential creating more accurate and performative architectural designs until now. This potential is what this project strives to explore and how architects can produce a more accurate and performative architecture design. These answers are described in the data, which is accessible to the public. As users' needs are firmly understood, the higher quality of architectural design products can be made. So this study is ranged and analysed according to five chapters: firstly a new form of architecture and introduction to data as introduction, secondly a new process and discussing issues as a new architecture process, thirdly fusion tables and geocloud as creating solutions, fourthly possible parameters and specific to architecture as designing architectural frameworks, lastly conclusion.
Fig. 1. Graphic showing how much data is accumulated and used through major portal site.
1.2 Introduction of data
By expanding the influence on websites, better data can be achieved[1]. All details of properties can be gathered within terrain data, census data, economic statistic data, human opinion data, and even statistic crime data against humanity about all the countries on earth. Information about people’s daily life and variable pictorial images can be easily obtained anywhere. Every intimate information in minute detail of hundreds of millions of peoples everyday lives is now to be obtainable by computer approaching. Also, statistic data, which shows what people are thinking about government policies and other key issues, is readily available. Therefore, it is necessary for people to consider how to effectively use data from the diverse websites. The objective of this study is to explain a new process in architecture frameworks.
2. A new architecture process
2.1 A new process
In terms of architecture, architects build a wall around themselves. A past process depended less on the users of the building and relied more on the individual architect’s aesthetic sense, or the user’s artistic sense with opinions elicited from experts.(Fig.
2) In the past, architects gathered site analysis data, user input, and other information on the architecture.
Moreover, they accepted them to produce a concept or an approach. Out of this, the architectural form is derived. So the procedure for generating architectural form was often referred to as the “architect as god”
mentality.
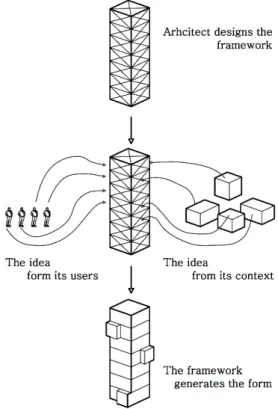
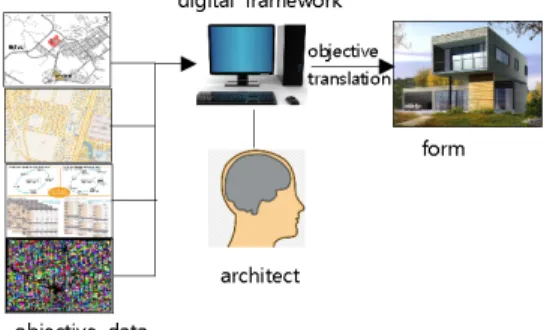
Conversely, a new process that creates forms driven
by their users and various contexts is needed. Nowadays,
architect in this process designs a framework to
generate a form with parameters, which are analysis
data, user input, or other parameters.(Fig. 3) These can
be connected to produce a design output. Rather than
formal buildings from their makers, architects try to
Fig. 2. Flow diagram of generating a subjectively translated form by the past architect
Fig. 3. Flow diagram of generating a objectively translated form by the current architect
find answers to develop the form founded on enormous data resources. The data resources are a great window into the world of the human being and show us more than we could ever want to know general information about humans. By using these data resources, architectural forms can parlay the data into building elements. This procedure provides architectural forms that are based on their users rather than architects.
Therefore, the goal of this work is to seek a more accurate architecture form.
“Within contemporary architecture design, a significant shift of emphasis can be detected - a move away from an architecture based on purely visual concerns towards an architecture justified by its performance. Structural, constructional, economic, environmental and other parameters that were once secondary concerns have become primary – are now being embraced as positive inputs within the design process from the outset.”[2]
2.2 Discussing issues
The computational design strategist argues that we have to surpass mere data collection and technical optimisation and open up new ways of thinking with the creative use of soft data.[3] The question becomes how people identify issues. It is easy to say the architecture motivated by data but how does one really produce architectural form based on various values.
There are some problems with this line of thought, and lie in the enforcement of this type of strategy. The largest probably being is how we actually use the data.
The answer is through the establishment of a framework that uses values to drive specific parameters of building elements. The data strategically needs a universal format that can be attached and used without difficulties in the general practices. There are two step processes in data treatments. The first step is that all data types without exception are converted into one format under any circumstances. The seconde step is that the resulting format is connected to computer software to be given the ability to create architectural forms.
3. Creating Solutions
3.1 Fusion tables
Fusion tables on the world wide web are kinds of online database programs because of their geo-spatial informations. That is, these can be used for gathering, visualizing, and sharing data tables. Data are stored in multiple tables that internet users can view and download[5].
This provides the spatial analysis of objects, and a way to search information based on a specific location.
It is specially useful when it comes to the architecture because architects can use full information about their surrounding users and a project’s contexts.
This database program allows various different
formats to be changed including SHP files(GIS
Information)[6], CSV files(Spreadsheets)[7], and KML
files(Geometry)[8]. This practice is the goal of getting data by integrating usable formats.
Fig. 4. Data Source of economically active population survey[4]
28.41% 25.01% 21.66% 20.12% 4.72%
Fig. 5. Data element of the family size[4]
Fig. 6. Data element of aging population[4]
3.2 Geocloud
Geocloud is a way of this study was needed to get information from the database application programs and system softwares to produce forms.(Fig. 8) Its feature is composed with a powerful and scalable worldwide cloud based computer infrastructure for mapping organizations, and collaboration point is a meeting point for collaboration between geoinformation software developers, data providers and mapping
organizations worldwide.[10] But this library technique allows users to connect up data tables and search data based on spots, valuations, and other forms of real-time queries. This fulfills the necessity for a direct connection from data to the form. This procedure eliminates any obstructions effectually between the raw data and context that provided by the Internet and the architectural forms that are made from the data. The issue out of this thought is how people join data into forms. This is that the line is drawn between traditional architecture practice and this method. It permits the architect effectually as the framework designer instead of form designer. Since the forms are propelled by the data, the architect is left the framework designer who is decided by the various values plugged in, not the final form.
Fig. 7. Example of geocloud[9]
4. Designing Architectural Frameworks
4.1 Possible Parameters
Today cities can be grown in digital laboratories
and, by imposing realistic constraints on their form
begin to breed good design that emerge from continual
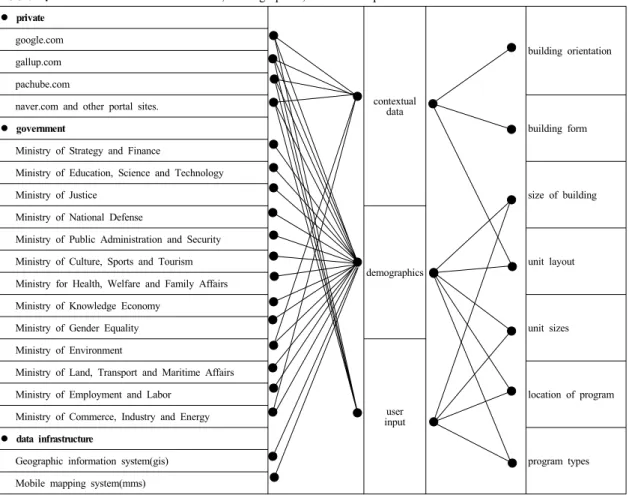
Table 1. The relation of contextual data, demographics, and user input
z privatecontextual data
building orientation google.com
gallup.com pachube.com
naver.com and other portal sites.
building form z government
Ministry of Strategy and Finance
Ministry of Education, Science and Technology
size of building Ministry of Justice
Ministry of National Defense
demographics Ministry of Public Administration and Security
unit layout Ministry of Culture, Sports and Tourism
Ministry for Health, Welfare and Family Affairs Ministry of Knowledge Economy
unit sizes Ministry of Gender Equality
Ministry of Environment
user input Ministry of Land, Transport and Maritime Affairs
location of program Ministry of Employment and Labor
Ministry of Commerce, Industry and Energy z data infrastructure
program types Geographic information system(gis)
Mobile mapping system(mms)
feedbacks.[11] For this reason framework is composed of many parameters. These parameters can be given various values, and based on those values they can fulfill some action. Thus, focusing on utilizing definite data sources is the main point to drive specific components of buildings.
The next page table shows many different data sources, which are related to one of three universal categories including contextual data, demographics, and user input.(Table. 1) These categories can be applied to diverse ways to construct buildings. For instance, contextual data may be used to drive the universal form of a building depending on how it is wrapped, projected or twisted around objects in its internal constitution. Demographics may be used to enlighten the unit types or the unit layouts within the building.
It can also propel the program types, building sizes and other factors such as vertical height, stories, the building area, and the floor ratio.
4.2 Specific to Architecture
An analogy with the specificity to architecture matches a car. Most cars are equipped with basic unchanging factors consisting of frame, engine, power train, steering, wheel and brake, and suspension.(Fig. 8)
They also have a specific limited size depending on the regulation for car types. All of these factors could be regarded as a framework. The framework can be altered in case of maintaining these basic elements.
Cars are manufactured according to market demands
and users' needs. Hence, the form and shape of the cars
can quite vary on the condition that the basic
framework remains unaltered.
Engine
Steering
Power train Frame
Suspension
Wheel
& Brake
Fig. 8. All cars have a basic frameworks such as frame, engine, power train, steering, wheel & brake and suspension.
This is the same as the concept or principle of architecture framework. Architects design the basic framework and configurations for the building. Then, the form of the building is propelled by users and its context.
The obvious difference between cars and architecture also makes the debate for this type of process. And that is the reason why buildings are much more complicated than cars.
While their parts may be more complicated, there are many more variables when it becomes a general building. Human intuition can handle much and this, no one can argue, does a very fine job. The goal is not to get a computer to draw and design a whole building.
Rather, the goal is to use CAD(Computer-aided design) with adroitness in the architecture processes. Getting answers to quantitative problems is one of its strong points, where as lifestyle and feeling is not. This organizes a team composed of architects and computers and allows the architects to lay out a framework using intuitive power and then fill in with form using computer.
4.3 Framework Implementation
The associative design systems can control local dynamic information flows through interactive systems, spaces and interfaces.[12] Downtown Gangneung presents a sole challenge for this special process, in
Fig. 9. The general framework can be applied to a site to formulate an architectural design based on its users and context
Fig. 10. Site location data
that the complexities of regional characteristics, circulation flow of human and car traffic, diverse age groups, and other various parameters are boundless.
Therefore, these factors must be analysed to include diversely relevant information. They could be regarded as parts of the framework, which determines to make the form.
This residential area is rapidly expanded. By using
the historic growth, family size, aging population data
in the city, and statistical projection algorithms, architects
Fig. 11. The early floor plan module process for the framework
Fig. 12. The early floor plan for the framework
Fig. 13. The early elevation plan for the framework
Fig. 14. The final floor plans & block types
Fig. 15. The final layout Fig. 16. The final section
Fig. 17. The final elevation
Fig. 18. The final bird’s eye view
can plan what the demand will be in the next five years. Consequently, more residential units and apartment complexes are needed to have a better program for this site. Also, services for 10,000 residents who lives near Gangneung are needed according to situational awareness data link.
The lower levels of the apartments are composed of 2 floor levels that is actually below grade, so naturally it provides public services for its residents. Car entry from the west, east and north side in the site brings users down into the underground parking lot(Fig.16).
The underground parking spots are offered free without cost. And every housing is also to offered 1.5 parking stall per unit.
The first floor level is the level where most residents enter apartment. This level consists of egresses, stair cases, lobby, elevator hall, mail box and other facilities. Through this public entrance, residents come into the formal lobby of the apartment, and can get on the elevators to go up to their units. Near the elevators, they encounter with mail box where all residents can pick up their mail, and a bicycle storage place where all residents can store their bicycles.
The typical residential floors(Fig.14) are made up of three different unit types, which are one family unit, two or three family unit, and four or more family unit.
Each floor has 3 block types in rotation. Each housing unit contains a utility module for electrical cable and plumbing which does not move. This creates a vertical stack for easy transportation of utilities and conditioning. Moreover each unit has a bathroom located within this unit module which also does not move.
5. Conclusion
This research explains a new process in architecture
frameworks. A complete analysis on implementation of
the specific frameworks can be conducted by a special
system. Moreover, the system can be installed
anywhere, and it produces a unique result, which is customized based on the contents of architectural designs by users. Before using the system, an architect should think about the design and the process of constructing frameworks because a computer sometimes computes misleading results although the architect describes architectural structures, which the designer wants.
If the architect inputs the same process into the computer, and the result of frameworks changes, it is not a proper architectural design. Hence, a tool, which precisely treats data, is needed. Therefore, when constructing the proper architecture, a new paradigm of architecture should be used to distinguish the issues of discussion by using various data. Also, based on this information, an apartment housing complex design, related to possible parameters, which can be expressed by combining various fusion tables and geocloud, and architectural designs, is proposed.
References
[1] Chris Anderson, “The End of Theory: The Data Deluge Makes Scientific Method Obsolete”, Wired Magazine, June, 2011. (Internet Link: http://www.wired.com/
science/discoveres/magazine/16-07/pb_theory)
[2] Neil Leach, “Digital Morphogenesis”, Architectural Design Theoretical Meltdown, Vol 79 No 3, pp.32~37, Jan, 2009.
DOI: https://doi.org/10.1002/ad.806
[3] Cynthia Ottchen, “The Future of Information Modelling and the End of Theory: Less is Limitted, More is Different, Architectural Design, Vol 79, No 2, p.22~27, March, 2009.
DOI: https://doi.org/10.1002/ad.845
[4] KOSIS, c2018[cited 2018, June, 15], Available from:
http://kosis.kr/search/search.do, Statistics Korea, June, 2018.
[5] Wikipedia. Google Fusion Tables[Internet]. Wikipedia, c2018[cited 2018 September 20], Available from:
https://en.wikipedia.org/wiki/Google_Fusion_Tables, (accessed Sept, 20. 2018)
[6] File extensions[Internet], File-extensuins.org c2018[cited 2018 October 18]. Available from: https://www.
file-extensions.org/shp-file-extension, (accessed Sept, 20.
2018)
[7] CSV Format-CSV Reader[Internet], CSV Reader.com c2018[cited 2018 September 15]. Available from:
https://www.csvreader.com/csv_format.php
[8] Google Earth[Internet], Google Earth/KML Files-USGS Earthquake Hazards Program, c2018[cited 2018 September 16]. Available from: https://earthquake.usgs.
gov/learn/kml.php
[9] Zachary Steven Soflin, Data Driven Architecture, University of Nebrasca-Lincoln M.Arch, p.11, 2012 [10] GeoCloud[Internet], c2018[cited 2018 July 10].
Available from: https://www.geocloud.work
[11] Michael Batty, “A Digital Breeder for Designing Cities”, Architectural Design, Vol 79, No 4, pp.45~49, June, 2009
DOI: https://doi.org/10.1002/ad.916
[12] Tom Verebes, “Experiments in Associative Urbanism”, Architectural Design, Vol 79 No 4, pp.24~33, June, 2009
DOI: https://doi.org/10.1002/ad.913
Jang-Soon Choi
[Regular member]•Feb. 1983 : Univ. of Seoul, BD
•Feb. 1992 : Univ. of Seoul, MD
•Feb. 2001 : Univ. of Seoul, PhD
•Sep. 2001 ∼ current : Kangwon National Univ., School of Architecture, Architectural Engineering and Civil Engineering, Professor
<Research Interests>
Architecture Design, Architecture History
![Fig. 4. Data Source of economically active population survey[4]](https://thumb-ap.123doks.com/thumbv2/123dokinfo/5122932.578370/4.799.87.387.185.618/fig-data-source-economically-active-population-survey.webp)