DOI : http://dx.doi.org/10.5394/KINPR.2016.40.5.337
Trading Strategies in Bulk Shipping: the Application of Artificial Neural Networks
Hee-Sung Yun*․Sang-Seop Lim**․†Ki-Hwan Lee
* Interocean MS Ltd., Seoul 04541, Korea
** Graduate School of Korea Maritime and Ocean University, Busan 49112, Korea
†Division of Shipping Management, Korea Maritime and Ocean University, Busan 49112, Korea
Abstract: The core decisions of bulk shipping businesses can be summarized as the timing and the choice of period for which carrying capacity is traded. In particular, frequent decisions to trade freight either with repeated spot transactions or with a one-off long-term deal critically impact business performance. Even though a variety of freight trading strategies can be employed to facilitate the decisions, chartering practitioners have not been active in utilizing these strategies, and academic research has rarely proposed applicable solutions.
The specific properties of freight as a tradable commodity are not properly reflected in existing studies, and limitations have been reported in their application to the real world. This research focused on the establishment of applicable freight trading strategies by taking into account two properties of freight: time perishability and term-dependant pricing. In addition to traditional trading strategies, artificial neural networks were applied for the first time to the test of freight trading strategies. The performances of the trading strategies were measured and compared to produce a remarkable outperformance of the ANN. This research is expected to make a significant contribution to chartering practices by enhancing the quality of chartering decisions and eventually enabling the effective management of freight rate risk. In addition to methodological expansion, the result will propose a way to approach the controversial issue of freight market efficiency.
Key words: trading strategy, artificial neural networks, efficient market hypothesis
* First Author : [email protected] 070)8286-8431
** [email protected] 051)405-4426
†Corresponding author : [email protected] 051)410-4387
1. Introduction
The shipping industry is facing unprecedented difficulties.
The crisis can be explained by many different factors such as wrong investment decisions, mass psychology and even the undesirable interaction between physical and paper markets. In bulk shipping, one of the plausible reasons is the failure in trading decisions, which means the players fail to materialize the simple rule of 'buying low, selling high'. This research focuses on the analysis of trading strategies under the configuration that the shipping business is a process of profit generation through the trading of freight, which is otherwise expressed as 'carrying capacity'.
In shipping, trading has a wide range of contractual forms. The purchase of freight includes newbuilding contracts, sale and purchase (S&P) agreements, bareboat charters, time charters (TCs) and trip time charters (TCTs). The sales of freight encompass contracts of affreightment, voyage charters and time charter-outs.
Trading can also be carried out in the form of freight derivatives, which include forward freight agreements and freight options.
Trading strategy is a strategy employed to generate excess profit over market profit using predetermined trading rules, which are used in selecting the transaction timing or deciding the long/short position. Trading strategies can be based either on technical analysis or on fundamental analysis. Technical analysis has the purpose of forecasting the price of asset utilizing market actions, i.e.
price, volume and open interests. Fundamental analysis uses comprehensive internal and external information to find out the intrinsic value of assets (Fama, 1965).
Trading strategies use a variety of techniques, and multiple techniques are often combined. Hence, the classification of strategies becomes a challenging task.
Table 1 summarizes common rules employed in financial
and commodity markets.
Judgement-based
Chart analysis
ž
Trend linesž
Head and shouldersž
Triangle patternsž
Support and resistanceMath-based
Moving average rules
ž
MACDž
Stochastic oscillators Filter rulesž
Simple percentage filterž
MA envelopesž
Bollinger Bands Momentum trading rulesž
RSI Other rulesž
Relative value indexTable 1 Technical trading rules
Source: Shipping Derivatives and Risk Management, Alizadeh and Nomikos, 2009 (elaborated by authors)
The performance of trading strategies is closely related to the efficient market hypothesis (EMH). The EMH, developed by Fama (1970, 1991), argues that assets are always traded at their fair value and that it is impossible to consistently outperform the market through asset selection or market timing. The EMH has three different forms: a weak form, a semi-strong form and a strong form. In weak-form efficiency, excess returns cannot be achieved in the long run by employing trading strategies that analyze historical asset prices or other historical data. In semi-strong-form efficiency, all the information which is open to the public is instantly reflected to the asset prices so that no excess profit is made by trading on the information. Strong-form-efficiency assumes that, in addition to semi-strong-form efficiency, all information, including private information, is already reflected in the asset price and that no one can consistently beat the market.
Regardless of the business fields, the aim of traders is to make excess returns by utilizing all the available information. Therefore, various trading strategies are applied in the financial and commodity areas. In the practice of shipping, the application of trading strategies is not as popular as in other areas. A series of research, however, has been carried out.
Adland and Koekebakker (2004) tested whether the EMH holds by applying popular technical trading rules to the second-hand market for bulk ships. Adland and Strandenes (2006) showed that the trading strategy based on kernel smoothing far outweighs the naive strategy from the ship operators' perspectives in deciding whether to buy or sell period charters.
Although they confirmed the validity of the EMH, their results vary depending on the variables and strategies. In an attempt to overcome the limitation of the above studies,
Alizadeh and Nomikos (2006, 2007) tried to apply fundamental indicators based on economic theory to the trading strategies and tested their statistical significance in dry and wet bulk ships.
The previous studies are mostly on trading strategies in freight derivatives or S&P markets, which are structurally simpler than physical chartering markets in the sense that outright sales and purchases are possible. Therefore, the research outcomes have limitations in their direct application to real world freight trading problems. The direct adoption of financial trading rules can even confuse chartering practitioners. This research aims to enhance the applicability of trading rules by defining the problems, taking into account the specific properties of freight.
Artificial Neural Networks (ANN), a robust relationship mapping tool, are applied to our study. The applicability and the validity of the ANN have been demonstrated in forecasting, discrimination and pattern recognition.
Even though there are ample cases of employing trading strategies in the financial and commodity markets, the application of the ANN to trading strategies is rare. In the shipping domain, the ANN was employed to forecast port traffic volume (Shin and Jeong, 2008, Shin et al., 2011) and Suez canal traffic (Mostafa, 2004). In both cases, the ANN exhibited effectiveness in forecasting. The application of ANN to the freight trading strategy is a novel attempt.
The outcome of this research has an additional function of testing the EMH. This research is expected to make a significant contribution to market practices by enhancing the effectiveness of chartering decisions, and eventually prevent a repetition of the shipping crisis.
This paper is organized as follows. Chapter 2 covers data and models, including trading strategies and artificial neural networks (ANN). Chapter 3 displays the results. The last chapter interprets the results and draws conclusions.
2. Data and models
2.1 Data
The freight series used in this analysis is from the
Shipping Intelligence Network database of Clarkson
Research. The Panamax market was selected for the
analysis and the research period is over 14 years from
March 2001 to September 2015. The data frequency is
weekly.
2.2 Exploratory data analysis
As a process to select the input variables of the trading rules and the ANN model, an exploratory data analysis (EDA) was carried out.
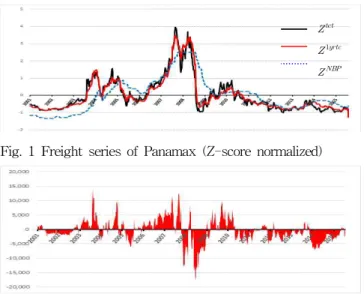
Fig. 1 Freight series of Panamax (Z-score normalized)
Fig. 2 Term spread(
)
Fig. 1 shows the combined graph of TCT rates, 1-year TC rates and newbuilding prices in the Panamax segment.
The data was normalized with Z-score. The TCT series displays the most frequent oscillation while the newbuilding price has the slowest trace. Fig. 2 reveals the gap between TCT rates and 1-year TC rates. The difference mostly coincides with the cycle of the market and shows a potential as a useful trading signal. The long-term correlation (coefficient 0.976) and a sizable short-term deviation are considered to be a sound basis for spread trading (Alizadeh and Nomikos, 2009).
Fig. 3 Statistics for Panamax 1-year T/C rates
Fig. 4 Statistics for Panamax TCT rates
Fig. 3 and 4 display descriptive statistics for the TCT rates and 1-year TC rates. The standard deviation is greater on the TCT rates than on the 1-year TC rates, whereas the means are almost at the same level. Both series are heavily positively skewed and lepto-kurtic, revealing non-normality, which is confirmed by the large Jarque-Bera 1) statistic.
2.3 Trading strategies
The shipping service has unique properties that prevent common trading rules from being adopted. The first property is time-perishability. Carrying capacity is measured by the product of time and space. The value of the carrying capacity perishes as time elapses. For example, a vessel delivered on 1 January loses a quarter of her value on 1 April. The problem is not just the loss of value but the change of product identity.
The identity change is due to term-dependent pricing.
This means the pricing of the carrying capacity varies depending on the trading period. Selling a 1-year-chartered Panamax for 6 months after 6 months is quite different from selling stocks after 6 months of the retaining period because a 6-month TC rate is applied when the vessel is chartered-out, while a 1-year TC rate was applied when chartered-in.
The third property is exposure to operating performances.
The carrying cost of stocks or commodities is confined to capital expenses and/or low storage expenses. In the case of vessels, the burden of operating expenses is rather heavy. Therefore, retaining the vessels before sales without employment is not a realistic decision alternative.
The above properties need to be considered before trading rules are established in the field of shipping. The purpose of setting up trading strategies is either to pick the right timing for trade or to decide whether to go short or long. Term-dependent pricing in shipping leads to the third purpose of selecting terms (periods). In reality, the moving-average-based timing rules listed in Table 1 cannot be applied to ship chartering because the MA-based purchase timing is not associated with a specific retention period, while the actual physical purchase of carrying capacity is inevitably made for a pre-determined charter period. In addition, time perishability works to change the nature of the shipping commodity in terms of pricing.
In this research, the properties of freight as a tradable
1) Jarque-Bera =
×
, N: number of observations, s: skewness, k: kurtosis
commodity were considered and the following assumptions were established.
Ÿ The player has a Panamax bulk carrier with a daily cost of US $12,000.
Ÿ The purpose of the trading strategy is term selection, and the decision alternatives are a 1-year time-charter-out or repetitive TCT-outs for a 1-year evaluation period.
Ÿ The revenue from the repetitive TCT-outs is a cumulative daily return. This means that the daily return from the actual TCT contracts is deemed to be identical to the average of daily TCT rates.
The term selection strategies were established as follows.
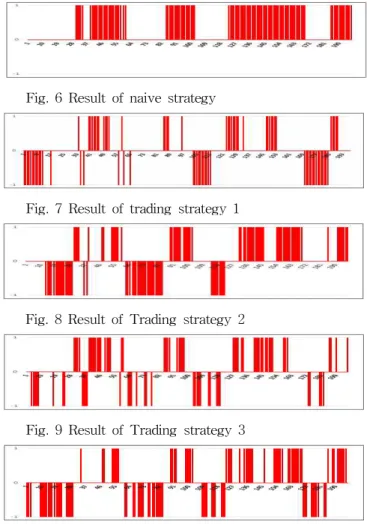
1) Naïve strategy: This is a benchmark 'buy-and-hold' strategy. The vessel is open to spot market changes without the application of any trading strategies. The return is expressed in formula (1).
· (1) where w is the number of weeks in a year, C is the cost of operation, and d is the number of days in a week.
2) Term-spread strategy: The volatility gap between short-term rates and long-term rates is exploited. If the ‘buying low, selling high’ principle is applied, long-term sales at the peak of the market is a rational choice. In this research, however, the term alternative to the spot is just 1 year, and the principle may not hold for the relatively short future.
Hence, the rules are applied bi-directionally.
TS1
i f
·
·
TS2
i f
·
·
where y is the number of days in a year.
3) Moving average strategy: The MA strategy is normally used for timing, but here it is adopted for term selection. A simple MA gap, i.e. the difference between a fast MA and a slow MA, contains less information than an MA cross-over. Therefore, the performance was investigated bi-directionally.
TS3
i f
·
·
TS4
i f
·
·
2.4 Artificial neural networks
The ANN is one of the machine-learning tools inspired by the study of the human central neural system. The
strength of the ANN is that it does not require assumptions about statistical distributions (Smith and Gupta, 2000) and often performs better than other methods (Kaastra and Boyd, 1996). Its application is expanding to the fields of economy, finance and marketing for forecasting and discrimination. According to research (Wong et al., 1997), about 95% of business problems applied multilayered feedforward neural networks with the back-propagation learning rule.
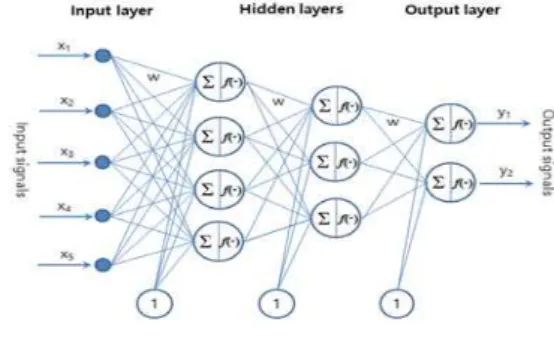
Fig. 5 Structure of multilayered feedforward neural networks
Neural networks consist of an input layer, hidden layers and an output layer. An input vector, multiplied by corresponding weights, is fed to the next layer. The next layer transforms the vector by applying a transfer function.
There are various types of transfer functions: the step function, the sigmoid function, the hyperbolic tangent function and the linear function, to name a few. Formula (2) expresses the output value using one of the most common types of transfer functions, the sigmoid activation function
·
exp
.
(2) where
input output weight between layers
bias · transfer function
The input features of the networks are based on trading strategies. The price level data has a wide value range and it can influence the learning efficiency of the model.
Normalization processes were employed to enhance the learning performance. The normalization methods used are the min-max normalization and the Z-score normalization, which are mathematically shown as
′
max
min
× max
min
min
min
,
′