Introduction
Rural Development Administration conducted the detailed soil survey with scale of 1 to 5,000 across all of the country of south Korea from 1980 to 1999 by concentrated efforts of soil survey group for computerization and soil interpretation fields (Jung et al., 2001). Though contribution of their efforts since soil survey has been conducted (Soil Survey Staff, 1999;
NIAST, 1973), little contribution were published on actual application of soil survey results for individual watershed base in the field of environment due to limitation of soil interpretation methodology. In the past, soil survey staffs conducted the interpretation by parcel and soil series, while nowadays interpretation by basin for conservation of water quality or management of water resources from agricultural non-point pollutants is necessary. The classification of drainage basin in this country is different among ministries and administration, because the needs and standards differ by objectives.
Though inflow and outflow of water associated with rainfall occur through the soils, soil characteristics were not considered in present basin groupings except
hydrological approximate. Accordingly, in order to manage agriculture, water quality, and water resources, systematic classification that contains soil characteristics of unit basin is necessary. In this study, we conducted the classification by using statistical methods on the Youngsangang Basin, which is one of the four great basins in Korea. The objective of this study was to suggest a statistical method as a classification method for effective management of Korean soils.
Materials and Methods
Soil and geographical characteristics of the unit basin of the Yeongsan-River Basin were extracted from the standard basin map (Ministry of Construction &
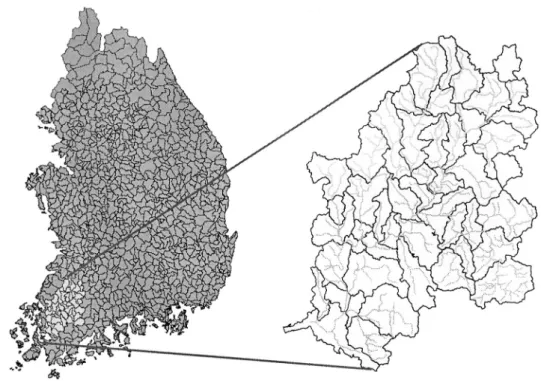
Transportation, 2004). Fig. 1 shows the unit basins in the Yeongsangang Basin. Classification of the unit basin was based on similarity of geography, geology, and pedology.
Soil characteristics using computerized soil survey results that conducted with a scale of 1:25,000 by NIAST (National Institute of Agricultural Science & Technology) were used. Topographic map, basin map, water course map were used in these classification. The major characteristics used in this classification were sinuosity (real length of river / straight line of river), ratio of forest (area of mountain + hill / area of unit basin × 100), ratio
Received : 3 May 2007 Accepted : 30 May 2007*Corresponding author: Phone : +82312900298, E-mail : [email protected]
Morphological Classification of Unit Basin based on Soil &
Geo-morphological Characteristics in the Yeongsangang Basin
Yeon-Kyu Sonn, Byung-Keun Hyun, Suk-Jae Jung, Seong-Oh Hur, Kang-Ho Jung, Myung-Chul Seo and Sang-Keun Ha
*National Institute of Agricultural Science and Technology, 249, Seodun-dong, Suwon, Korea
To characterize morphological classification of the basins, four major basin characteristics of the unit basins, including sinuosity, ratio of forest, ratio of flat area, and tributary existence were selected for cluster analysis. The analysis was carried out using soil map, topographic map, water course map, and basin map of the fifty unit basins in the Yeongsangang Basin. The unit basins could be categorized to five basin groups.
The fitness by the Mantel test showed good fit of which r was 0.830. These grouping based on comprehensive soil and topographic characteristics provides best management practices, water quality management according to pollutants, increased water related model application and reasonable availability of water management. For agricultural management of water resources and conservation of water quality from agricultural non-point pollutants, therefore, comprehensive systematic classification of soil characteristics on unit basin might be an useful tool.
Key words : Unit basin, Cluster analysis, Mantel test.
of flat area (area of river plain + fluvio-marine deposits / area of unit basin × 100), and yes or no of inflow. Then sinuosity was calculated from topographic map, water course map and basin map. Tributary existence was calculated from water course map and basin map. Ratio of forest and flat area was calculated from soil survey DB of each unit basin. Forest soil area was calculated from mountainous soil and hilly soils. Flat area was calculated from river plain and fluvio-marine deposits, then cluster analysis conducted with 4 major characteristics (Kim and Hahn, 1994). We conducted cluster analysis with sinuosity, ratio of forest, ratio of flat area, and tributary existence these are topographical, agricultural and pedological important characteristics of 50 unit basin on Yeongsangang basin at southwest part of Korea. After cluster analysis(using the program NTSYS version 4.0), conducted Mantel test for fitness of cluster analysis.
Results and Discussion
Table 1 shows list of the fifty basin characteristics extracted from the standard basin map (Ministry of Construction & Transportation, 2004). The sinuosity ranges from 1.02 to 2.12 with average of 1.27. The coefficient of variance, CV, of the sinuosity was 18.96 percents. The sinuosity of the Sampocheon was the highest and followed by that of the Yeongsangang- bonryu11. The Yeongsangang-bonryu14 was almost straight as sinuosity of 1.02. Among the fifty unit basin, half of the basin had tributaries through which runoff inflow to the main stream or river. The average ratio of forest was 53.3 percents ranged from 19.5 percents to 86.1 percents. The CV of the ratio was 31.28 percents.
Since the national average of the forest is about 67.0 percents, the ratio of the Yeongsangang Basin is relatively low. The ratio of flat area was 14.9 percents ranged from 0 to 53.6 percents. The CV of this ratio was 85.3 percents.
The unit basins could be classified into five basin groups, A through E as cluster tree was shown in Fig. 2.
Five unit basins including Yeongsangang-bonryu04 and 05 were in group A. The Yeongsangang-bonryu14 and Hwangryonggang-bonryu05 were in group B. Eight unit basins such as Gomagweoncheon and Yeongsanggang- bonryu13 were belong to group C. Four unit basins, such as Sampocheon, and Yeongsanggang-bonryu08 were in group D, and the rest 31 unit basins were classified as group E. In this cluster, group A was relatively near the
main stream of the river, and E was comparatively far from it.
According to the Mantel test (Pierre and Louis, 2000) for fitness test of cluster, the results were "good fit"
(r=0.8296) as showed in Table 2. Moreover major 4 characteristics, we expected some more good results, but these 4 basic characteristics was satisfactory to analyze this. These unit basin groups include similar topographic and pedological characteristics.
In aspect of landscape, as farther from mainstream from A group to E group, slope of basin was steeper (Table 3).
Percentages of slope over D of A and B groups were low as 23 to 24 percents, while those of C, D and E were from 28 to 66 percents. It implied that the area of upper stream is higher risk of soil and bank erosion than the area of lower stream. The gravel content showed similar tendency (Table 4). The farther from mainstream, the higher gravel content was. Parent material and rock debris characteristics might be main cause of this tendency. By the field observation, the shape of gravel was more angular than that of other basin on a national basis (data were not shown).
In view of soil textural family, clayey soil was dominant in group A, while fine loamy soil was dominant in E group as in Table 5. The percentages of clayey soil increased as the soils were near lower main stream, while those of fine loamy soil increased as the soils were farther from main stream. Deposition of characteristic of this area might reflect such differentiation of soil textural distribution. More detailed understanding on deposition mechanism and development of soil profile should be studied for this basin.
Table 6 shows available soil depth distribution of the groups. The available soil depth in the river flat area was deeper than in the mountainous area. This means that the basin of lower stream has many flat area and has more agricultural field like paddy. For drainage, the drainage class was well mostly, but paddy field was distributed near mainstream (Table 7). Form A to E groups, there were so many flat areas, river plain and fluvio-marine deposits near mainstream, but more mountainous areas was distributed in E group (Table 8).
In aspect of parent materials, all Yeongsangang basins
contained the soils derived from mainly granite and
porphyry, and especially this soils have so many angular
gravels, but did not have stand out in relief (Table 9). All
together, unit basins become more distant from
Middle basin
Gomagweoncheon1
Gomagweoncheon2
Yeongsangang01
Yeongsangang02
Yeongsangang03
Yeongsangang04
Yeongsangang05
Jiseogcheon
Hwangryonggang
Statistics
Classification group Ratio of
flat area(%) Ratio of forest
(%) Tributary
existence Sinuosity
Unit basin
Gomagweoncheon01 Gomagweoncheon02
Haebocheon Sampocheon Yeongsangang-bonryu12 Yeongsangang-bonryu13 Yeongsangang-bonryu14 Hampyeongcheon01 Hampyeongcheon02 Hampyeongcheon03
Gwangjucheon Yeongsangang-bonryu01 Yeongsangang-bonryu02 Yeongsangang-bonryu03 Yeongsangang-bonryu04 Yeongsangang-bonryu05 Yeongsangang-bonryu06
Oryecheon Jeungamgang-bonryu01 Jeungamgang-bonryu02 Pungyeongjeongcheon Yeongsangang-bonryu07
Manbongcheon Munpyeongcheon Yeongsangang-bonryu08 Yeongsangang-bonryu09 Yeongsangang-bonryu10 Yeongsangang-bonryu11
Yeongamcheon01 Yeongamcheon02 Yeongamcheon03 Yeongsangang-bonryu15 Yeongsangang-bonryu16
Daechocheon01 Daechocheon02 Jeongryecheon Jiseogcheon01 Jiseogcheon02 Jiseogcheon03 Jiseogcheon04 Hwasuncheon Bugicheon Bughacheon Tongancheon Pyeongrimcheon Hwangryonggang-Jangseongho01 Hwangryonggang-bonryu02 Hwangryonggang-bonryu03 Hwangryonggang-bonryu04 Hwangryonggang-bonryu05
Mean CV
1.13 1.41 1.36 2.12 1.46 1.55 1.02 1.27 1.11 1.37 1.45 1.21 1.25 1.20 1.08 1.25 1.19 1.15 1.19 1.17 1.15 1.21 1.08 1.04 1.04 1.08 1.29 2.12 1.21 1.42 1.10 1.31 1.23 1.31 1.26 1.34 1.29 1.09 1.18 1.09 1.91 1.20 1.66 1.15 1.30 1.18 1.07 1.02 1.17 1.25 1.27 18.96
1 1 0 0 1 1 1 0 1 1 0 0 1 1 1 1 1 0 0 0 0 1 0 0 0 0 1 1 0 0 1 0 1 0 0 0 1 1 1 1 0 0 0 0 0 0 1 1 1 1 0.5 101.0
56.7 46.5 77.9 39.3 45.3 42.0 23.7 58.4 48.6 67.5 53.8 70.3 51.3 44.4 30.4 32.5 31.6 52.9 62.9 55.8 65.4 34.6 53.8 55.5 39.9 36.1 55.7 36.6 44.3 49.5 36.0 44.7 30.2 70.0 82.1 67.8 65.5 58.0 60.6 35.2 84.9 59.2 77.5 76.5 78.1 86.1 63.0 19.5 64.8 40.2 53.3 31.28
10.0 26.4 4.7 16.6 13.1 24.6 20.3 4.3 33.7 10.3 11.0 1.0 14.8 26.7 38.8 37.1 53.6 8.2 3.8 13.1 12.9 43.1 14.1 9.3 14.1 19.9 12.1 27.6 7.3 17.1 11.0 22.3 11.1 0.7 1.4 0.0 0.3 0.4 7.6 24.4 0.0 8.8 2.3 2.2 6.0 4.4 8.7 32.0 15.5 38.3 14.9 85.3
E C E D E C B E C E E E E C A A A E E E E A E E D C E C E D E C D E E E E E E C E E E E E E E A E B Table 1. Data and results for classification of standard river basin.
mainstream, and then make different basin groups for agriculture.
In conclusion, classification of the unit basin of the Yeongsangang Basin into 5 groups based on the morphological characteristics of the basins might give comprehensive understanding on soil and topographic characteristics which could provide valuable information for agricultural use including best management practices,
Level
"
r: Standardized Mantel statistics.
0.9 ≤ r"
0.8 ≤ r < 0.9 0.7 ≤ r < 0.8 r < 0.7
Very good fit Good fit
Poor fit Very poor fit Interpretation Table 2. Interpretation of the results fitness.
A group B group C group D group E group
81 67 64 53 31
6 2 20 12 35
7 5 12 17 31
6 26 4 19 4 Others
>35%
10-35%
0-10%
Land use area of which gravel content was not survey
Mean ratio of gravel content Table 4. The mean ratio of gravel content for classified standard river basin.
A group B group C group D group E group
38 28 28 15 8
21 14 19 21 12
11 11 16 18 10
9 7 11 8 9
12 15 20 9 36
3 0 3 11 21
6 26 4 18 4 Land use area of which slope was not surveyed
Others"
F E
D C
B A
Slope class Table 3. The mean ratio of slope for classified standard river basin.
Fig. 1. The map of water course and standard river basin from Yeongsangang basin.
A group B group C group D group E group
4 9 2 1 2
17 17 15 8 27
27 20 47 44 52
0 0 6 1 0
1 1 11 14 11
45 29 15 15 5
5 24 4 19 4 Land use area of which soil texture was not survey
Others Clayey
Fine silty Coarse silty
Fine loamy Coarse loamy
Sandy
Mean ratio of soil textural family Table 5. The mean ratio of soil textural family for classified standard river basin.
Land use area of which avaialble soil depth was not survey A group
B group C group D group E group
9 5 12 12 29
6 13 20 15 28
40 35 26 25 23
40 21 38 28 17
6 26 4 19 4 Others
>100cm 50-100cm
20-50cm 0-20cm
Mean ratio of available soil depth Table 6. The mean ratio of available soil depth for classified standard river basin.
Fig. 2. The classification result of Yeongsangang basin.
A group B group C group D group E group
17 19 21 16 44
33 25 35 33 34
9 4 11 7 7
34 15 26 20 10
3 12 3 5 1
6 26 4 19 4 Others Poorly
Imperfectly Moderately well
Well Excessively well
Land use area of which drainage class was not survey
Mean ratio of drainage class Table 7. The mean ratio of drainage class for classified standard river basin.
water quality management for nonpoint source pollutant control, increased water related model application and reasonable availability of water management.
Acknowledgement
Authors express deep appreciation to Soil Survey Staffs, NIAST, RDA who had devoted valuable soil survey in the Yeongsangang Basin.
References
Jung, Y.T., S.J. Jung, G.S. Hyeon, Y.K. Sonn, Y.K. Cho, E.S. Yun, and G.H. Cho. 2001. Classification of Morphological types of the Korean Paddy Soils for Practical Use of Soil Survey Reults.
Korean J. Soil Sci. Fert. 34: 77-84.
Kim, C.K., and W.S. Hahn. 1994. Agricultural Meteorology Classification of Region by Multivariate Method. RDA. J. Agri.
Sci. 36: 681-685.
Ministry of Construction & Transportation. 2004. Standard basin map.
National Institute of Agricultural Sciences and Technology. 1973.
Soil Survey Manual. part 1. Field Survey & Classification. Suwon.
Korea.
Pierre L. and L. Louis. 2000. Numerical Ecology. 2nd ed. p. 554.
Elsevier Science B.V.
Soil Survey Staff. 1999. Soil Taxonomy: A Basic system of Soil Classification for Making and Interpreting Soil Surveys. USDA- NRCS, 2nd ed. Agricultural Handbook, vol. 436. U. S. Gov. Print.
Office, Washington, DC.
A group B group C group D group E group
Others Dil
FM Ri.P
All.F LV
Mt.F Hilly
Mt."
Land use area of which mean ratio of topography was not survey
"
Mt: Mountain, Mt.F: Mountain foot, LV: Local valley, All.F: Alluvial fan, Ri.P: River plain, FM: Fluvio-marine deposits, Dil.: Diluvium.
13 11 19 14 49
15 12 14 16 9
3 2 6 5 6
8 7 14 16 9
1 1 2 1 4
38 25 16 4 5
0 15 7 10 3
9 2 4 1 1
5 18 3 15 3 Mean ratio of topography
Table 8. The mean ratio of topography for classified standard river basin.
A group B group C group D group E group
5 0 15 19 25
0 1 8 3 21
0 0 0 0 1
3 5 4 3 12
20 26 34 36 25
71 67 38 37 15 Others Grn.
Sci.
Red.S Por." Rhy.
Land use area of which parent rock was not survey
"
Por.: Porphyry, Rhy,: Rhyolite, Red.S: Red shale, Sci.: Schist, Grn.: Granite.
Mean ratio of parent rock Table 9. The mean ratio of parent rock for classified standard river basin.
농업 비점오염원으로부터의 수질 보전이나 수자원 관리는 농업적 관리뿐만 아니라 수질관리 및 수자원 관리를 위해서도 유역단위 특히, 소유역의 토양특성을 포괄하는 단위로 체계적으로 분류할 필요성이 있다. 우리나라의 남서쪽에 위치한 영산강유역의 50개 소유역을 대상으로 토양도, 지형도, 하천도 및 유역도를 이용하여 만곡도, 산림의 비율, 평탄지의 비율, 다른 소유역으로부터의 유입 여부 등 토양학적으로 중요한 4개의 특성을 이용하여 군집분석을 수행하였다. 그 결과 5개의 군으로 구분할 수 있었으며, 이 구분의 적합도를 검정하기 위하여 Mantel test를 한 결과 r = 0.83으로 나타나 적합하다는 결론을 얻었다. 이와 같이 토양과 지형특성을 포괄하는 소유역의 분류 및 유사성에 따른 그룹화는 농업에서의 최적영농관리나 오염물질에 따른 수질관리, 수문모형의 적용성 확대 및 수자원 관리에 합리적 유용성을 제공할 것이며 체계적 관리의 밑바탕이 될 것이다.
토양 및 지형학적 특성에 따른 영산강유역의 소유역 분류
손연규·현병근·정석재·허승오·정강호·서명철·하상건* 농업과학기술원