3D Line Segment Extraction Based on Line Fitting of Elevation Data
Dong-Min Woo * ★
Abstract
In this paper, we are concerned with a 3D line segment extraction method by area-based stereo matching technique. The main idea is based on line fitting of elevation data on 2D line coordinates of ortho-image.
Elevation data and ortho-image can be obtained by well-known area-based stereo matching technique. In order to use elevation in line fitting, the elevation itself should be reliable. To measure the reliability of elevation, in this paper, we employ the concept of self-consistency. We test the effectiveness of the proposed method with a quantitative accuracy analysis using synthetic images generated from Avenches data set of Ascona aerial images. Experimental results indicate that our method generates 3D line segments almost 7.5 times more accurate than raw elevations obtained by area-based method.
Key words: 3D line, feature extraction, digital elevation data, self-consistency
* Dept. of Information Engineering, Myongji University
★ Corresponding author
※ Acknowledgment: This work was supported by the Korea Science and Engineering Foundation(KOSEF) grant funded by the Korean government (MOST)(Grant No.: R01-2007-000-20330-0).
Manuscript received May. 4, 2009 ; revised Jun. 4, 2009
I. Introduction
3D site modeling is one of the most popular tasks in aerial image application. Generation of 3D model requires 3D features, such as corner, 3D line, surface, etc. Among them, 3D line segment can be regarded as one of the most important features, especially in generating a polygonal form of model.
To extract 3D line segment, stereo image analysis should be carried out. A significant body of research has been carried out for this area, which is broadly divided into area-based method [1-4] and feature-based method [5-7].
Area-based method is especially useful in the
generation of 3D natural terrain model, since it can
generate dense elevation map for each grid in the
area. The current state of area-base method has
been advanced to achieve a very precise terrain
model in terms of the use of multi-resolution
scheme [2], NCC(Normalized Cross-Correlation),
NSSR(Narrow Search Sub-pixel Registration)[1],
etc. However, this method is not very successful in
3D line extraction for the building model generation,
since it generates smoothed elevation around the
boundaries or edges of buildings by the nature of
correlation or SSD(Sum of Squared Difference)
necessarily incorporated in the area-based stereo
matching. Feature-based method might be basically
effective in the site model generation, since the
matching process is based on the features such as
2D line segment, corner point, edge, zero-crossing,
etc. Those features can be core elements
constructing building rooftops. One of major
difficulties in 3D line extraction process by the
feature-based stereo matching of complex urban
images is a increasing number of possible 2D line
matching combination, which may lead to the high
possibility of false line matching, as well as significant computational cost.
In this context, there has been a necessity for a research on how to incorporate area-based method with feature-based method. Hybrid stereo matching is based on the incorporation of area-based method with feature-based method. The way of this incorporation has been studied mainly as the combination of area-based and feature-based methods [8-9], and the generation of more improved urban model was reported. By this combinational method, however, perspective distortion cannot be avoided, since correlation window or SSD window needs to be used in the stereo matching process.
Also, these combinational hybrid methods assume that features should be similarly extracted in both images, which can be hardly achieved in the real situation.
To extract more accurate 3D line segments of buildings, in this paper, we suggest a new scheme using both DEM (Digital Elevation Map) and ortho-image obtained by area-based stereo. The core of our scheme is that 3D line segment is constructed by using line fitting of elevation data on 2D line extracted from ortho-image. Since we use only reliable elevation based on self-consistency [10], we can construct precise 3D line segments which can be key elements to build 3D model.
II. Detection of Feasible 2D line
Our 3D line extraction scheme begins with the 2D line detection from ortho-image, so that we can locate orthographical coordinates of 3D line. To detect 2D lines from ortho-image, edge detection is carried out first and then 2D lines are formed from edges. We employed Canny edge detector, since it is optimal according to the criteria where edge is defined and comes up with thin edges. To obtain 2D line segment, we use Boldt algorithm [11] based on token grouping. The method extracts a basic line element, token, in terms of the properties of line, and constructs 2D line using grouping process. It is efficient in detecting 2D lines of large structure appeared in urban image.
2D line segments detected from ortho-image might be caused by planar patterns or shadows, as well
as boundaries of building rooftop. To remove 2D line segments irrelevant to building rooftop, we carry out feasibility test for all 2D lines detected from ortho-image by testing whether 2D line can be feasible to be constructed into 3D line. We utilize the fact that 3D line should exist along the depth or elevation discontinuities.
The feasibility test begins with the calculation of average elevation of upper, bottom, left and right area of a coordinate on 2D line segment. The criteria for the feasibility test are the difference between upper and bottom average elevations and the difference between left and right average elevations. Equation (1) shows the condition for the feasibility test in terms of the feasibility criteria.
(1)
In equation (1), dem(i,j) is the elevation of the grid displaced by (i,j) from a 2D line coordinate, n is the window size where average elevation is calculated, and
is the threshold to determine the feasibility. Fig. 1 shows how to calculate average elevations for the feasibility test.
a. 2D line b. Averaging windows Fig. 1. Feasibility test of 2D line
III. Extraction of 3D Line Segment
The preliminary requirement for the accurate
extraction of 3D line segment is that the elevation
data used in 3D line fitting should be highly
reliable. To determine the reliability of elevation
data, we adopt the concept of self-consistency [10],
which reflects our expectation that reversing the
target and reference images will lead to similar result when the image matching algorithm find correct correspondence and come up with reliable elevation. Therefore, the difference of the elevations provides a measure of consistency and reliability, and equation (2) indicates the condition for the reliable elevation data.
(2)
where
and
are two elevation data obtained by reversing the reference and target images, a and b. Also,
is the threshold to determine the degree of self-consistency. The elevation data determined as reliable by equation (2) can be used in 3D line fitting. Since we have two elevation for each (i,j), the average value of two elevations are actually participated in line fitting such as
(3)
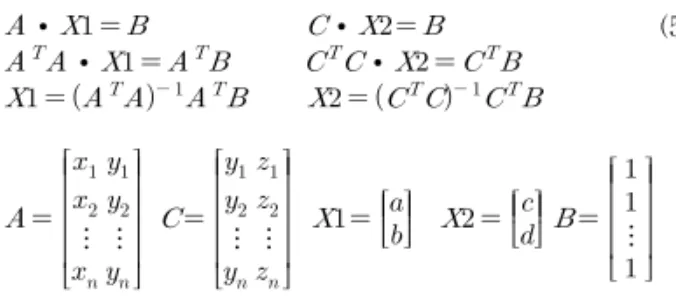
3D line segments are extracted by line fitting of reliable elevation data, as shown in Fig. 2. In order to minimize the error of the estimated 3D line as small as possible, in this paper, we adopt a line fitting in a sense of LSE(least squared error). In this paper, we define the fitted 3D line as the intersection of two plane equations, ax + by = 1 and cy + dz = 1.
To evaluate the coefficients, a, b, c and d, we substitute n 3D coordinates
,
, ...,
of reliable elevations for two plane equations, such that
⋮ ⋮
(4)
Since we have far more than 2 coordinates for each line segment, equation (4) is over-determined.
The LSE estimation of the coefficients in equation (4) can be computed by well-known pseudo inverse as in equation (5).
∙
∙
∙
∙
⋮ ⋮
⋮ ⋮
⋮
(5)
After determining the coefficients of the 3D line equation, we obtain the 3D line segment by finding 3D starting and end points, which can be the orthographically nearest positions on 3D line from two starting and end points of 2D line segments.
Fig. 2. 3D line fitting
IV. Experimental Results
The experimental environment is set up, based on Ascona aerial images of Avenches area. Since Avenches data include 3D models of terrain and buildings, these data can be efficiently utilized for the analysis and the accuracy assessment of the suggested scheme.
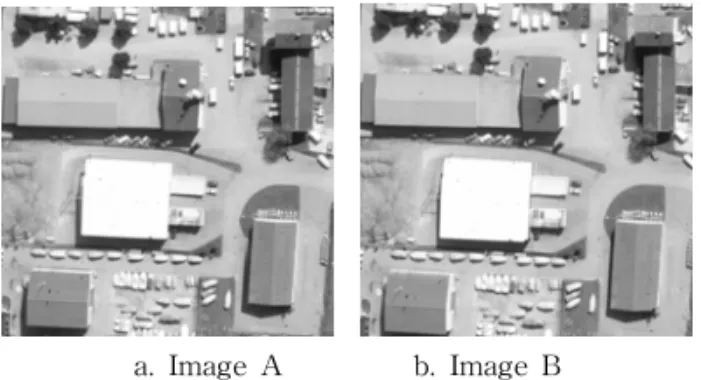
To provide a detailed accuracy analysis, in this experiment, we use ortho-image and 3D model of Avenches area as a pseudo ground truth. A photo realistic ray-tracing program is used to synthesize images of the surface from arbitrary viewpoint. Fig.
3 shows a pair of synthetic images generated from
altitude of 1000m.
a. Image A b. Image B
Fig. 3. A pair of synthetic aerial images used in the experiment
The first step to carry out the experiment is to reconstruct DEM and ortho-image from overlapped images shown in Fig. 3. Area-based stereo is performed on synthetic images with area-based 3D reconstruction system. We employed multi-resolution scheme [2], referred to as hierarchical, or pyramid processing, to this reconstruction system.
To find 3D line segments, we begin with Canny edge detector and Boldt line finder to find 2D line segments in ortho-image. To get the feasible 2D line segments, the feasibility test is carried out for filtering of all the 2D line segments detected. The threshold for the feasibility test is set to 1m. Fig. 4 (a) and (b) show ortho-image and the filtered feasible 2D line segments, based on the area-based reconstruction result from image A and image B of Fig. 4. As in Fig. 4, it is noticed that some 2D line segments caused by shadow and small planar patterns are effectively filtered out by our feasibility test.
a. ortho-image b. feasible 2D line segments Fig. 4. 2D line segment detection
In our 3D line fitting, only reliable elevations should be used in the estimation of 3D line. To measure the reliability, we calculate the difference of
and
. Fig. 5 (a) shows
and (b) shows
. Fig. 6 represents this difference in gray scale image, where the light part shows a high consistency or reliability in elevation. In this experiment, we set the threshold to be 1m, which means the elevation difference within 1m can be determined as reliable. The reliable points on 2D line segments are also displayed.
a.
b.
Fig. 5. DEM reconstructed from image A and B
3D line fitting experiments using LSE were carried out for a image pairs, AB. To represent the quantitative accuracy of 3D line segments extracted by our suggested scheme, we obtain the error by calculating the average distance between the extracted 3D line segments and the ground truth line segments as in equation (6).
×(6)
Fig. 6. Reliability evaluation of elevation using self-consistency
In equation (6),
is the distance from the
starting point of line segment i to the ground truth
Dong-Min Woo (Member)
1980 : BS degree in Electronic Engineering, Yonsei University.
1982 : MS degree in Electronic Engineering, Yonsei University.
1987 : PhD degree in Electrical Engineering, Case Western Reserve University.
1990~present : Professor, Myongji University