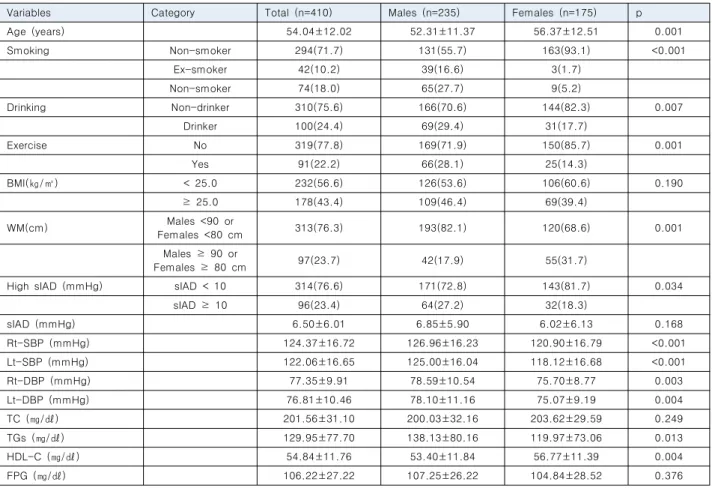
Gender differences in the relationship between adiposity and systolic inter-arm blood pressure difference in Korea adults
1)ㅎㅎㅈㅎ
전체 글
1)ㅎㅎㅈㅎ
수치

관련 문서
Objective: This study was conducted to identify the association between vitamin D and osteosarcopenia among all adults in Korea using data from the Korea National Health
First, in the difference in Taekwondo image, Taekwondo loyalty, and memorial intention according to the general characteristics (gender, nationality,
This study was to do a comparative analysis on kinematic differences and differences in muscle activity between the skilled and the unskilled in windsurfing
The Relationship between Physical Activities and Health-related Quality of Life in Korean Adults with Diabetes
The study was conducted to find out the relationship between teacher passion and intrinsic motivation and class attitude that was perceived by participants in physical
The study aims to compare the differences between the six basi c textbooks in Korea's 15th curriculum to analyze differences in descr iptions for each
Objective: This study was conducted to identify the association between vitamin D and Sarcopenia among all adults in Korea using data from the National Health and
relationships to changing gender differences in behaviour and other causal factors. Gender inequalities in health, 150-181.. World
