INTRODUCTION
Adjuvant chemotherapy after resection of the primary colon can- cer reduces the risk of disease recurrence by 40% and mortality by
33% [1]. Early initiation of adjuvant chemotherapy after colon can- cer surgery has shown better oncologic outcomes in previous stud- ies [2-6]. The European Society for Medical Oncology (ESMO) guideline recommends that adjuvant chemotherapy should be given as soon as possible, from the third to the 12th week pos-top- eratively [7]. In contrast, the National Comprehensive Cancer Network guideline does not recommend a precise timing of adju- vant chemotherapy, but it introduces some studies that revealed how starting early adjuvant chemotherapy showed better oncolog- ic outcomes [8]. One of the benefits of minimally invasive surgery such as laparoscopic and robotic surgeries is earlier postoperative recovery than open surgery [9,10]. However, the clinical impact of laparoscopic and robotic surgeries on the initiation of adjuvant che- motherapy has not been widely evaluated. Therefore, this study’s aim was to compare those surgical approaches’ influence on the initiation of adjuvant chemotherapy after colon cancer surgery.
Original Article
Korean Journal of Clinical Oncology 2020;16:9-17 https://doi.org/10.14216/kjco.20003
pISSN 1738-8082 ∙ eISSN 2288-4084
Comparing the initiation of adjuvant chemotherapy after robotic and laparoscopic colon cancer
surgeries: A case-controlled study with propensity score matching
Sanghoon Kim, Sung Uk Bae, Seong Kyu Baek, Woon Kyung Jeong
Department of Surgery, Keimyung University Dongsan Medical Center, Keimyung University School of Medicine, Daegu, Korea
Purpose: Early initiation of adjuvant chemotherapy after colon cancer surgery has shown better oncologic outcomes in previous studies.
However, the clinical impact of robotic and laparoscopic surgeries on the initiation of adjuvant chemotherapy has not been widely evaluated.
Hence, the study’s aim was to compare the influence of both surgical approaches on the initiation of adjuvant chemotherapy after colon cancer surgery.
Methods: From June 2011 to September 2017, 289 patients underwent curative robotic or laparoscopic surgery followed by adjuvant che- motherapy for stage II and III colon cancer. To control for different demographic factors in the two groups, propensity score case matching was used at a 1:4 ratio. Finally, 190 patients were matched with 38 patients of the robotic surgery group and 152 patients of the laparoscop- ic surgery group.
Results: The operation time was longer in the robotic surgery group (297 minutes vs. 170 minutes, respectively; P<0.001). However, conver- sion rate, number of retrieved lymph nodes, first flatus, first soft diet, length of stay, postoperative complication rate, and Clavien-Dindo grade were not significantly different between the two groups. Additionally, there was no difference in the time to initiation of adjuvant che- motherapy between the two groups (31.5 days vs. 29.0 days, respectively; P=0.226). Disease-free and overall survival rates were also not sig- nificantly different.
Conclusion: Robotic and laparoscopic surgeries showed no different impact on the initiation of adjuvant chemotherapy. This finding suggests that the two surgical approaches offer similar postoperative outcomes.
Keywords: Colonic neoplasm, Adjuvant chemotherapy, Minimally invasive surgery, Robotic surgical procedure, Laparoscopy
Received: Apr 13, 2020 Revised: Jun 22, 2020 Accepted: Jun 26, 2020 Correspondence to: Woon Kyung Jeong
Department of Surgery, Keimyung University Dongsan Medical Center, 1035 Dalgubeol-daero, Dalseo-gu, Daegu 42601, Korea
Tel: +82-53-258-7879, Fax: +82-53-258-4710 E-mail: [email protected]
ORCID: Sanghoon Kim (https://orcid.org/0000-0001-9481-3042), Sung Uk Bae (https://orcid.org/0000-0002-7876-4196), Seong Kyu Baek (https://orcid.org/0000- 0001-6427-8675), Woon Kyung Jeong (https://orcid.org/0000-0001-8421-218X) Copyright © 2020 Korean Society of Surgical Oncology
This is an Open Access article distributed under the terms of the Creative Commons Attri- bution Non-Commercial License (http://creativecommons.org/licenses/by-nc/4.0) which permits unrestricted non-commercial use, distribution, and reproduction in any medium, provided the original work is properly cited.
Study population and study design
From June 2011 to September 2017, 830 consecutive patients un- derwent colon cancer surgery at Keimyung University Dongsan Medical Center. Patient data were collected from the prospectively managed electric database. Thirty patients who were less than 20 years old, underwent emergency surgery, or had simultaneous sur- gery for other organ diseases were excluded. Four hundred and ninety-one out of 800 patients had pathologic stage II and III colon cancer (245 and 246, respectively). Of the 491 patients, 327 re- ceived adjuvant chemotherapy (120 and 207, respectively). To compare minimally invasive surgery, 38 patients who underwent open laparotomy were excluded.
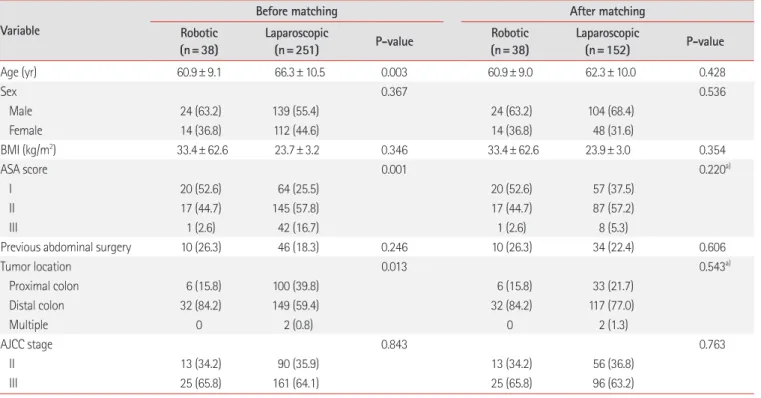
Ultimately, 289 patients were enrolled. Thirty-eight patients un- derwent robotic surgery (RS) and 251 patients underwent laparo- scopic surgery (LS). To control for different demographic factors in the two groups, propensity score case matching was used at a 1:4 ratio. Propensity scores were generated with the baseline charac- teristics, including age, sex, body mass index, American Society of Anesthesiologists (ASA) score, previous abdominal surgery, tumor location and pathologic stage. Finally, 190 patients were matched with 38 patients of RS group and 152 patients of LS group (Fig. 1).
Table 1. Preoperative and pathologic factors (before and after case matching)
VariableBefore matching After matching
Robotic (n=38)
Laparoscopic
(n=251) P-value Robotic
(n=38)
Laparoscopic
(n=152) P-value
Age (yr) 60.9± 9.1 66.3± 10.5 0.003 60.9± 9.0 62.3± 10.0 0.428
Sex 0.367 0.536
Male 24 (63.2) 139 (55.4) 24 (63.2) 104 (68.4)
Female 14 (36.8) 112 (44.6) 14 (36.8) 48 (31.6)
BMI (kg/m2) 33.4± 62.6 23.7± 3.2 0.346 33.4± 62.6 23.9± 3.0 0.354
ASA score 0.001 0.220a)
I 20 (52.6) 64 (25.5) 20 (52.6) 57 (37.5)
II 17 (44.7) 145 (57.8) 17 (44.7) 87 (57.2)
III 1 (2.6) 42 (16.7) 1 (2.6) 8 (5.3)
Previous abdominal surgery 10 (26.3) 46 (18.3) 0.246 10 (26.3) 34 (22.4) 0.606
Tumor location 0.013 0.543a)
Proximal colon 6 (15.8) 100 (39.8) 6 (15.8) 33 (21.7)
Distal colon 32 (84.2) 149 (59.4) 32 (84.2) 117 (77.0)
Multiple 0 2 (0.8) 0 2 (1.3)
AJCC stage 0.843 0.763
II 13 (34.2) 90 (35.9) 13 (34.2) 56 (36.8)
III 25 (65.8) 161 (64.1) 25 (65.8) 96 (63.2)
Values are presented as mean± standard deviation or number (%).
BMI, body mass index; ASA, American Society of Anesthesiologists; AJCC, American Joint Committee on Cancer.
a)Fisher exact test.
Fig. 1. Study design. BMI, body mass index; ASA, American Society of Anesthesiologists.
Robotic surgery (n=38)
Robotic surgery (n=38)
Laparoscopic surgery (n=251)
Laparoscopic surgery (n=152) Case matching using
propensity score (1:4 ratio) Case matching covariates Age
Sex BMI ASA score
Previous abdominal surgery Tumor location
Pathologic stage
Sanghoon Kim et al.
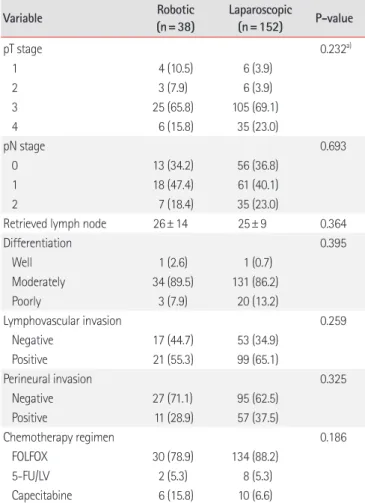
• Adjuvant chemotherapy for colon cancer(Table 1). Other pathologic data including T stage, N stage, dif- ferentiation, lymphovascular invasion, and perineural invasion were not significantly different between the two groups. FOLF- OX (5-fluorouracil, leucovorin, and oxaliplatin) was the most used adjuvant chemotherapy regimen (78.9% vs. 88.2%, respec- tively; P = 0.186). The mean number of retrieved lymph nodes was not different between the two groups (Table 2).
Perioperative results after propensity score matching The median operation time was longer in the RS group than in the LS group (297 minutes vs. 170 minutes; respectively; P< 0.001) (Table 3). Despite that conversion was required only in the LS group, statistical difference was not shown between both groups (0 case vs. 6 cases, respectively; P= 0.257). The reasons for conversion were dense adhesions of the small intestine caused by previous surgery (n= 3), invasion of the abdominal wall (n= 2), and a huge Statistical analysis
Statistical analyses were performed with PASW Statistics 18 soft- ware (SPSS Inc., Chicago, IL, USA) and R 3.2.2 (R Foundation for Statistical Computing, Vienna, Austria). The data are displayed as frequencies and percentages for categorical variables and were an- alyzed with the Pearson’s chi-square test or Fisher exact test. The Kolmogorov-Smirnov test was used to test the distribution of con- tinuous variables. Normally distributed variables were examined with Student t-test and the results are presented as mean (standard deviation). Conversely, non-normally distributed continuous vari- ables were subjected to examination with the Mann-Whitney U test, and the results are expressed as median (interquartile range).
The Kaplan-Meier method was used to analyze survival. Addition- ally, prognostic factors were analyzed using the Cox-regression model. Two-tailed values of P < 0.05 were considered statistically significant.
Ethics statement
This study protocol was reviewed and approved by the Institutional Review Board of the Keimyung University Dongsan Medical Center (IRB No. 2019-12-022). Informed consent was waived due to the retrospective design of the study.
RESULTS
Demographic and preoperative data before and after propensity score matching
Before propensity score case matching, a higher mean age, higher percentage of ASA scores, and less percentage of distal colon can- cers were noted in the LS group.
The mean age was 60.9 years in the RS group and 66.3 years in the LS group (P=0.003). ASA scores I, II, and III were 52.6%, 44.7%, and 2.6% in the RS group and 25.5%, 57.8%, and 16.7% in the LS group, respectively (P= 0.001). Tumors located in the proximal co- lon, distal colon, and multiple sites were 15.8%, 84.2%, and 0% in the RS group and 39.8%, 59.4, and 0.8% in the LS group (P=0.013).
After propensity score case matching, these factors were well balanced. The mean ages were 60.9 years and 62.3 years, respective- ly (P= 0.428). The ASA score became similar (52.6%, 44.7%, and 2.6% vs. 37.5%, 57.2%, and 5.3%, respectively; P= 0.220). Moreover, tumor location was not significantly different (15.8%, 84.2%, and 0% vs. 21.7%, 77.0, and 1.3%, respectively; P= 0.543) (Table 1).
Pathologic results and chemotherapy regimen after propensity score matching
Percentages of AJCC stages II and III in both groups were simi- lar (34.2% and 65.8% vs. 36.8% and 63.2%, respectively; P= 0.763)
Table 2. Pathologic results and chemotherapy regimen (after case matching)
Variable Robotic
(n=38)
Laparoscopic
(n=152) P-value
pT stage 0.232a)
1 4 (10.5) 6 (3.9)
2 3 (7.9) 6 (3.9)
3 25 (65.8) 105 (69.1)
4 6 (15.8) 35 (23.0)
pN stage 0.693
0 13 (34.2) 56 (36.8)
1 18 (47.4) 61 (40.1)
2 7 (18.4) 35 (23.0)
Retrieved lymph node 26± 14 25± 9 0.364
Differentiation 0.395
Well 1 (2.6) 1 (0.7)
Moderately 34 (89.5) 131 (86.2)
Poorly 3 (7.9) 20 (13.2)
Lymphovascular invasion 0.259
Negative 17 (44.7) 53 (34.9)
Positive 21 (55.3) 99 (65.1)
Perineural invasion 0.325
Negative 27 (71.1) 95 (62.5)
Positive 11 (28.9) 57 (37.5)
Chemotherapy regimen 0.186
FOLFOX 30 (78.9) 134 (88.2)
5-FU/LV 2 (5.3) 8 (5.3)
Capecitabine 6 (15.8) 10 (6.6)
Values are presented as number (%) or mean± standard deviation.
pT, pathologic tumor; pN, pathologic node; FOLFOX, 5-fluorouracil, leucovo- rin, and oxaliplatin; 5-FU/LV, 5-fluorouracil/leucovorin.
a)Fisher exact test.
cancer mass (n= 1).
Postoperative complication rate seemed higher in the RS group;
however, there was no statistical difference (11/38, 28.9% vs.
30/152, 19.7%, respectively; P= 0.217). Clavien-Dindo grade also was not significantly different between the two groups. Most com- plications were classified as Clavien-Dindo grade I or II in both groups. Grade III complications occurred in two patients in the LS group. One patient had organ/space surgical site infection, which was treated with percutaneous drainage (grade IIIa). Another pa- tient experienced anastomotic leakage requiring laparotomy and diverting ileostomy (grade IIIb). None of the patients in the RS group had grade III complications.
There were no differences in the length of stay, first flatus, and first soft diet. Regarding the time to initiation of adjuvant chemo- therapy, there was no difference between the two groups as well (31.5 vs. 29.0 days, respectively; P= 0.226).
Disease-free and overall survival rates
Survival analysis between RS and LS groups is shown in Fig. 2. The
5-year overall survival and disease-free survival rates were not sig- nificantly different between the two groups. The 5-year overall survival rate was 86.1% in the RS group and 78.0% in the LS group (P= 0.356). Meanwhile, the 5-year disease-free survival rate was the same in both groups (82.9% vs. 82.9%, respectively; P= 0.987).
In stage II colon cancer patients, the 5-year overall survival rate was lower in the RS group (66.7%) than in the LS group (82.5%), but statistical difference was not shown (P= 0.810). The 5-year dis- ease-free survival rate was similar between the two groups (91.7 vs.
90.9%, respectively; P= 0.997) (Fig. 3). In stage III colon cancer pa- tients, the 5-year overall survival rate was higher in the RS group (95.0%) than in the LS group (74.8%) without statistical difference (P= 0.173). Moreover, the 5-year disease-free survival rate was similar (77.3 vs. 77.8%, respectively; P= 0.967) (Fig. 4).
Risk factors of disease-free survival and overall survival Univariate and multivariate analyses were carried out to assess the surgical approach (robotic and laparoscopic surgeries) as an inde- pendent prognostic factor with respect to overall survival and dis-
(n=38) (n=152)
Conversion 0 6 (3.9) 0.257a)
Operation time (min) 297 (219–374) 170 (142–230) < 0.001
Postoperative complication 11 (28.9) 30 (19.7) 0.217
SSI, superficial 2 9
SSI, organ/space 0 3
Anastomosis leakage 2 2
PMC 2 5
Thrombophlebitis 0 1
FUO 0 1
Ischemic colitis 0 2
Paralytic ileus 2 3
Small bowel obstruction 2 2
Urinary retention 0 1
Chyle leakage 1 1
Clavien-Dindo grade 0.835a)
I 3 (27.3) 9 (30.0)
II 8 (72.7) 19 (63.3)
IIIa 0 1 (3.3)
IIIb 0 1 (3.3)
First flatus (day) 3.0 (2.0–4.0) 3.0 (2.0–4.0) 0.961
First soft diet (day) 7.0 (6.8–8.0) 7.0 (6.0–8.0) 0.062
Length of stay (day) 10.0 (9.0–13.0) 10 (9.0–12.0) 0.564
Time to initiation of adjuvant chemotherapy (day) 31.5 (27.0–34.3) 29.0 (25.0–35.0) 0.226
Values are presented as number (%) or median (interquartile range).
SSI, surgical site infection; PMC, pseudomembranous colitis; FUO, fever of unknown origin.
a)Fisher exact test.
Sanghoon Kim et al.
• Adjuvant chemotherapy for colon cancerFig. 2. Five-year overall survival curves (A) and disease-free survival curves (B) between robotic and laparoscopic surgery groups.
Fig. 3. Five-year overall survival curves (A) and disease-free survival curves (B) in patients with stage II.
Fig. 4. Five-year overall survival curves (A) and disease-free survival curves (B) in patients with stage III.
Months A
20 40 60 80 100 P = 0.356 Laparoscopic surgery
Robotic surgery 1.0
0.8
0.6
0.4
0.2
0
Cumulative overall survival rate
Months B
20 40 60 80 100 P = 0.987 Laparoscopic surgery
Robotic surgery 1.0
0.8
0.6
0.4
0.2
0
Cumulative disease-free survival rate
A 20 40 60 80 100
P = 0.810
Months
Laparoscopic surgery
Robotic surgery 1.0
0.8 0.6 0.4 0.2
0
Cumulative overall survival rate
B 20 40 60 80 100
P = 0.997
Months
Laparoscopic surgery Robotic surgery 1.0
0.8 0.6 0.4 0.2
0
Cumulative disease-free survival rate
A 20 40 60 80 100
P = 0.173
Months
Laparoscopic surgery Robotic surgery 1.0
0.8 0.6 0.4 0.2
0
Cumulative overall survival rate
B 20 40 60 80 100
P = 0.967
Months Laparoscopic surgery Robotic surgery
1.0 0.8 0.6 0.4 0.2
0
Cumulative disease-free survival rate
ease-free survival.
Factors associated with poorer overall survival in univariate analy- sis included poor differentiation, perineural invasion, and 5-fluoro- uracil/leucovorin (5-FU/LV) or capecitabine chemotherapy regi- men. Similarly, in multivariate analysis, the abovementioned factors were also associated with poorer overall survival (Table 4).
During a median follow-up period of 35 months, 25 patients ex- perienced colon cancer recurrence (5/38, 13.2% vs. 20/152, 13.2%, respectively). In univariate analysis, the factors associated with poorer disease-free survival were poor differentiation, lymphovas-
cular invasion, and perineural invasion. Meanwhile, in multivari- ate analysis, only poor differentiation and lymphovascular inva- sion were associated with poorer disease-free survival (Table 5).
DISCUSSION
Minimally invasive LS for colon cancer has been accepted widely for short-term outcomes, such as reduced postoperative pain, rap- id resumption of bowel transit, better cosmesis, and a reduced postoperative systemic immune response compared to open sur-
VariableHR (95% CI) P-value HR (95% CI) P-value
Age (yr) 1.285 (0.583–2.835) 0.534
< 60 vs. ≥ 60
Sex 0.345 (0.119–1.000) 0.050
Male vs. female
BMI (kg/m2) 1.054 (0.478–2.324) 0.896
< 25 vs. ≥ 25
ASA score 2.010 (0.845–4.781) 0.115
I vs. II, III
Surgical approach 0.571 (0.171–1.908) 0.363
Laparoscopic vs. robotic
Tumor location 1.080 (0.407–2.868) 0.877
Proximal vs. distal colon
pT stage 1.379 (0.324–5.869) 0.663
T1, 2 vs. T3, 4
pN stage 1.371 (0.595–3.158) 0.459
N0 vs. N1, 2
AJCC stage 1.371 (0.595–3.158) 0.459
II vs. III
Differentiation 3.385 (1.409–8.132) 0.006 2.808 (1.160–6.798) 0.022
WD+MD vs. PD
Lymphovascular invasion 3.190 (0.952–10.684) 0.060
Absent vs. present
Perineural invasion 2.227 (1.023–4.851) 0.044 2.681 (1.182–6.085) 0.018
Absent vs. present
Chemotherapy regimen 3.699 (1.471–9.304) 0.005 4.087 (1.538–10.860) 0.005
FOLFOX vs. 5-FU/LV, capecitabine
Complication 0.880 (0.331–2.337) 0.798
Absent vs. present
Length of stay (day) 0.591 (0.256–1.363) 0.217
≤ 10 vs. > 10
Time to initiation of adjuvant chemotherapy (day) 0.559 (0.243–1.286) 0.171 ≤ 30 vs. > 30
HR, hazard ratio; CI, confidence interval; BMI, body mass index; ASA, American Society of Anesthesiologists; pT, pathologic tumor; pN, pathologic node; AJCC, American Joint Committee on Cancer; WD, well differentiation; MD, moderate differentiation; PD, poor differentiation; FOLFOX, 5-fluorouracil, leucovorin, and oxaliplatin; 5-FU/LV, 5-fluorouracil/leucovorin.
Sanghoon Kim et al.
• Adjuvant chemotherapy for colon cancergery [11]. Long-term oncologic outcomes are at least equivalent in both minimally invasive laparoscopic and open surgeries [12,13].
When compared to the LS, the advanced techniques of the ro- botic surgical system provide better visualization and movements, enabling more precise and safer surgery. This led to the rapid adoption of the robotic surgical system by the enthusiastic sur- geons. In the field of colon cancer surgery, the expectation that RS offers much better benefits than LS has not been realized. In the literature, the comparative studies comparing clinical outcomes between the two surgeries have not shown consistent results. A
population analysis comparing robotic and laparoscopic colecto- mies for colon cancer reported that robotic and laparoscopic groups were similar in short-term outcomes. However, the robotic group was associated with decreased conversion to an open sur- gery and length of stay [14]. In a randomized, controlled study comparing robotic and laparoscopic surgeries for right colon can- cer, conversion to an open surgery, length of stay, and morbidity were similar, but the RS group had longer operation time and higher cost [15].
We supposed that a different method other than generally used Table 5. Univariate and multivariate analyses of risk factors for disease-free survival after surgery
Variable Univariate Multivariate
HR (95% CI) P-value HR (95% CI) P-value
Age (yr) 1.265 (0.568–2.817) 0.565
< 60 vs. ≥ 60
Sex 0.593 (0.236–1.485) 0.264
Male vs. female
BMI (kg/m2) 1.124 (0.505–2.502) 0.775
< 25 vs. ≥ 25
ASA score 1.135 (0.510–2.528) 0.756
I vs. II, III
Surgical approach 1.008 (0.378–2.688) 0.987
Laparoscopic vs. robotic
Tumor location 1.143 (0.491–4.172) 0.512
Proximal vs. distal colon
pT stage 2.996 (0.405–22.171) 0.283
T1, 2 vs. T3, 4
pN stage 2.013 (0.803–5.043) 0.136
N0 vs. N1, 2
AJCC stage 2.013 (0.803–5.043) 0.136
II vs. III
Differentiation 3.403 (1.413–8.193) 0.006 3.182 (1.318–7.685) 0.010
WD+MD vs. PD
Lymphovascular invasion 5.948 (1.401–25.260) 0.016 4.788 (1.116–20.536) 0.035
Absent vs. present
Perineural invasion 2.578 (1.165–5.705) 0.019 2.109 (0.945–4.705) 0.068
Absent vs. present
Chemotherapy regimen 2.280 (0.681–7.635) 0.181
FOLFOX vs. 5-FU/LV, capecitabine
Complication 1.438 (0.601–3.445) 0.415
Absent vs. present
Length of stay (day) 0.824 (0.364–1.869) 0.644
≤ 10 vs. > 10
Time to initiation of adjuvant chemotherapy (day) 1.130 (0.515–2.479) 0.760 ≤ 30 vs. > 30
HR, hazard ratio; CI, confidence interval; BMI, body mass index; ASA, American Society of Anesthesiologists; pT, pathologic tumor; pN, pathologic node; AJCC, American Joint Committee on Cancer; WD, well differentiation; MD, moderate differentiation; PD, poor differentiation; FOLFOX, 5-fluorouracil, leucovorin, and oxaliplatin; 5-FU/LV, 5-fluorouracil/leucovorin.