An Observational Study on the Differences in Thermal Characteristics of the Upo Wetland and Converted Areas from Wetland to Paddy Field
Hyun-Suk Koo, Dae-Youn Jeon, and Hae-Dong Kim
*Department of Environmental Conservation and Disaster Prevention Keimyung University, Daegu 704-701, Korea
Abstract: This study intended to collect data for evaluating the meteorological value of Upo Wetland which is the largest wetland in the downstream of Nakdong River. The observations were conducted in summer at the Upo Wetland and its surrounding paddy field that is the converted areas from a wetland to a paddy field. The following results are obtained:
1) The temperature of Upo Wetland area was 1oC lower than the surrounding area during the day while it was a little higher during the night.; 2) The maximum wind speed in the Upo Wetland area was 3.5 m/s which is stronger than 1.6 m/s of its surrounding area. The south wind was observed in the farmland for most of the day while north winds and south winds alternated between day and night in Upo Wetland.; 3) In heat budget analysis, Upo Wetland was wasted in the form of latent heat rather than sensible heat in daytime.
Keywords: Upo Wetland, Heat budget analysis, Climate relief effect
Introduction
Wetlands in Korea have been damaged indiscreetly to ensure farmland and industrial lands since the Japanese occupation (1910-1945) and in the recent years. The wetlands were commonly regarded as abandoned lands without any economic values.
However, today, inland wetlands play a well-known role as a paradise for plants and seasonal birds and serve as a natural purification plant against inland environmental pollutants. In terms of water quality environmentology, wetland suppresses river contamination by filtering the pollutants from people’s daily lives and agricultural activities. The number of wetlands in both Inland and coastal areas has continually decreased to yield new land, while a level of pollution rose with increasing human activities. As a result, the pollution of rivers and coasts is in an extreme severity.
In addition, the preventive function of wetlands has been undermined. The function of coastal wetlands was to be a natural breakwater during typhoons and to prevent the low-temperature sea winds in coastal
cities. Another function of inland wetlands is to stop flooding by accommodating excess river water during the summer floods. The wetlands also prevent and conditions by supplying moisture. However, we have been damaging wetlands for a long time without recognizing their value.
Studies on wetlands in Korea are largely divided into physical geography and ecological environment.
In the field of physical geography, many studies focused on the background of wetlands (Kim, 1988;
Lee, 1999) and the distribution and types of wetlands (Rho, 2007). Yoo (2001) drew up a list of major wetlands in Korea and divided them into several classes. Son and Jeon (2003) investigated the physical and geographical characteristics of major wetlands in the downstream of Nakdong River. Jung (2004) examined the changes in land use by studying the distribution of wetlands on the shore of the downstream of Nakdong River as well as their characteristics. To examine ecological environment in the wetland, ecological studies had been conducted exclusively for vegetation and birds because of social unawareness and indifference toward wetlands (Hur et al., 1999; Chui et al., 2003). In recent years, the sediments, planktons, and water quality in wetlands have been studied (Kim, 2005; Choi et al., 2007).
(해 설)
*Corresponding author: [email protected] Tel: 82-53-580-5930
Fax: 82-53-580-5385
As described above, studies on wetlands in Korea focused mostly on physical geography and ecological environment. However, no studies have been conducted to investigate the effects of wetlands on local-scale climate until recently. Kim et al. (2007) evaluated the heat budget characteristics of wetlands in Goheung, Jeonnam. It was not able to address the issue of environmental changes due to damages of wetlands.
This study intended to collect data for the evaluation of the meteorological conditions in Upo Wetland which is the largest wetland in the downstream of Nakdong River. Upo Wetland is a hinterland wetland created by earth and sands flown from the surroundings because Nakdong River flew backward due to the slow inclination of the river and the rising water level of the southern sea which formed a natural bank and blocked the water. Upo Wetland was designated as ecosystem preservation area in July 1997, registered as a Ramsar wetland in March 1998, and designated as a wetland protection area in February 1999.
For the evaluation of the meteorological conditions in Upo Wetland, this study investigated the environmental relief effects of the wetland through field observations. These observation data were compared with the meteorological data observed by the Milyang Weather Station which is close to Upo Wetland.
Observation and Analysis method
Study area and observation
The object area is the largest natural wetland in Korea, located in Youeo-Myun, Changyeong-Gun, Gyungnam. Upo, the largest among four wetlands, has a width of approximately 1.5 km. The location for observations is a paddy field behind the observation tower and the DaeDae Bank in the Upo, which is the place to the converted areas from a wetland to a farmland. This is considered an appropriate place for checking the climate changes of the areas converted from wetlands into the paddy fields.
In July 2007, we installed a 10m meteorological tower in Upo Wetland and have been collecting water temperature and meteorological data (temperature, humidity, direction of wind, wind velocity, etc.) since then. Also in summer of 2007, we installed an automatic weather station where a part of the Upo Wetland changed to a farmland, and conducted a field meteorological observation experiment. We installed a 10m high automatic weather station in Upo Wetland (Fig. 1a) and a 2.5m high automatic weather station in a farmland located about 200m to the southeast of the Daedae bank beside Upo Wetland (Fig. 1b). These automatic weather station measured temperature, relative humidity, direction of wind, insolation, and other data and automatically saved them in a data collection and recording device (CR-10, Campbell, USA) through sensors. They performed observations in intervals of 10 min. and recorded average values in intervals of one hour. Furthermore, for comparison of surface temperature between Upo Wetland and farmland, FLUKE54 thermometers were installed in an empty land beside Upo Wetland and in the farmland. This comparison allowed us to identify the climate changes
Fig. 1. The location for observations at Upo Wetland (a) and its surrounding paddy field (b).
caused by the transformation of a wetland into a farmland. In addition, daily changes in the temperature and humidity of the Milyang Weather Station near Upo Wetland were compared with the data from the Upo Wetland to analyze the climate relief effects (control of temperature rising and falling; control of humidity changes) of Upo Wetland.
Heat-budget analysis
This study covers the heat budget analysis characteristics based on the weather data and thermal data observed at Upo Wetland and surrounding the paddy field.
It is known that the comparison of temperatures alone is not sufficient to discuss the characteristics of local weather because the effect of time delay is too big for the difference between water, ground, and surface temperatures to be reflected on the air temperature change in the mesoscale-
γ(horizontal scale 2-20 km) and local-scale. In this study, therefore, surface and ground temperatures, net radiation, and solar radiation were measured in order to gather data to evaluate each item of heat budget balance. The heat budget balance was analyzed based on these data. The heat budget balance relation can be described as follows over the areas covered with forests and with great energy transportation effect by the local wind (Monteith and Unsworth, 1990).
Rn=lE+H+Bs+F+Bp+µA
(1)
where
Rn,
lE,
H,
Bs,
Bpand
µAare the net radiative flux, the latent heat flux, the sensible heat flux, the ground heat flux, the heat flux transfer from wind, the energy flux by plant respiration. The value of two terms of right hand side in Eq. (1), however, is less than 2% of net radiation according to the observation results in the summer in the mid-latitude areas (Monteith and Unsworth, 1990). Therefore, it is a general neglecting the two terms for the heat budget analysis in the layers of plant in Temperate region (Nishizawa and Nishioka, 2003). This study is adopted the following equations which is neglected the two terms of right hand side in Eq. (1).
Rn=lE+H+Bs+F
(2)
In this study, the time variation of each terms in Eq.
(2) is calculated. The sensible heat flux and the latent heat flux is calculated by bulk method. The net radiative flux is estimated by observed radiation value.
The downward long-wave radiation and upward long- wave radiation were evaluated by empirical formulation of Kondo et al. (1989) and surface temperature (Kondo et al., 1989), respectively. The following equations describe each term in Eq. (2).
Rn
=(1
−ref)
S↓−ε(
σ-
L↓)(3) where
ref, albedo of surface, is assumed by the method of Sugawara and Kondo (1995).
ε, surface emissivity, is assumed 1 because this value is known to almost 1. is the surface temperature,
σthe Stefan- Boltzmann constant, the
S↓downward short-wave radiation,
L↓the downward long-wave radiation. The downward short-wave radiation is measured by pyranometer and downward long-wave was calculated as follows.
L↓
=
σ((1
−0.49
−0.066
−e0.5)(1
−n×C×h) (4) where
Taand
nare surface temperature (
K) and cloudiness.
Cand
hare calculated by Eq. (5) and Eq.
(6), respectively.
C
=0.75
−0.05
×e(5)
h
=[(
n1+0.85
×n2+0.5
×n3)/
n]+0.1
×Nr/
N(6) where
eis water vapor pressure (daily mean),
Nr/
Nthe duration of rainfall in a day,
ncloud amount,
n1low clouds amount,
n2the middle clouds amount,
n3the upper clouds amount. The cloud data is estimated by 3-hourly cloud data that was observed in Daegu weather station.
The latent heat flux is evaluated by the bulk method according to Sugawara and Kondo (1995).
lE
=
lρβCHU(
qsat(
Ts)
−qa) (7) where
lis latent heat of vaporization (2.50
×106 Joule/
kg),
CHUexchange coefficient,
βmoisture availability,
qa
specific humidity for air temperature,
qsat(
Ts)
Ts4
Ta4
saturation specific humidity for ground temperature.
The ground heat flux and the heat flux transfer from wind were calculated residual terms of Eq. (2).
Results
Comparison of observational data
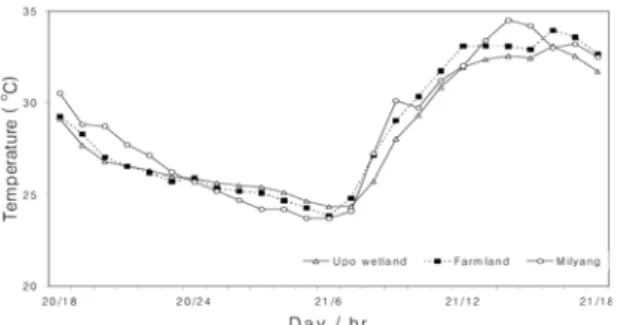
Figure 2 shows the air temperature variations of the Upo Wetland around the paddy fields and the Milyang Weather Station. This station is the closest site to Upo Wetland and has convenient facilities for residents.
The area has a effect on the synoptic weather pattern similar to that of the Upo Wetland. Therefore, different climates in these areas may be considered different environmental conditions. The three sites have a similar temperature variation pattern, but have slightly different temperature characteristics. The surface temperature of the Upo Wetland was about 1
oC lower than that of its surrounding paddy fields during the day and the temperature was slightly higher than that of the paddy fields at night. The difference was caused by the thermal capacity and activities of water evaporation between the two areas.
The air temperature at the Milyang Weather Station, located in an inland city, was lower than that the of Upo Wetland and the paddy fields after sunset and higher after sunrise. The maximum temperature observed in the Upo Wetland was 33.0
oC which is lower than 34.5
oC at the Milyang Weather Station. In addition, the minimum temperatures in the wetland and at the station were 24.3 and 23.7
oC, respectively.
The time of the lowest temperature was 06LST at Milyang Weather Station and 07LST at Upo Wetland.
This difference of approximately one hour is due to the difference in heat capacity between the two sites.
Upo Wetland has relatively higher heat capacity and slowly cools and heats by the thermal sponge effect.
Thermal sponge effect refers to the absorption of heat by the wetland to lower temperature when temperature is high and the prevention of temperature falling by discharging heat when temperature is low.
The diurnal range of temperatures in the wetland and at the station were 8.7 and 10.8
oC, respectively, which is approximately a 2
oC difference. This difference results from the heat storage function of the wetland being stronger than that at the station, an inland area, so the strong sponge effect of heat is evident. The function of the wetland is to stop temperature declines by absorbing the atmospheric heat during the day and releasing it at night.
Figure 3 shows the diurnal relative humidity variations at each site. The relative humidity of the paddy fields was greater than that of the wetland at almost every time. The minimum difference was 2.7%
(mostly daytime) and the maximum difference was 7% (mostly nighttime). Despite the decreased temperature difference at the two sites, the difference in relative humidity did not narrow at night. This means the relatively weak wind speed in the paddy fields cannot actively transfer the evaporated vapor from the ground to the atmosphere. The relative humidity at the Milyang Weather Station, in an
Fig. 3. Comparison of diurnal relative humidity variations in Upo Wetland, its surrounding the paddy field and Milyang Weather Station.
Fig. 2. Comparison of diurnal temperature variations in Upo Wetland, its surrounding the paddy field and Milyang Weather Station.
urbanized area, was considerably lower than in the wetland. Notably, the difference was up to 20% at night.
To examine vapor pressure in the real condition, the vapor pressure at each sites were shown in Fig. 4.
During the day, the vapor pressure in the paddy field was high and differences of approximately 3 hPa were shown during the daytime and approximately 1 hPa during the nighttime. This is because of the effects of the movement of evaporated vapor due to the horizontal advection of evaporated vapor in the Upo Wetland where wind speed was relatively high; and the low wind speed and the transpiration made by plant growth appeared in the paddy field.
The diurnal wind speed variation at the two sites is shown in Fig. 5. Mild winds of 0.5-1 m/s blew in the wetland from 18LST to 09LST the next morning. The winds became stronger from 09LST, and the strongest wind, approximately 3.5 m/s, blew around 17LST. In the paddy fields, mild winds flowed from 18LST to 09LST the next morning and were similar to those in the wetland, but the strongest winds, approximately 1.6m/s, blew around 17LST on July 21, which is slight weaker than the winds in the wetland.
Because the observation area in the Upo Wetland is wider than that in the paddy fields, the roughness length caused by geographical conditions was smaller than in the paddy fields. Also, the effect of local circulation between the water areas and the land was greater in the wetland, than in the paddy fields.
However, additional studies are required to examine the effects of local circulation between wetland areas
and surrounding areas including mountain areas.
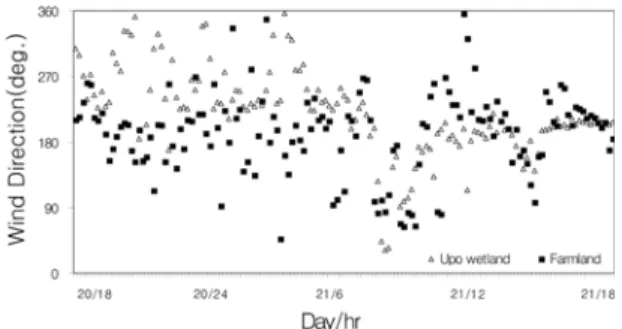
Figure 6 shows the variations of wind direction in the Upo Wetland and the surrounding the paddy fields. The dominant wind direction in the Upo Wetland and the surrounding paddy fields. The dominant wind direction in the wetlands and surrounding areas are northwestern and southern winds at night, respectively. During the day, the two sites had southern wind all the times. As a result, south wind was observed in the farmland for most of the day while north winds and south winds alternated between day and night in Upo Wetland.
Figure 7 shows the surface temperature in the Upo Wetland, the paddy fields and the bare soil. The surface temperature of the paddy fields at night was almost the same as that of the bare soil and the surface temperature of the wetlands was 2-3
oC lower.
In the daytime, the surface temperature of the bare soil was 45-50
oC and the surface temperature of the paddy fields and Upo Wetland was 35-38
oC, more than a 10
oC lower value.
Fig. 5. Diurnal wind speed variations in Upo Wetland and the paddy field.
Fig. 6. Diurnal wind direction variations in Upo Wetland and the paddy field.
Fig. 4. Comparison of vapor pressure variations in Upo Wetland and its surrounding the paddy field.
Heat budget analysis
In the city with its asphalt streets and concrete structures, the solar energy raises the surface temperature due to the small evaporation rate, and a lot of heat transpires into the air and contributes to a higher temperature. On the other hand, in forests and grasslands with abundant evaporation, a significant amount of radiant heat, absorbed by the surface, is consumed by the evaporation and thus the temperature increase is suppressed. This Chapter covered the analysis of the heat balance to check the hourly changes of the thermal environment in the Upo Wetland and paddy fields which were converted areas from a wetland to paddy fields.
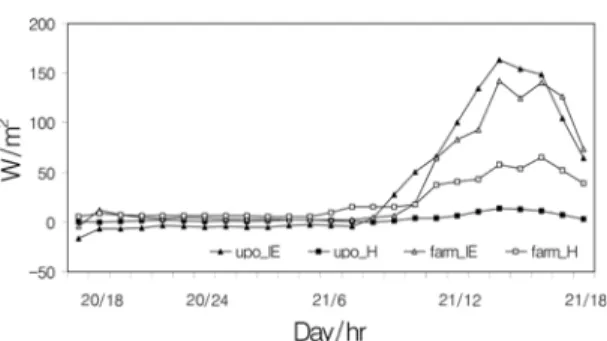
The results of the heat balance analysis are shown as Figure 8, based on the data observed in the Upo Wetland. Heat transportation from the surface of the wetland to the atmosphere was marked as (+) and the opposite was (-). During the field observation period, the solar radiation observed from 10LST to 21LST on
July 21 was 800-870 W/m
2which is the high solar radiation observed on the ground in the middle of a cloudless summer.
Figure 8 shows the heat budget analysis based on observed data in the Upo Wetland and surrounding paddy fields. A sensible heat in the paddy fields is about 50 W/m
2larger than in the Upo Wetland, which has a rare sensible heat release in day time. At night, the heat exchange between the atmosphere and the surface of water is small, while the heat exchange is about 150 W/m
2during the day. Also, most of the daytime heat is spent as latent heat. This means water evaporation is very active state in the Upo Wetland during the day and the surface of the wetland keeps a low temperature through this process.
Figure 9 shows net radiative flux (
Rn) and ground heat flux (
Bs). The
Rn, net radiative flux at the surface, is the sum of net short-wave radiation and downward long-wave radiative energy, and minus the upward long-wave radiative energy (
σ(
Ts, surface temperature)). The plus value and minus value mean toward surface from the atmosphere and vice versa.
The minus value of
Bsmeans that the energy transmits soil layers to the atmosphere at night time.
At Upo wetland, 1/4 of net radiation was consumed in the form of latent heat flux (
lE), and little heat was consumed in the form of sensible heat flux (
H).
Summary and Conclusion
Field observation for analyzing differences in thermal characteristics to the converted areas from a
Ts4
Fig. 7. Comparison of diurnal surface temperature varia- tions in Upo Wetland, its surrounding the paddy field and bare soil.
Fig. 8. Time variations of sensible heat flux (H) and latent heat flux (lE) in Upo Wetland and the paddy field.
Fig. 9. Time variations of net radiative flux (Rn) and ground heat flux (Bs) in Upo Wetland and the paddy field.
wetland to a farmland was conducted in summer with the data from weather tower in Upo Wetland. The results are summarized as follows.
(1) The temperature of Upo Wetland area was 1
oC lower than surrounding area during the day while it was a little higher during the night. This is mainly because thermal capacity of wetland is higher than that of farmland and the water of Upo Wetland actively evaporates than that of farmland.
(2) The maximum wind speed in Upo Wetland area was 3.5 m/s which is stronger than 1.6 m/s of surrounding area. In addition, there was the northerly wind during the day and southerly wind during the night in turn in Upo Wetland area whereas the surrounding area has continuous southerly wind. This is because as part of geographical features, Upo Wetland area was less affected by friction than surrounding farmlands and the shifting wind resulted from the effect of local circulating wind between wetland and land.
(3) The result of heat budget analysis shows that most heat in Upo Wetland was wasted in the form of latent heat rather than sensible heat, which has influence on direct temperature increase. Heat of surrounding area turned out wasted 50 W/m
2more in the form of sensible heat than Upo Wetland.
This process results in the thermal sponge effect where the temperature of Upo Wetland is lower during the day and higher during the night than other areas, showing the climate controlling function of wetland.
In the future, the effect of climate change by reduction of wetland area is to be quantitatively analyzed and evaluated using an atmospheric model.
Acknowledgment
This work was supported by the Korea Science and Engineering Foundation (KOSEF) grant funded by the Korea government(MEST) (R01-2006-000-10104-0).
References
Choi, C.M., Jeong, E.J., and Lee, I.S., 2003, The Flora of
Wetland at Mt. Il-Kwang, Busan. Journal of the Envi- ronmental Sciences, 12, 1227-1233.
Choi, K.S., Hwang, G.S., Kim, D.S., Kim, S.W., Kim, H.J., Joh, S.J., and Park, J.C., 2007, Photosynthetic Charac- teristics and Primary Production by Phytoplankton with Different Water Quality of Influent Open Waters of Constructed Wetlands for Water Treatment. Korean Journal of Limnology, 40, 61-71.
Hur, W.H., Lee, J.N., Lee, I.S., and Woo, Y.T., 1999, Avi- fauna of Nakdong river Estuary and Assessment as a Important Wetland. Algae, 6, 47-56.
Jung, J.S., 2004, Environmental Changes of Wetland Land- scape in the Lower Reach of the Nakdong River in South Eastern Korea. MA. dissertation, Graduate school of Korea National University of Education, Chung- cheongbukdo, Korea, 113 p.
Kim, H.J., Kim, D.S., Yoon, I.H., Lee, D.I., and Kwon, B.H., 2007, Net radiation and Soil Heat Fluxes Mea- sured on Coastal Wetland Covered with Reeds. Journal of the Environmental Sciences, 16, 233-239.
Kim, H.M., 1988, Assessment of Tectonic and Deposi- tional Environments of Naktong Delta, Korea. Journal of Korean Earth Science Society, 9, 45-69.
Kim, Y.J., 2005, Dynamics of Phytoplankton Community in the Open Water Flowed Through the Shihwa Con- structed Wetland from Streams (Banwoul, Donghwa and Samhwa stream). Korean Journal of Limnology, 38, 403-411.
Kondo, J., Kuwagata, T., and Haginoya, S., 1989, Heat budget analysis of nocturnal cooling and daytime heat- ing in a basin. Journal of the Atmospheric Sciences, 46, 2917-2933.
Lee, Y.J., 1999, Wetlands Survey in Kounggi Province.
Kounggi Province, Korea, 163 p.
Monteith, J.L. and Unsworth, M.H., 1990, Principles of environmental Physics. Oregon State University, Corval- lis, USA, 291 p.
Nishizawa, H. and Nishioka, S., 2003, Global warming and Japan-Assessment to nature and human. Kokon Press, Tokyo, Japan, 404 p. (in Japanese)
Rho, P.K., 2007, Spatio-Temporal Dynamics of Estuarine Wetlands Related to Watershed Characteristics in the Han River Estuary. Journal of Korean Geographical Society, 42, 344-354.
Son, M.W. and Jeon, Y.G., 2003, Physical Geographical Characteristics of Natural Wetlands on the Downstream Reach of Nakdong River. Journal of Korean Regional Geography, 9, 66-76.
Sugawara, H. and Kondo, J., 1995, Sensitivity test of urban surface temperature. Tenki, 42, 813-820. (in Japa- nese)
You, H.S., 2001, Geographical Distribution and Environ- ment of the Korean Wetlands-With a special reference
to Mujechi moor on Mt. Cheongjok, Ulsan City, Korea
-. MA dissertation, Graduate school of Kyung-Hee Uni- versity, Seoul, Korea, 129 p.
Manuscript received: July 14, 2009 Revised manuscript received: August 28, 2009 Manuscript accepted: September 9, 2009