ABSTRACT
BACKGROUND: Information regarding left ventricular (LV) volume and left ventricular ejection fraction (LVEF) has major diagnostic and prognostic value when assessing patients after ST-elevation myocardial infarction (STEMI). We aimed to investigate the agreement between measurement of LV volumes and LVEF by three-dimensional echocardiography (3DE), single-photon emission computed tomography (SPECT) and cardiac magnetic resonance (CMR) imaging in patients in a stable phase after STEMI.
METHODS: Fifteen patients underwent examinations by 3DE, SPECT and CMR three months after STEMI.
RESULTS: There was a significant bias in end-diastolic volume (EDV) measured by 3DE (–64 mL, p < 0.001) and SPECT (–55 mL, p < 0.001) compared with that measured by CMR. This was also the case for end-systolic volume (ESV) measured by 3DE (–36 mL, p < 0.001) and SPECT (–28 mL, p < 0.001). No significant differences were found between 3DE and SPECT for EDV or ESV.
However, LVEF did not differ between the three methods. The agreement between all three methods was moderate (intra-class correlation coefficient [ICC] = 0.44) for LV volume and good for LVEF (ICC = 0.72).
CONCLUSIONS: LV volumes assessed by 3DE did not differ from SPECT, and despite larger LV volumes by CMR, measurements of LVEF showed good agreement between all three methods.
Keywords: Left ventricular function; Myocardial infarction;
Three-dimensional echocardiography; Magnetic resonance imaging;
Single-photon emission-computed tomography
INTRODUCTION
It has been shown that increased cardiac volume after a myocardial infarction (MI) is associated with increased mortality1)2) and that the left ventricular ejection fraction (LVEF) is an important determination of survival in patients following MI.3)4) Therefore, information regarding the left ventricular (LV) volume and LVEF after an MI is of great importance for determining the prognosis of patients. Moreover, increased prognostic information can guide further treatment and secondary preventative measures.5-7) LV volume and LVEF can be measured using several techniques, including three-dimensional echocardiography (3DE),
Original Article
Received: Dec 14, 2018 Revised: Jan 20, 2019 Accepted: Mar 31, 2019 Address for Correspondence:
Jonas Jenner, MD
Department of Clinical Physiology, Karolinska University Hospital, SE-17176, Stockholm, Sweden.
E-mail: jonas.jenner@ki.se
*Natalie Beitner and Jonas Jenner contributed equally.
Copyright © 2019 Korean Society of Echocardiography
This is an Open Access article distributed under the terms of the Creative Commons Attribution Non-Commercial License (https://
creativecommons.org/licenses/by-nc/4.0/) which permits unrestricted non-commercial use, distribution, and reproduction in any medium, provided the original work is properly cited.
ORCID iDs Natalie Beitner
https://orcid.org/0000-0003-4516-0836 Jonas Jenner
https://orcid.org/0000-0003-3344-9632 Peder Sörensson
https://orcid.org/0000-0001-5828-0015 Conflict of Interest
The authors have no financial conflicts of interest.
Natalie Beitner , MSc1,2,*, Jonas Jenner , MD1,2,*, and Peder Sörensson , MD, PhD1,3
1Department of Molecular Medicine and Surgery, Karolinska Institute, Stockholm, Sweden
2Department of Clinical Physiology, Karolinska University Hospital, Stockholm, Sweden
3Department of Cardiology, Karolinska University Hospital, Stockholm, Sweden
Comparison of Left Ventricular
Volumes Measured by 3DE, SPECT and
CMR
single-photon emission computed tomography (SPECT) and cardiac magnetic resonance imaging (CMR) depending on the availability of equipment and expert knowledge. CMR is considered the “gold” standard for measuring LV volume and LVEF,8-12) but because all three methods (3DE, SPECT and CMR) are used, both in clinical practice and in research, we sought to determine the level of agreement between them. Previous studies have compared pairs of the above-mentioned methods.13-18) To the best of our knowledge only one study has compared all three methods with regard to these variables.19) That study used the radionuclide thallium and included only patients with a relatively well-preserved LVEF (49% ± 13%). The aim of the present study was to assess the level of agreement between 3DE and SPECT as well as CMR measurements of LV volume and LVEF in patients with prior ST-elevation myocardial infarction (STEMI).
METHODS
Study population
The study population was recruited via a randomized study on patients with a first-time acute STEMI treated with percutaneous coronary intervention, performed at the Karolinska University Hospital.20) From this study population of 89 patients, 15 patients completed interpretable examinations on the same day with 3DE, SPECT and CMR and were included in the present study. Their mean age was 63 ± 9 years (mean ± SD), range 43–79 years, including two women. Their mean height was 177 ± 6 cm and mean weight 86 ± 9 kg. The STEMI was caused by occlusion of the left anterior descending artery in seven (47%) of the patients, the right coronary artery in six (40%) and in the left circumflex artery in two (13%).
Written informed consent was given by all patients included in the study, which was approved by the local hospital radiation protection committee and by the Regional Ethics Review Board in Stockholm.
Data collection and analysis
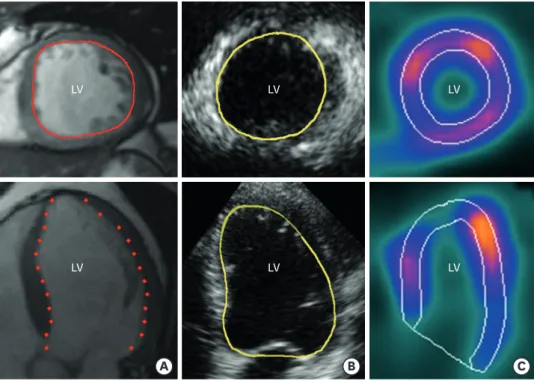
All 15 patients underwent examinations by 3DE, SPECT and CMR on the same day, 90 (± 10) days post infarction. Data acquisition and analyses were performed blinded to all other data by experts in each field. The intra- and inter-observer reliability was studied in 10 randomly selected patients. The volume calculations for these patients were performed twice by the same observer, and once by a second observer. The two observers were blinded to each other's findings. Examples of endocardial tracings by all three modalities are presented in Figure 1.
3DE
Transthoracic 3DE examinations were performed by an experienced sonographer using a commercial ultrasound scanner (Philips iE33, Philips Medical Systems, Andover, MA, USA).
The images were obtained using a 3DE transducer (X3-1, Philips) with the patient in the left lateral decubitus position. The images were acquired from the apical transducer position through four or seven consecutive cardiac cycles during breath-hold, generating a full-volume pyramidal data set with an average frame rate of 21/s.
The 3DE data were analysed offline using the semi-automatic software QLab 8.1 (Philips).
The long-axis and rotational angle of two orthogonal planes were adjusted to yield a four- chamber view and a two-chamber view. The end-diastolic (first frame) and end-systolic (smallest cavity) frames were identified and five points were then manually placed in the
two frames adjacent to the lateral, medial, anterior and inferior part of the mitral valve annulus and one point in the apex. Subsequently, the endocardial surface was outlined using an automated contour-detection algorithm. The surface was examined in multiple sagittal and transverse planes and was manually adjusted as necessary. The LV outflow tract (LVOT) was excluded from the volume calculations, but papillary muscles and trabeculations were included in the LV volumes when visible. The volume enclosed by the generated surface was computed by the program, yielding the EDV and ESV for each data set. LVEF was calculated using the standard formula.
SPECT
Patients received an injection of 600 Mbq of 99mTc sestamibi (Cardiolite®, Lantheus MI UK Ltd) intravenously at rest. The patients had not eaten or drunk any caffeine-containing beverages for 4 h prior to the injection. ECG-gated images were acquired 1–4 h after the injection using a dual-head gamma camera (DST-XL, Sopha Medical Vision, Bue Cedex, France). The patients were placed in the supine position and imaged in steps of 5.6° using a 64 × 64 matrix, with a typical size of 5 × 5 mm and a slice thickness of 5 mm. A 20% energy window and 140 keV photo peak were used. Images were gated at eight frames per cardiac cycle using an R-wave trigger, and 60 s per projection over a 180° orbit. Total acquisition time was 16 min. No attenuation or scatter correction was applied. The frame rate of the gated images varied with the heart rate of the subjects. The heart rate during SPECT was not recorded, however using the heart rate data from the 3DE studies the average frame rate was estimated to 8.1 /s.
The SPECT images were reconstructed and analysed offline on a Vision workstation (IBM RS/6000) using the automated and commercially available software program Quantitative
A B C
LV LV LV
LV LV
LV
Figure 1. Examples of short-axis (top) and long axis (bottom) cut planes with endocardial tracings in images acquired by CMR (A), 3DE (B) and SPECT (C) demonstrating the difference in the ability to identify LV
trabeculations. All images are acquired from the same study patient. Traces are somewhat enhanced to increase readability. 3DE: three-dimensional echocardiography, CMR: cardiac magnetic resonance imaging, LV: left ventricle, SPECT: single-photon emission computed tomography.
Gated SPECT (QGS; Cedars-Sinai Health System, Los Angeles, CA, USA). Reconstruction was performed with a filtered back-projection using a Wiener filter with a power of 4.5. The reconstructed voxel size was 3 × 3 × 3 mm.
Papillary muscles were included in the LV volume. The LVOT was excluded from the LV volume, since it is not visible with the SPECT technique.
CMR
The CMR studies were performed using a 1.5 Tesla CMR system (Signa Excite Twin Speed, General Electric Healthcare, Waukesha, WI, USA) and a phased-array radiofrequency receiver (8-channel) cardiac coil. ECG-gated images were acquired during end-expiratory breath holding. The image protocol included scout images, localization of the short axis and then coverage of the whole LV with retrospectively gated cine steady-state free precession images.
Ten to 12 short-axis views and 2-, 3- and 4-chamber views were obtained. The following scanner parameters were used: echo time (TE) 1.58 ms, repetition time (TR) 3.61 ms, flip angle 60°, 25 phases, 8-mm slice, matrix 226 × 226. All CMR images were analysed offline using semi-automatic freely available segmentation software (Segment V.1.8 R1405).21) In the short-axis images, end-systolic volume (ESV) and end-diastolic volume (EDV) were measured in the phase that had the largest and smallest LV volumes, respectively. The LVOT, papillary muscles and trabeculations were included in the LV. The basal short axis slice was identified by simultaneously observing long axis views of the LV while performing the tracings, specifically the three chamber view where the LVOT is visible.
Statistical analysis
To evaluate the agreement between the three methods, Bland–Altman plots were generated.
One-way repeated-measures analysis of variance (ANOVA) was used to determine whether there were any systematic differences between the methods. An intra-class correlation coefficient (ICC) was calculated to evaluate the agreement between the methods for measurement of LV volume and LVEF. The strength of agreement was assessed according to guidelines proposed by Landis and Koch,22) which define agreement as poor (ICC < 0.20), fair (ICC 0.21–0.40), moderate (ICC 0.41–0.60), good (ICC 0.61–0.80), or very good (ICC
> 0.80). Linear regression analysis was performed to evaluate the correlation between LV volumes and LVEF assessed by CMR and SPECT and CMR and 3DE. No linear regression was performed between SPECT and 3DE, because neither of these methods is considered gold standard. The correlation coefficient β was used for the linear regression analysis.
The following guidelines proposed by Chan23) were used to assess the strength of the linear relationship: poor (β < 0.3), fair (β 0.3–0.5), moderately strong (β 0.6–0.8), and very strong (β ≥ 0.8). To study the intra-/inter-observer reliability, the ICC and the coefficient of variation (CV) were calculated. One-way repeated-measures ANOVA was also used to analyse whether there were any systematic differences between the measurements. The level of significance was set at p < 0.05. Statistical analysis was performed using Statistica (Statsoft Inc., version 9.0–10.0, Tulsa, OK, USA) and IBM SPSS Statistics Version 24 (IBM Corp., Armonk, NY, USA).
RESULTS
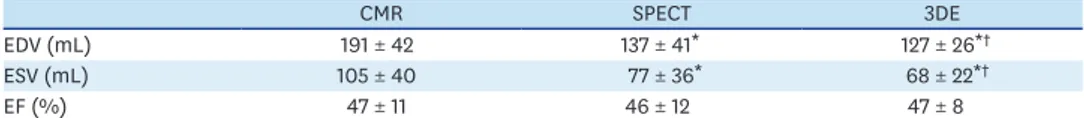
LV volumes and LVEF measured by 3DE, SPECT and CMR are presented in Table 1. Figures 2-4 show the agreement between the three methods for measurements of ESV, EDV and LVEF.
End-diastolic volumes
EDV measured by the three methods differed significantly (p < 0.001). Both SPECT and 3DE underestimated EDV (55 ± 33 mL, p < 0.001 and 64 ± 47 mL, p < 0.001, respectively), compared with CMR (Figure 2A, B). No significant difference was demonstrated between SPECT and 3DE (9 ± 55 mL, p = 0.23) (Figure 2C).
The agreement was good between SPECT and 3DE (ICC = 0.66) and moderate between CMR and SPECT (ICC = 0.49). Agreement between all three methods was moderate (ICC = 0.43) Table 1. LV volumes and LVEF for each method, presented as mean ± SD (n = 15)
CMR SPECT 3DE
EDV (mL) 191 ± 42 137 ± 41* 127 ± 26*†
ESV (mL) 105 ± 40 77 ± 36* 68 ± 22*†
EF (%) 47 ± 11 46 ± 12 47 ± 8
3DE: three-dimensional echocardiography, CMR: cardiac magnetic resonance, EDV: end-diastolic volume, EF: ejection fraction, ESV: end-systolic volume, LV: left ventricular, LVEF: left ventricular ejection fraction, SPECT:
single-photon emission computed tomography.
*p < 0.001 for SPECT and 3DE versus CMR; †p > 0.1 for 3DE versus SPECT.
150
80
EDV difference CMR-SPECT (mL)
−100
−150 0
260 220
200 240
180 160 140 120
A
100
Mean EDV (mL) 100
−50 50
150
60
EDV difference SPECT-3DE (mL)
−100
−150 0
200
160 180
140 120 100
C
80
Mean EDV (mL) 100
−50 50
150
80
EDV difference CMR-3DE (mL)
−100
−150 0
220 200 180 160 140 120
B
100
Mean EDV (mL) 100
−50 50
Figure 2. Bland–Altman plot of agreement between CMR and SPECT (A), CMR and 3DE (B) and SPECT and 3DE (C) for measurement of EDV. The solid line represents the mean difference, and the dashed lines represent the 95% confidence interval. 3DE: three-dimensional echocardiography, CMR: cardiac magnetic resonance imaging, EDV: end-diastolic volume, SPECT: single-photon emission computed tomography.
and that between CMR and 3DE was fair (ICC = 0.28). The linear regression analysis showed that for EDV, the correlations between CMR and SPECT and between CMR and 3DE were very strong (β = 0.92, p < 0.001, and β = 0.84, p < 0.001, respectively).
End-systolic volumes
There was a significant difference between the three methods (p < 0.001) for measurement of ESV. Both SPECT and 3DE underestimated ESV (28 ± 30 mL, p < 0.001 and 36 ± 49 mL, p < 0.001, respectively), compared with CMR (Figure 3A, B). No significant difference was demonstrated between SPECT and 3DE (9 ± 51 mL, p = 0.22) (Figure 3C). The agreement between CMR and SPECT and between SPECT and 3DE was good (ICC = 0.73 and 0.62, respectively), and that between CMR and 3DE was moderate (ICC = 0.44). The agreement between all three methods was moderate (ICC = 0.60). The linear regression analysis showed very strong correlations between CMR and SPECT and between CMR and 3DE (β = 0.93, p < 0.001, and β = 0.82, p < 0.001, respectively).
100
20
ESV difference CMR-SPECT (mL)
−100 0
180 160 140 120
A
100 80 60 40
Mean ESV (mL)
−50 50
100
20
ESV difference SPECT-3DE (mL)
−100 0
130 110 120 100
90 80 70
C
60 50 30 40
Mean ESV (mL)
−50 50
150
20
ESV difference CMR-3DE (mL)
−100
−150 0
160 140 120
B
100 80 60 40
Mean ESV (mL) 100
−50 50
Figure 3. Bland–Altman plot of agreement between CMR and SPECT (A), CMR and 3DE (B) and SPECT and 3DE (C) for measurement of ESV. The solid line represents the mean difference, and the dashed lines represent the 95% confidence interval. 3DE: three-dimensional echocardiography, CMR: cardiac magnetic resonance imaging, ESV: end-systolic volume, SPECT: single-photon emission computed tomography.
Left ventricular ejection fraction
There was no significant difference between the LVEF measured by the three methods (p = 0.82) (Figure. 4A-C). The mean difference between CMR and SPECT for LVEF was 0.75 ± 10%, that between CMR and 3DE was –0.56 ± 15%, and between SPECT and 3DE was –1.3 ± 20%. The agreement was very good between CMR and SPECT (ICC = 0.89), good between CMR and 3DE and between all three methods (ICC = 0.71 and 0.72, respectively), moderate between SPECT and 3DE (ICC = 0.51). The linear regression analysis showed that the agreement for LVEF was very strong between CMR and SPECT (β = 0.90, p < 0.001) and moderately strong between CMR and 3DE (β = 0.72, p = 0.003).
Intra-/inter-observer reliability 3DE
There was no significant difference in the intra-observer reliability of measurements of ESV (p = 0.73). However, there was a significant difference between the inter-observer reliability of ESV measurements (p = 0.04). No significant difference was observed between the intra- and inter-observer reliability of measurements of EDV (p = 0.54 and 0.10, respectively) or 30
25
LVEF difference CMR-SPECT
−30 10
0
70 65 60 55
A
50 45 40 35 30
Mean LVEF (%)
−10
−20 20
30
25
LVEF difference SPECT-3DE
−30 0
65
55 60
50 45 40 35
C
30
Mean LVEF (%)
−10
−20 10 20
30
25
LVEF difference CMR-3DE
−20
−30 0
65 60 55
B
50 45 40 35 30
Mean LVEF (%) 20
−10 10
Figure 4. Bland–Altman plot of agreement between CMR and SPECT (A), CMR and 3DE (B) and SPECT and 3DE (C) for measurement of LVEF. The solid line represents the mean difference, and the dashed lines represent the 95% confidence interval. 3DE: three-dimensional echocardiography, CMR: cardiac magnetic resonance imaging, LVEF: left ventricular ejection fraction, SPECT: single-photon emission computed tomography.
LVEF (p = 0.40 and 0.13, respectively). The intra-/inter-observer reliability of 3DE as assessed by ICC and CV is shown in Table 2. The intra-observer reliability was very good for all the studied variables (ICC = 0.86–0.95) and the CVs ranged from 7.3% to 8.3%. Inter-observer reliability was good for EDV (ICC = 0.70), and moderate for ESV and LVEF (ICC = 0.54 and 0.41, respectively). The CVs ranged from 14% to 27%.
SPECT
There was no significant difference between the intra- and inter-observer reliability of measurements of ESV (p = 0.37 and 0.32), EDV (p = 0.35 and 0.86) or LVEF (p = 0.39 and 0.10), respectively. The ICC and CV for SPECT for intra-/inter-observer reliability are shown in Table 2. Both intra- and inter-observer reliability was very good for all the studied variables (ICC = 0.88–1.00). The CV ranged from 1.5% to 2.0% for intra-observer reliability and from 1.2% to 1.8% for inter-observer reliability.
CMR
There was no significant difference between the intra- and inter-observer reliability of measurements of ESV (p = 0.83 and 0.81, respectively), EDV (p = 0.58 and 0.58, respectively) or LVEF (p = 0.56 and 0.60, respectively). The ICC and CV for intra-/inter-observer reliability of CMR are shown in Table 2. Both intra- and inter-observer reliability were very good for all the studied variables (ICC= 0.99–1.00). For intra-observer reliability, the CV ranged from 1.6% to 3.0%, while that for inter-observer reliability ranged from 2.0% to 3.6%.
DISCUSSION
This study showed that in post-STEMI patients, there was a significant difference between the three imaging methods for measurements of LV volumes, but not for LVEF. Both 3DE and SPECT underestimated the LV volumes compared with CMR. Although the degree of underestimation was somewhat less by SPECT, there was no significant difference between LV volumes assessed by SPECT and 3DE.
Underestimation of LV volumes by 3DE and SPECT compared with CMR has been reported previously.16)17)19)24)25) One explanation for the underestimation of volume by SPECT is that the Table 2. Intra- and inter-observer reliability for 3DE, SPECT and CMR
Intra-observer Inter-observer
ICC CV (%) ICC CV (%)
3DE
ESV 0.95 7.44 0.54 26.6
EDV 0.92 7.34 0.66 14.2
EF 0.86 8.27 0.55 15.3
SPECT
ESV 1.00 2.0 1.00 1.76
EDV 1.00 1.46 1.00 1.57
EF 1.00 1.55 1.00 1.20
CMR
ESV 1.00 2.91 0.99 3.60
EDV 0.99 1.62 0.99 1.96
EF 0.99 2.96 0.99 2.90
3DE: three-dimensional echocardiography, CMR: cardiac magnetic resonance imaging, CV: coefficient of variation, EDV: end-diastolic volume, ESV: end-systolic volume, ICC: intra-class correlation, LVEF: left ventricular ejection fraction, SPECT: single-photon emission computed tomography.
LVOT is not included in the calculation with SPECT, whereas with CMR, the LVOT is normally included in the LV volume. Also, the higher image resolution of CMR allows for better visualization of the border between endocardial trabeculations and the LV cavity.17)24)26)27)
Previous studies have concluded that the underestimation of LV volumes by SPECT compared with CMR is greater in patients with smaller LV volumes, because of problems with spatial resolution and scatter.19) No such pattern could be seen in this study; however, the number of patients included in our study may not be adequate to detect such a difference.
Similarly, the underestimation by 3DE could be explained by differences in image quality and in the volume calculations. The trabeculations are not always included in the 3DE volume calculations, because the spatial resolution is inadequate to allow differentiation of the myocardium from smaller trabeculations. In this study, the LVOT was not included in the 3DE volume calculations, but, when visible, trabeculations and papillary muscles were included.
As seen in Figure 1 trabeculations are more discernible in the CMR image than in the other two modalities. One of the problems with using 3DE clinically is that the image quality is dependent on the patient's body composition, the acoustic window and on the experience of the operator.28) One way to increase the spatial resolution in 3DE images is by using contrast agents, thereby improving delineation of the endocardial border.16)29)30) Studies comparing measurement of LV volumes by 3DE and CMR have shown that volume measurements are equivalent to those measured by CMR when they are calculated from contrast-enhanced 3DE, whereas LV volumes acquired from non-contrast-enhanced 3DE are slightly underestimated compared with CMR.29)31) Clearly, the image quality is a major factor in the observed differences in acquired volumes.
In a study by Chan et al.19), the degree of underestimation of LV volumes compared with CMR was less severe with 3DE than with SPECT, whereas in this study the underestimation was greater with 3DE than with SPECT. One reason for this could be the use of different analysis software, since they performed volumetric analysis using software that includes LVOT in the contour tracing.
The high reproducibility of measurements in SPECT was most likely because we used the automatic software QGS, leading to a reduced risk of subjective analysis. Similar findings regarding intra-/inter-observer reliability in SPECT have been reported in other studies.19) The weaker inter-observer reliability for 3DE was probably because the analysis was semi- automatic, which increased the risk of subjective influence. In other studies, the inter- observer reliability for 3DE has been slightly better than that observed in our study.19)32) One reason for the poorer inter-observer reliability for 3DE in our study could be the factors discussed above, i.e., that the technique is operator dependent and that we analysed a smaller number of subjects.
For CMR, the results in our study are in line with those of other studies. Bellenger et al.33) reported very good intra-/inter-observer reliability for measurements of LV volume and LVEF (r = 0.95–0.99). Another study by Soneson et al.34) also found the intra-/inter-observer reliability for LV volumes and LVEF to be good (CV = 6% and 3%, respectively). Despite the volume calculations in CMR involving manual delineation using a semi-automatic software program, the intra- and inter-observer reliability seem to be similar to those for SPECT, where an automated software program is used to perform the volume calculations. This is likely because of the technique's high spatial resolution and the excellent contrast between blood and myocardium, which makes it easier to define the endocardial border.
Clearly the differences in LV volume determinations are not only caused by inherent differences between the imaging modalities. The specific analysis software used may also contribute to the discrepancies, which in turn may limit the generalization when other software is applied. One limitation with this study was that the study population was small.
Some patients were excluded because of poor image quality in the echocardiographic study, and possibly a larger number of 3DE images would have been interpretable if a contrast agent had been used for the 3DE examination.
A strength of this study is that we used the radionuclide technetium, instead of thallium.
Technetium-labeled substances have several advantages compared with thallium-labeled ones, including a shorter half-life (6 h compared to 72 h for thallium), which reduces the patient's radiation exposure. Technetium is also less likely to cause attenuation, because of its lower photon energy. Furthermore, thallium has been reported to have higher variability than technetium.9) Another strength with this study is that all three examinations were carried out on the same day, in order to minimize the risk for possible physiological day-to- day changes.
Conclusion
Comparison of 3DE and SPECT with CMR showed that there is a significant difference between the methods for measurement of the LV volumes, and that both 3DE and SPECT underestimate the LV volumes compared with CMR. Despite the differences between the three methods for the measurement of LV volumes, the determination of LVEF showed good agreement between all three methods.
ACKNOWLEDGMENTS
The study was funded by the Swedish Heart Lung Foundation and Stockholm County Council. We would like to thank Elisabeth Berg, MSc, Medical Statistics Unit–LIME, Karolinska Institutet, for valuable statistical support. We also thank Diana Bone, PhD, Department of Clinical Physiology, Karolinska University Hospital, for technical support regarding SPECT and Margareta Ring, PhD, for support with the statistical presentation.
We also express our appreciation to the Department of Cardiology, Karolinska University Hospital for access to the study patients. Technical resources were kindly provided by the Department of Clinical Physiology at Karolinska University Hospital.
REFERENCES
1. Eriksson SV, Caidahl K, Hamsten A, de Faire U, Rehnqvist N, Lindvall K. Long-term prognostic significance of M mode echocardiography in young men after myocardial infarction. Br Heart J 1995;74:124-30.
PUBMED | CROSSREF
2. Galderisi M, Lauer MS, Levy D. Echocardiographic determinants of clinical outcome in subjects with coronary artery disease (the Framingham Heart Study). Am J Cardiol 1992;70:971-6.
PUBMED | CROSSREF
3. Funaro S, La Torre G, Madonna M, et al. Incidence, determinants, and prognostic value of reverse left ventricular remodelling after primary percutaneous coronary intervention: results of the Acute Myocardial Infarction Contrast Imaging (AMICI) multicenter study. Eur Heart J 2009;30:566-75.
PUBMED | CROSSREF
4. Sheehan FH, Doerr R, Schmidt WG, et al. Early recovery of left ventricular function after thrombolytic therapy for acute myocardial infarction: an important determinant of survival. J Am Coll Cardiol 1988;12:289-300.
PUBMED | CROSSREF
5. Carstensen S, Bonarjee VV, Berning J, Edner M, Nilsen DW, Caidahl K. Effects of early enalapril treatment on global and regional wall motion in acute myocardial infarction. CONSENSUS II Multi Echo Study Group. Am Heart J 1995;129:1101-8.
PUBMED | CROSSREF
6. Ibanez B, James S, Agewall S, et al. 2017 ESC Guidelines for the management of acute myocardial infarction in patients presenting with ST-segment elevation: The Task Force for the management of acute myocardial infarction in patients presenting with ST-segment elevation of the European Society of Cardiology (ESC). Eur Heart J 2018;39:119-77.
PUBMED | CROSSREF
7. Pfeffer MA, Braunwald E, Moyé LA, et al. Effect of captopril on mortality and morbidity in patients with left ventricular dysfunction after myocardial infarction. Results of the survival and ventricular enlargement trial. The SAVE Investigators. N Engl J Med 1992;327:669-77.
PUBMED | CROSSREF
8. Alfakih K, Reid S, Jones T, Sivananthan M. Assessment of ventricular function and mass by cardiac magnetic resonance imaging. Eur Radiol 2004;14:1813-22.
PUBMED | CROSSREF
9. Ioannidis JP, Trikalinos TA, Danias PG. Electrocardiogram-gated single-photon emission computed tomography versus cardiac magnetic resonance imaging for the assessment of left ventricular volumes and ejection fraction: a meta-analysis. J Am Coll Cardiol 2002;39:2059-68.
PUBMED | CROSSREF
10. Mesquita CT, Pessoa MC, Vasconcelos PP, et al. Ventricular function following coronary artery bypass grafting: comparison between gated SPECT and cardiac magnetic resonance imaging. Arq Bras Cardiol 2009;92:327-33, 344-50, 357-63.
PUBMED
11. Paul AK, Nabi HA. Gated myocardial perfusion SPECT: basic principles, technical aspects, and clinical applications. J Nucl Med Technol 2004;32:179-87; quiz 188-9.
PUBMED
12. Pennell DJ. Ventricular volume and mass by CMR. J Cardiovasc Magn Reson 2002;4:507-13.
PUBMED | CROSSREF
13. Jenkins C, Bricknell K, Chan J, Hanekom L, Marwick TH. Comparison of two- and three-dimensional echocardiography with sequential magnetic resonance imaging for evaluating left ventricular volume and ejection fraction over time in patients with healed myocardial infarction. Am J Cardiol 2007;99:300-6.
PUBMED | CROSSREF
14. Kawai J, Tanabe K, Morioka S, Shiotani H. Rapid freehand scanning three-dimensional
echocardiography: accurate measurement of left ventricular volumes and ejection fraction compared with quantitative gated scintigraphy. J Am Soc Echocardiogr 2003;16:110-5.
PUBMED | CROSSREF
15. Lipiec P, Wejner-Mik P, Krzemińska-Pakuła M, et al. Gated 99mTc-MIBI single-photon emission computed tomography for the evaluation of left ventricular ejection fraction: comparison with three- dimensional echocardiography. Ann Nucl Med 2008;22:723-6.
PUBMED | CROSSREF
16. Mannaerts HF, Van Der Heide JA, Kamp O, et al. Quantification of left ventricular volumes and ejection fraction using freehand transthoracic three-dimensional echocardiography: comparison with magnetic resonance imaging. J Am Soc Echocardiogr 2003;16:101-9.
PUBMED | CROSSREF
17. Persson E, Carlsson M, Palmer J, Pahlm O, Arheden H. Evaluation of left ventricular volumes and ejection fraction by automated gated myocardial SPECT versus cardiovascular magnetic resonance. Clin Physiol Funct Imaging 2005;25:135-41.
PUBMED | CROSSREF
18. Tighe DA, Rosetti M, Vinch CS, et al. Influence of image quality on the accuracy of real time three- dimensional echocardiography to measure left ventricular volumes in unselected patients: a comparison with gated-SPECT imaging. Echocardiography 2007;24:1073-80.
PUBMED | CROSSREF
19. Chan J, Jenkins C, Khafagi F, Du L, Marwick TH. What is the optimal clinical technique for measurement of left ventricular volume after myocardial infarction? A comparative study of 3-dimensional
echocardiography, single photon emission computed tomography, and cardiac magnetic resonance imaging. J Am Soc Echocardiogr 2006;19:192-201.
PUBMED | CROSSREF
20. Sörensson P, Saleh N, Bouvier F, et al. Effect of postconditioning on infarct size in patients with ST elevation myocardial infarction. Heart 2010;96:1710-5.
PUBMED | CROSSREF
21. Heiberg E, Sjögren J, Ugander M, Carlsson M, Engblom H, Arheden H. Design and validation of Segment- -freely available software for cardiovascular image analysis. BMC Med Imaging 2010;10:1.
PUBMED | CROSSREF
22. Landis JR, Koch GG. The measurement of observer agreement for categorical data. Biometrics 1977;33:159-74.
PUBMED | CROSSREF
23. Chan YH. Biostatistics 104: correlational analysis. Singapore Med J 2003;44:614-9.
PUBMED
24. Mor-Avi V, Jenkins C, Kühl HP, et al. Real-time 3-dimensional echocardiographic quantification of left ventricular volumes: multicenter study for validation with magnetic resonance imaging and investigation of sources of error. JACC Cardiovasc Imaging 2008;1:413-23.
PUBMED | CROSSREF
25. Mistry N, Halvorsen S, Hoffmann P, et al. Assessment of left ventricular function with magnetic resonance imaging vs. echocardiography, contrast echocardiography, and single-photon emission computed tomography in patients with recent ST-elevation myocardial infarction. Eur J Echocardiogr 2010;11:793-800.
PUBMED
26. Bavelaar-Croon CD, Kayser HW, van der Wall EE, et al. Left ventricular function: correlation of quantitative gated SPECT and MR imaging over a wide range of values. Radiology 2000;217:572-5.
PUBMED | CROSSREF
27. Thorley PJ, Plein S, Bloomer TN, Ridgway JP, Sivananthan UM. Comparison of 99mTc tetrofosmin gated SPECT measurements of left ventricular volumes and ejection fraction with MRI over a wide range of values. Nucl Med Commun 2003;24:763-9.
PUBMED | CROSSREF
28. Binder T. Three-dimensional echocardiography: principles and promises. J Clin Basic Cardiol 2002;5:149-52.
29. Johri AM, Passeri JJ, Picard MH. Three dimensional echocardiography: approaches and clinical utility.
Heart 2010;96:390-7.
PUBMED | CROSSREF
30. Mor-Avi V, Lang RM. The use of real-time three-dimensional echocardiography for the quantification of left ventricular volumes and function. Curr Opin Cardiol 2009;24:402-9.
PUBMED | CROSSREF
31. Thavendiranathan P, Grant AD, Negishi T, Plana JC, Popović ZB, Marwick TH. Reproducibility of echocardiographic techniques for sequential assessment of left ventricular ejection fraction and volumes:
application to patients undergoing cancer chemotherapy. J Am Coll Cardiol 2013;61:77-84.
PUBMED | CROSSREF
32. Jenkins C, Bricknell K, Hanekom L, Marwick TH. Reproducibility and accuracy of echocardiographic measurements of left ventricular parameters using real-time three-dimensional echocardiography. J Am Coll Cardiol 2004;44:878-86.
PUBMED | CROSSREF
33. Bellenger NG, Davies LC, Francis JM, Coats AJ, Pennell DJ. Reduction in sample size for studies of remodeling in heart failure by the use of cardiovascular magnetic resonance. J Cardiovasc Magn Reson 2000;2:271-8.
PUBMED | CROSSREF
34. Soneson H, Ubachs JF, Ugander M, Arheden H, Heiberg E. An improved method for automatic segmentation of the left ventricle in myocardial perfusion SPECT. J Nucl Med 2009;50:205-13.
PUBMED | CROSSREF