The Shape of the Oral Glucose Tolerance Test-Glucose Response Curve in Islet Cell Antibody-Positive vs.
-Negative Obese Youth Clinically Diagnosed with Type 2 Diabetes
Joon Young Kim
1,*, Hala Tfayli
2, Fida Bacha
3, Silva Arslanian
4,51Department of Exercise Science, David B. Falk College of Sport and Human Dynamics, Syracuse University, Syracuse, New York, NY, USA; 2Department of Pediatrics and Adolescent Medicine, American University of Beirut Medical Center, Beirut, Lebanon; 3Children’s Nutrition Research Center, Baylor College of Medicine, Houston, TX; 4Center for Pediatric Research in Obesity and Metabolism, UPMC Children’s Hospital of Pittsburgh, Pittsburgh, PA; 5Division of Pediatric Endocrinology, Metabolism and Diabetes Mellitus, UPMC Children’s Hospital of Pittsburgh, Pittsburgh, PA, USA
Background: The oral glucose tolerance test (OGTT)-glucose response curves (GRCs; incessant increase, monophasic, and biphasic) reflect insulin sensitivity and β-cell function, being worse in the former and superior in the latter. Here, we examined if the OGTT-GRC pattern is worse in obese antibody (glutamic acid decarboxyl- ase 65-kDa [GAD65] and insulinoma-associated protein-2 [IA-2])-positive (Ab+) vs. –negative (Ab–) youth clini- cally diagnosed with type 2 diabetes (CDX-T2D).
Methods: Forty-seven obese youth, 15 Ab+ and 32 Ab–, were divided into three OGTT-GRC groups: incessant increase, monophasic, and biphasic. The prevalence of OGTT-GRC, clamp-measured insulin sensitivity, and β-cell function was compared.
Results: Incessant increase OGTT-GRC is the most frequent curve type and is three-fold higher in Ab+ vs. Ab– youth CDX-T2D. In Ab+ youth, there was up to 40% lower second-phase insulin secretion in the incessant in- crease group vs. the other two groups combined (monophasic and biphasic). In Ab– youth, while first- and sec- ond-phase insulin secretion was significantly lower in the incessant increase vs. the other two groups combined, overall β-cell function was less impaired than in Ab+ youth. In neither Ab– or Ab+ youth was OGTT-GRC related to hepatic or peripheral insulin sensitivity.
Conclusion: Severe insulin deficiency, a characteristic of type 1 diabetes, seems to be related to higher preva- lence of incessant increase in Ab+ vs. Ab– obese youth.
Key words: Oral glucose tolerance test, Glucose intolerance, Insulin resistance, Insulin secretion, Type 2 diabe- tes mellitus, Obesity, Adolescent
Received August 25, 2020 Reviewed March 17, 2021 Accepted March 26, 2021
* Corresponding author Joon Young Kim
https://orcid.org/0000-0003-0448-1684 Department of Exercise Science, David B.
Falk College of Sport and Human Dynamics, Syracuse University, Women’s Building 204E, 820 Comstock Ave, Syracuse, NY 13244, USA Tel: +1-315-443-1411 Fax: +1-315-443-9375 E-mail: [email protected]
INTRODUCTION
In non-diabetic youth, the shape of the glucose response curve (GRC) during an oral glucose tolerance test (OGTT) portends the metabolic risk for type 2 diabetes, such that individuals with a monophasic-GRC have lower in vivo insulin sensitivity and β-cell
function than those with a biphasic-GRC independent of fasting and 2-hour glucose concentrations.
1While continuous increase in plasma glucose concentration during the 2-hour OGTT (i.e., inces- sant increase-GRC) is rare in non-diabetic obese youth, a recent TODAY (Treatment Options for Type 2 Diabetes in Adolescents and Youth) investigation of the OGTT-GRC showed a 22% preva-
Copyright © 2021 Korean Society for the Study of Obesity
This is an Open Access article distributed under the terms of the Creative Commons Attribution Non-Commercial License (https://creativecommons.org/licenses/by-nc/4.0/) which permits unrestricted non-commercial use, distribution, and reproduction in any medium, provided the original work is properly cited.
eISSN 2508-7576
2017-03-16 https://crossmark-cdn.crossref.org/widget/v2.0/logos/CROSSMARK_Color_square.svg
Short Communication
The Shape of the Oral Glucose Tolerance Test-Glucose Response Curve in Islet Cell Antibody-Positive vs.
-Negative Obese Youth Clinically Diagnosed with Type 2 Diabetes
Joon Young Kim
1,*, Hala Tfayli
2, Fida Bacha
3, Silva Arslanian
4,51Department of Exercise Science, David B. Falk College of Sport and Human Dynamics, Syracuse University, Syracuse, New York, NY, USA; 2Department of Pediatrics and Adolescent Medicine, American University of Beirut Medical Center, Beirut, Lebanon; 3Children’s Nutrition Research Center, Baylor College of Medicine, Houston, TX; 4Center for Pediatric Research in Obesity and Metabolism, UPMC Children’s Hospital of Pittsburgh, Pittsburgh, PA; 5Division of Pediatric Endocrinology, Metabolism and Diabetes Mellitus, UPMC Children’s Hospital of Pittsburgh, Pittsburgh, PA, USA
Background: The oral glucose tolerance test (OGTT)-glucose response curves (GRCs; incessant increase, monophasic, and biphasic) reflect insulin sensitivity and β-cell function, being worse in the former and superior in the latter. Here, we examined if the OGTT-GRC pattern is worse in obese antibody (glutamic acid decarboxyl- ase 65-kDa [GAD65] and insulinoma-associated protein-2 [IA-2])-positive (Ab+) vs. –negative (Ab–) youth clini- cally diagnosed with type 2 diabetes (CDX-T2D).
Methods: Forty-seven obese youth, 15 Ab+ and 32 Ab–, were divided into three OGTT-GRC groups: incessant increase, monophasic, and biphasic. The prevalence of OGTT-GRC, clamp-measured insulin sensitivity, and β-cell function was compared.
Results: Incessant increase OGTT-GRC is the most frequent curve type and is three-fold higher in Ab+ vs. Ab– youth CDX-T2D. In Ab+ youth, there was up to 40% lower second-phase insulin secretion in the incessant in- crease group vs. the other two groups combined (monophasic and biphasic). In Ab– youth, while first- and sec- ond-phase insulin secretion was significantly lower in the incessant increase vs. the other two groups combined, overall β-cell function was less impaired than in Ab+ youth. In neither Ab– or Ab+ youth was OGTT-GRC related to hepatic or peripheral insulin sensitivity.
Conclusion: Severe insulin deficiency, a characteristic of type 1 diabetes, seems to be related to higher preva- lence of incessant increase in Ab+ vs. Ab– obese youth.
Key words: Oral glucose tolerance test, Glucose intolerance, Insulin resistance, Insulin secretion, Type 2 diabe- tes mellitus, Obesity, Adolescent
Received August 25, 2020 Reviewed March 17, 2021 Accepted March 26, 2021
* Corresponding author Joon Young Kim
https://orcid.org/0000-0003-0448-1684 Department of Exercise Science, David B.
Falk College of Sport and Human Dynamics, Syracuse University, Women’s Building 204E, 820 Comstock Ave, Syracuse, NY 13244, USA Tel: +1-315-443-1411 Fax: +1-315-443-9375 E-mail: [email protected]
lence of incessant increase-GRC in obese youth with type 2 diabe- tes.
2Furthermore, this incessant increase-GRC was indicative of severe metabolic dysregulation evidenced by lower baseline oral disposition index and higher glycemic failure rate in response to any treatment modalities compared with the other two OGTT- GRC patterns (monophasic and biphasic).
2We previously demon- strated that obese youth clinically diagnosed with type 2 diabetes (CDX-T2D) who are islet cell antibody (glutamic acid decarboxyl- ase 65-kDa [GAD65] and insulinoma-associated protein-2 [IA- 2])-positive (Ab
+) have greater impairment in β-cell function, while those who are antibody-negative (Ab
–) have worse insulin sensitivity.
3As such, we postulated that the OGTT-GRC pattern would be worse in obese Ab
+youth than in Ab
–youth. Therefore, the purpose of the study was (1) to compare the prevalence of OGTT-GRCs (incessant increase, monophasic, and biphasic) be- tween obese Ab
+vs. Ab
–youth CDX-T2D and (2) to investigate differences in clamp-measured peripheral insulin sensitivity and β-cell function (first- and second-phase insulin secretion) accord- ing to pattern of OGTT-GRC in Ab
+and Ab
–youth CDX-T2D.
METHODS Participants
Data from 47 obese adolescents with a clinical diagnosis of type 2 diabetes, made by the attending endocrinologist in the Diabetes Center at UPMC Children’s Hospital of Pittsburgh, PA, USA, were used in the present analysis.
3,4Clinical and laboratory characteris- tics of obese youth with type 2 diabetes at the time of diagnosis, in- cluding presence of symptoms, ketones, glucose concentrations, glycosylated hemoglobin (HbA1c), and treatment modalities and/
or insulin use at diagnosis were obtained from the medical records.
3Of them, islet cell antibody (GAD65 and IA-2) screening revealed 15 positive and 32 negative cases. Islet cell antibodies were tested using the National Institute of Diabetes and Digestive and Kidney Diseases-sponsored harmonization assay.
3,4Additional inclusion criteria of the study were (1) age 10–18 years, (2) Tanner stage II–
V, (3) body mass index (BMI) ≥ 85th percentile for age and sex, and (4) duration of diabetes ≤ 7 years. Exclusion criteria were (1) presence of another disease or chronic medication that could inter- fere with endocrine function, (2) HbA1c > 8.5%, (3) HemoCue
< 12 g/dL, and (4) positive pregnancy test (serum). The Institu- tional Review Board of the University of Pittsburgh approved this study (IRB No. IRB0405513), and written informed parental con- sent and child assent were obtained prior to the investigation.
Procedures
All participants admitted to the Pediatric Clinical and Transla- tional Research Center of Children’s Hospital of Pittsburgh under- went medical history, physical examination, and hematologic and biochemical tests. Tanner criteria
5were used for assessing pubertal development. Dual-energy X-ray absorptiometry was used for body composition measures.
Metabolic studies
The Supplementary Material 1 describes details of metabolic studies and biochemical measurements (glucose, insulin, and en- richments of glucose). All participants received a 3-hour hyperin- sulinemic-euglycemic clamp together with stable isotope tracer and a 2-hour hyperglycemic clamp after 10–12 hours of fasting within a 1- to 4-week period in random order.
3,6Fasting hepatic glucose pro- duction (HGP) was measured by [6,6-
2H
2]glucose as described previously.
7Peripheral insulin sensitivity was measured during hy- perinsulinemic (80 mU/m
2/min)-euglycemic clamp.
3,6First- and second-phase insulin secretion were assessed during hyperglycemic (225 mg/dL) clamp.
3,6Calculations
Fasting HGP was calculated during the last 30 minutes of the 2-hour isotope infusion.
7Hepatic insulin sensitivity was calculated as 1/(fasting HGP× fasting insulin).
8Insulin-stimulated glucose disposal (Rd) was calculated as the rate of exogenous glucose infu- sion during the final 30 minutes of hyperinsulinemic-euglycemic clamp.
7,8Peripheral insulin sensitivity was calculated as (Rd/steady- state clamp insulin)× 100. During hyperglycemic clamp, first- and second-phase insulin secretion were calculated during the first 10 minutes and between 15 to 120 minutes, respectively.
7Classification of OGTT-GRCs and statistical analysis
Participants who completed a 2-hour OGTT (1.75 g/kg, maxi-
mum 75 g) were divided into three OGTT-GRC groups: incessant
increase, monophasic, and biphasic.
1,2For visualization of OGTT- GRCs, selective individual curves for each category are shown in the Supplementary Material 1. An incessant increase-GRC was de- fined as a gradual continuous increase without subsequent decrease in glucose ≥ 4.5 mg/dL. A monophasic-GRC was determined by a gradual increase in glucose concentration to a peak (between 30 to 90 minutes during the test), followed by a decrease ≥ 4.5 mg/dL.
A biphasic-GRC was defined by a second increase in glucose con- centration of ≥ 4.5 mg/dL after a decrease ≥ 4.5 mg/dL. The prev- alence of OGTT-GRC between Ab
+vs. Ab
–youth was compared by chi-square test. Because of the low prevalence of the biphasic curve and the overall small sample size, independent sample t-tests were used to compare physical and metabolic characteristics of in- dividuals with the incessant increase-GRC vs. those with the two other GRCs combined (monophasic and biphasic) in Ab
+and Ab
–youth. Analysis of covariance was used to adjust for treatment mo-
dalities, diabetes duration, and 2-hour glucose concentration with our limited sample size. Non-normally distributed data were log
10transformed: untransformed data are presented for ease of inter- pretation. The IBM SPSS ver. 24.0 (IBM Corp., Armonk, NY, USA) was used, and data are presented as mean± standard error of the mean unless otherwise specified.
RESULTS
In the present study, comparisons of insulin sensitivity and β-cell function between obese Ab
+(n= 15) vs. Ab
–(n= 32) youth CDX- T2D were concordant with our previous publications:
3,4Ab
+youth had greater impairments in first- and second-phase insulin secre- tion compared with Ab
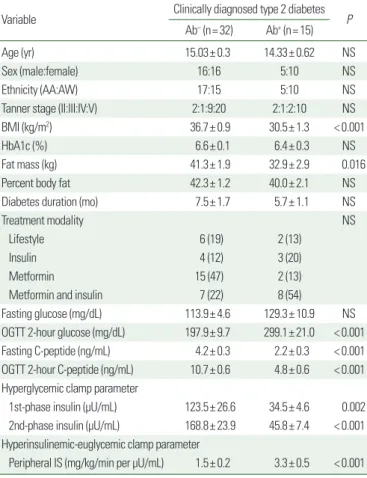
–youth, while the latter group showed se- vere hepatic and peripheral insulin resistance in the absence of dif- ferences in age, sex, ethnicity, Tanner stage, percent body fat, diabe- tes duration, and treatment modalities (Table 1).
An incessant increase-GRC was dominant in Ab
+youth (73%), but present only in 25% of Ab
–youth (P=0.006). In contrast, the prevalence of a monophasic-GRC was higher in Ab
–vs. Ab
+youth (66% vs. 20%, P=0.006). A biphasic-GRC was present in only one Ab
+(7%) and three Ab
–(9%) youth (Fig. 1).
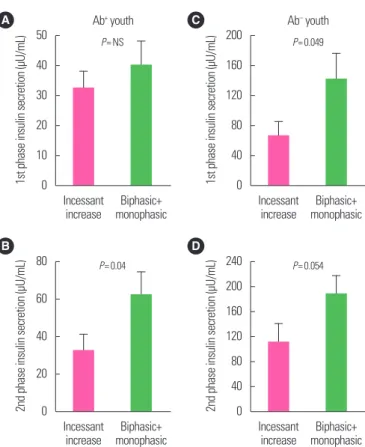
From our analysis of Ab
+youth only, hyperglycemic clamp-mea- sured second-phase insulin secretion was ~40% lower in the inces- sant increase-GRC vs. the other two groups combined (monopha-
Table 1. Participants’ demographic, physical, and metabolic characteristicsVariable Clinically diagnosed type 2 diabetes
Ab– (n= 32) Ab+ (n= 15) P
Age (yr) 15.03± 0.3 14.33± 0.62 NS
Sex (male:female) 16:16 5:10 NS
Ethnicity (AA:AW) 17:15 5:10 NS
Tanner stage (II:III:IV:V) 2:1:9:20 2:1:2:10 NS
BMI (kg/m2) 36.7± 0.9 30.5± 1.3 < 0.001
HbA1c (%) 6.6± 0.1 6.4± 0.3 NS
Fat mass (kg) 41.3± 1.9 32.9± 2.9 0.016
Percent body fat 42.3± 1.2 40.0± 2.1 NS
Diabetes duration (mo) 7.5± 1.7 5.7± 1.1 NS
Treatment modality NS
Lifestyle 6 (19) 2 (13)
Insulin 4 (12) 3 (20)
Metformin 15 (47) 2 (13)
Metformin and insulin 7 (22) 8 (54)
Fasting glucose (mg/dL) 113.9± 4.6 129.3± 10.9 NS
OGTT 2-hour glucose (mg/dL) 197.9± 9.7 299.1± 21.0 < 0.001 Fasting C-peptide (ng/mL) 4.2± 0.3 2.2± 0.3 < 0.001 OGTT 2-hour C-peptide (ng/mL) 10.7± 0.6 4.8± 0.6 < 0.001 Hyperglycemic clamp parameter
1st-phase insulin (µU/mL) 123.5± 26.6 34.5± 4.6 0.002 2nd-phase insulin (µU/mL) 168.8± 23.9 45.8± 7.4 < 0.001 Hyperinsulinemic-euglycemic clamp parameter
Peripheral IS (mg/kg/min per µU/mL) 1.5± 0.2 3.3± 0.5 < 0.001 Values are presented as mean± standard error of the mean or number (%).
NS, not significant; AA, African American; AW, American White; BMI, body mass index;
HbA1c, glycosylated hemoglobin; OGTT, oral glucose tolerance test; IS, insulin sensitivity.
Figure 1. Prevalence of the glucose response curve during an oral glucose toler- ance test in diabetic and non-diabetic youth.1,2 CDX-T2D, clinically diagnosed with type 2 diabetes.
100
80
60
40
20
0
%
Current study P= 0.006 Obese Ab+ CDX-T2D youth
73
20 7
Obese Ab– CDX-T2D youth
25
66
9
Today (Diabetes care
2019 ) Obese T2D
youth
21.7
68.6
9.7
Pittsburgh (Diabetes care
2016 ) Obese non- diabetic youth
3.5
56.8
39.7
Biphasic Monophasic Incessant increase
sic and biphasic) (Fig. 2A, B). There was up to 20% lower first- phase insulin secretion in the incessant increase-GRC vs. the other two groups, which was not a significant difference. There were no differences in age, sex, race, Tanner stage, BMI, percent body fat, and hepatic and peripheral insulin sensitivity between the Ab
+group with incessant increase-GRC and the groups with mono- phasic- or biphasic-GRC. For the Ab
–group, youth with an inces- sant increase-GRC had lower first- and second-phase insulin secre- tion (53% and 42%, respectively) compared with those with monophasic- or biphasic-GRC (Fig. 2C, D) in the absence of dif- ferences in age, sex, race, Tanner stage, BMI, percent body fat, he- patic, and peripheral insulin sensitivity. Our significant findings of insulin secretion according to pattern of OGTT-GRC in the Ab
+and Ab
–groups remained significant after adjustment for treat- ment modalities, whereas no statistical significance existed after ad- justing for diabetes duration and/or OGTT 2-hour glucose con- centration.
DISCUSSION
The present investigation demonstrates that an incessant in- crease OGTT-GRC, considered a more severe curve phenotype than the other GRCs, is common in obese youth CDX-T2D, both Ab
+and Ab
–, in contrast to non-diabetic youth.
1Furthermore, the prevalence of incessant increase-GRC is 3-fold higher in Ab
+vs.
Ab
–obese youth CDX-T2D. In both Ab
+and Ab
–youth, an inces- sant increase-GRC reflects severe impairment in β-cell function compared with the other two combined, monophasic- and bipha- sic-GRCs.
The OGTT-GRC has been recognized as a useful indicator of insulin resistance and β-cell dysfunction in non-diabetic youth;
1,9-11however, only one study (i.e., TODAY clinical trial) has examined its utility in youth with type 2 diabetes.
2The prevalence of the dif- ferent OGTT-GRCs in obese Ab
–youth CDX-T2D in the current study is consistent with the TODAY data: 25% of Ab
–youth had incessant increase-GRC in this study and 22% in the TODAY (Fig. 1). In both studies, insulin sensitivity (measured by hyperin- sulinemic-euglycemic clamp in ours and by OGTT in TODAY) did not differ among OGTT-GRCs, whereas insulin secretion was impaired in the incessant increase-GRC compared with monopha- sic- and biphasic-GRCs, suggesting that the OGTT-GRCs can dif- ferentiate β-cell function but not insulin sensitivity in type 2 diabe- tes. This observation was in contrast to the non-diabetic cases where OGTT-GRC was reflective of both insulin sensitivity and β-cell function.
1There are limited data with respect to the OGTT-GRC in youth with type 1 diabetes. The TrialNet study recently showed that the majority of Ab
+relatives of individuals with type 1 diabetes had a monophasic- (66%) vs. biphasic-GRC (34%), with a higher cumu- lative incidence of type 1 diabetes during the follow-up period.
12Since the aforementioned study did not include the incessant in- crease-GRC type in Ab
+individuals with relatives of type 1 diabe- tes, and due to the fact that our Ab
+youth were obese with clinical- ly diagnosed type 2 diabetes, we were not able to confirm or negate the findings between these two studies. In the present study of obese Ab
+youth CDX-T2D, the incessant increase-GRC reflected severe impairment in β-cell function (second-phase insulin secre- tion) compared with monophasic- and biphasic-GRCs combined.
Figure 2. Hyperglycemic clamp-measured insulin secretion in obese Ab+ (A, B) and Ab– (C, D) youth clinically diagnosed with type 2 diabetes by the glucose re- sponse curve during an oral glucose tolerance test type. Values are presented as mean± standard error of the mean. NS, not significant.
P= NS 50
40 30 20 10 1st phase insulin secretion (μU/mL) 0
Incessant
increase Biphasic+
monophasic Ab+ youth A
80
60
40
20
2nd phase insulin secretion (μU/mL) 0
Incessant
increase Biphasic+
monophasic B
P= 0.04
200 160 120 80 40 1st phase insulin secretion (μU/mL) 0
Incessant
increase Biphasic+
monophasic Ab– youth C
P= 0.049
240 200 160 120 80 40 2nd phase insulin secretion (μU/mL) 0
Incessant
increase Biphasic+
monophasic D
P= 0.054