http://dx.doi.org/10.5369/JSST.2013.22.5.338 pISSN 1225-5475/eISSN 2093-7563
1. INTRODUCTION
In general, the interpretation of the electrocardiographic (ECG) signal, which include acquisition of bio-signal, is the noise removal of QRS detection and diagnosis. The analysis of ECG is widely used to check heart problems or to diagnose various heart diseases. An arrhythmia is known as the irregularity of the heart rhythm or the abnormal condition of the heartbeat [1-3]. Cardiac arrhythmia, which is caused by cardiac autonomic abnormalities or conduction disturbances, can occur with a normal heart rate or an irregular heart rate that indicates the susceptibility of serious heart disease, stroke or sudden cardiac death.
Premature ventricular contraction (PVC) is the most common arrhythmia. The occurrence of PVC leads to a
sudden cardiac death especially in the presence of myocardial infarction or ventricular tachycardia [4-8]. So, immediate detection and treatment of PVC is very essential for the patients with different heart diseases. In this paper, we propose a method of the classification for premature ventricular contraction, based on the efficient R wave detection. Most methods for detecting arrhythmia require PP interval, or the diversity of P wave morphology, but it is difficult to detect the p wave signal because of various noise types. Therefore, it is necessary to use the noise-free R wave. So, the new approach for the detection of PVC is presented based on the rhythm analysis and the beat matching in this paper.
For this purpose, we removed the baseline wandering of low frequency band and made summed signals that are composed of two high frequency bands including frequency component of QRS complex using the wavelet filter. And then we designed R wave detection algorithm using the adaptive threshold and the window through RR interval. Also, we developed algorithm to classify PVC using RR interval. The performance of R wave and PVC detection is evaluated by using MIT-BIH arrhythmia database.
PVC Classification Algorithm Through Efficient R Wave Detection
Ik-Sung Cho and Hyeog-Soong Kwon+
Abstract
Premature ventricular contractions are the most common of all arrhythmias and may cause more serious situation like ventricular fibrillation and ventricular tachycardia in some patients. Therefore, the detection of this arrhythmia becomes crucial in the early diagnosis and the prevention of possible life threatening cardiac diseases. Most methods for detecting arrhythmia require pp interval, or the diversity of P wave morphology, but they are difficult to detect the p wave signal because of various noise types. Thus, it is necessary to use noise- free R wave. So, the new approach for the detection of PVC is presented based on the rhythm analysis and the beat matching in this paper. For this purpose, we removed baseline wandering of low frequency band and made summed signals that are composed of two high frequency bands including the frequency component of QRS complex using the wavelet filter. And then we designed R wave detection algorithm using the adaptive threshold and window through RR interval. Also, we developed algorithm to classify PVC using RR interval. The performance of R wave and PVC detection is evaluated by using MIT-BIH arrhythmia database. The achieved scores indicate average detection rate of 99.76%, sensitivity of 99.30% and specificity of 98.66%; accuracy respectively for R wave and PVC detection.
Keywords : Premature ventricular contractions, Wavelet filter, QRS complex, R wave, Adaptive threshold, RR interval
Department of IT Engineering,Pusan National University 50 Chunghag Samrangjin Miryang Gyungnam, 627-702, Korea +Corresponding author: [email protected]
(Received : Aug. 1, 2013, Accepted : Sep. 30, 2013)
This is an Open Access article distributed under the terms of the Creative Commons Attribution Non-Commercial License(http://creativecommons.org/licenses/by- nc/3.0)which permits unrestricted non-commercial use, distribution, and reproduction in any medium, provided the original work is properly cited.
2. SUGGESTED PVC DETECTION ALGORITHM
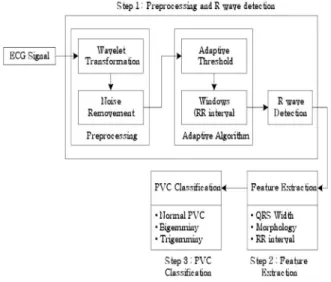
The proposed PVC classification algorithm consists of three steps: Preprocessing and the R wave detection, variable extraction, and PVC classification. Figure 1 shows the procedure followed.
2.1 MIT/BIH arrhythmia database
In this paper, ECG data from the MIT/BIH arrhythmia database was used. The database was created in 1980 as a standard reference for arrhythmia detectors. Its inception allowed developers of arrhythmia analyzers to have objective measure of accuracy, specificity, and sensitivity.
The primary goal of providing this metric was to spur the automated arrhythmia detection and the technology classification. Moody and Mark reported that since 1980, it has been used worldwide in over 500 sites for this purpose.
The database is comprised of 48 files, each containing 30-min ECG segments selected from 24-hr. recordings of 47 different patients. Among 48 files, 23 were randomly chosen and 25 were selected to include uncommon, threatening, and arrhythmic heartbeat samples. Each file contains two leads, with modified lead II available in 45 files, V1 in 40 files, and II, V2, V4, and V5 distributed among 11 files. Data are band pass-filtered at 0.1 to 100 Hz and sampled at 360 Hz. We used a total of 40 records (see Table III for list) from the database, focusing on modified- lead II signals except in two files (102 and 104), in which
lead V5 was substituted since modified-lead II was not available. Though variations in classifier performance with lead selection are expected, such as shown by de Chazal’s group, we did not investigate the parameter in this study.
The database is annotated both in the timing information and the beat classification [9]. In this paper, we focused on the classification only and used the annotation to locate beats in ECG signals. We did not integrate beat detection since accuracy of classification typically lags that of detection in reported algorithms. Many examples of highly accurate detectors can be found in literature. Of particular interest to this study are the detectors based on wavelet transforms, as both detection and classification could share a common wavelet transformation step.
2.2 Wavelet transform
Time-frequency signal analysis methods offer simultaneous interpretation of the signal in both time and frequency which allows local, transient or intermittent components to be elucidated. Particularly, the wavelet transform is often used in the time-frequency analysis and wildly used in biomedical engineering in recent years [10, 11]. By wavelet decomposition of the signal, we can get the different time and frequency characters in different layers, which can help us to distinguish the distribution of noise. If there exist discrete pulse signal, and will be decomposing in j layers based on orthogonal wavelet method, the will be decomposed as:
Where H2is a wavelet detail coefficient which contains high frequency components in j layer, and L2is a wavelet approximate coefficient which contains low frequency components in layer. The equation (1) will be continued from high frequency to low frequency.
In this research, the Haar wavelet function is used as a mother wavelet. Detail coefficients H3 and H4at levels 3 and 4 are selected for characteristic features, since high- frequency inference artifacts in levels 1 and 2, and baseline variations in levels 5 and 6 may have an influence on the extracting characteristics of QRS complex. The sampling size of ECG signals window, which is from the 360 Hz MIT/BIH arrhythmia database, is 100 samples/s before, and 150 samples/s after the wave of a QRS complex. Fig. 2
Fig. 1. System configuration.
(1)
shows the result of ECG signal’s wavelet transformation.
In case of MIT-BIH database with its sampling frequency of 360 Hz, the result with removal of base line change can be extracted for the case of taking wavelet inverse conversion using the result filtered with adaptive filter using this frequency bandwidth’s signal as the main input of adaptive filter and high frequency component from wavelet transformation.
2.3 Summed signal and adaptive algorithm
Wavelet transformation has a very significant advantage in the aspect of choosing frequency bandwidth of the signal to process. However, the signal size is not regular in the divided frequency bandwidth. Since H3signal’s frequency bandwidth is 11.4 to 22.8 Hz and H4 signal’s frequency bandwidth is 22.8 to 45 Hz, it does not matter if each signal is used to detect R wave that has 5 to 30 Hz frequency component, but it has one disadvantage that signal’s size is not regular during the wavelet conversion. To compensate such disadvantage, this research composed summed signal H3,4 which added H3 signal and H4 signal among reorganized high frequency bandwidth signals after removing base line noise, and we were able to improve R wave signal’s detection performance. R wave peak point detection is the most difficulty of the APC and PVC because R wave has various shapes and often with great noise and artifacts, sometimes T wave and other wave will disturb R wave that lead to mistake decision. Because every person has his own heart rate and heart beat
characteristic. In order to improve the accuracy of detection, before the threshold and template calculating, a set of normal beat ECG data (nearly 15 seconds) of himself person will be detected or get from doctor or MIT-BIT database, which must not with any arrhythmia beat, huge artifacts and with a little noise, and these data will be used to calculate the R wave peak point, threshold and template.
The steps of R wave peak point calculate is: R wave detection algorithm through adaptive variable type threshold value and window is composed as of the process in Fig. 3. At first, summed signal (H3,4)’s sample value is used as the input value. Since normal ECG signal’s cycle is generally 0.8 to 1.2 s, range that R wave can be detected decides the maximum value within 600 ms as the first R wave (R1). After that, 6 R waves are detected using 30% of detected R wave values as the early stage threshold values (Rth1). In case of P wave or T wave, it does not exceed maximum 30% of R wave amplitude value, and it is the optimal threshold value not to misconceive P wave or T wave as R wave when detecting the following R wave.
Average value of amplitude is calculated from the detected 6 R waves and 30% of calculated value becomes the next detection’s threshold (Rth(n)). By using the detected early stage 6 R waves, 5 RR intervals are calculated, and then they are averaged to set the window interval with 50% of the average value. When wave form higher than variable threshold voltage occurs within the window section, algorism detects the highest point. When the amplitude is lower than the threshold value during the window section process, the highest point is detected by continuously expanding the window section until a value higher than threshold value shows up. Therefore, window interval is automatically changed by RR interval, and it detects the signal’s highest point. R wave detection calculation formula using window and adaptive type threshold is the equation (2)
Since premature ventricular contraction’s R wave has high amplitude in general, when setting up 30% of average value as threshold value, there is a difficulty in signal detection that has low amplitude which happens after
Fig. 2. Wavelet transformation of ECG signal; (a) ECG signal, (b) regenerated signal, (c)~(f) low frequency signal, and (g)~(j) high frequency signal.
(2)
threshold value increases. In order to solve the problem, it is set up to detect R wave which happens after premature ventricular contraction by lowering the current threshold action potential to 50% if currently detected signal’s amplitude is twice bigger than the previously detected signal’s amplitude. Also, error beat can be caused by misconceiving noise signal as R wave because of RR interval, signal sizes in signal and signal are compared by using (3) formula in order to prevent the error beat. If numerical formula is satisfied, R wave here is excluded as an error beat that was calculated incorrectly.
Also, error beat can be caused by misconceiving noise signal as R wave because of RR interval, signal sizes H3 in signal and H4signal are compared by using (3) formula in order to prevent the error beat. H3maxand H4maxhere are each signal H3(Ri) and H4(Ri) signal maximum values and each of and are R wave’s signal size currently found.
3. PVC CLASSIFICATION ALGORITHM
When R wave is detected through the preprocessing process and the algorithm explained in earlier, PVC arrhythmia is classified by extracting the parameter. Our research used QRS width, R-R interval, and QRS form
variable for variables to classify PVC.
3.1 QRS width
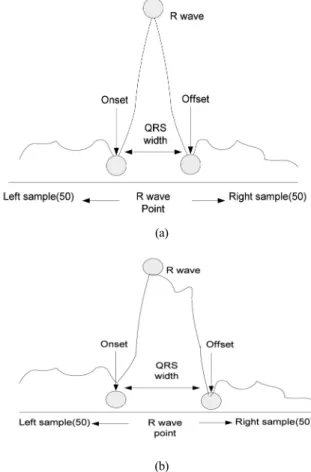
QRS width is calculated by deciding Q point as QRS starting point and S point as ending point, based on R wave. This process is divided to the process to find threshold value of Q and S and the process to find QRS starting and ending point. Process to find threshold value is as follows. At first, 100 number of sample sets which include 50 of each left and right based on the detected R wave should be selected. Based on the detected R wave, each size of maximum slope that 50 numbers of data in left and right side have is calculated. After that, smaller value among those two slopes should be chosen and 25% of the value is set up as the final threshold value. When it is regular QRS width as in Fig. 4(a), based on R wave, if three spots with the slope’s sizes smaller than or equal to the threshold value are continuously found, then the location is considered as QRS’s starting point on left side and QRS’s ending point on right side. If width of QRS
Fig. 3. Adaptive threshold and window algorithm.
Fig. 4. QRS width; (a) Normal QRS and (b) abnomal QRS.
(a)
(b)
starting and ending point is out of 90 to 110 ms range, it is considered that QRS width is abnormal as in Fig. 4(b).
After finding out maximum slope’s size between QRS ending point and sample ending point, point where it reaches 50% of the slope size is assigned as QRS ending point again.
3.2 QRS morphology
QRS morphology is a parameter that shows the form of wave used as a significant parameter for analyzing and diagnosing ECG signal [12]. Creation routine of early stage template sets QRS width as 90 to 110 ms, and the 8 patterns were averaged by judging it as normal when the change rate is regular after comparing change rate of current R-R interval and previously input 5’s R-R interval’s average value. Template data is calculated by using left and right side of each 30 numbers, total 60 numbers of data (300 ms) based on R point in order to include QRS width’s wide PVC. 60 numbers of template data concluded as normal are calculated by matching 1:1 with 60 input sample values.
30 numbers of template data selected through equation (3) are matched 1:1 with 30 input sample values and are calculated through equation (4).
If morphology is normal by equation (4), new template is calculated by equation (5).
New template reduced effect on the new wave form by putting more weight of 0.875 on the existing template.
3.3 PVC classification through R-R interval
R-R interval between normal QRS complex and premature ventricular contraction gets narrow right before premature ventricular contraction and gets wide after premature ventricular contraction. Phenomenon when PVC shows up alternatively with one normal contraction is called, the bigemminy, as in Fig. 5. Moreover, it is called as the tirgemminy when PVC shows up alternatively with two normal contractions. And it is called as the ventricular tachycardia when more than 4 PVC are continued rapidly [13]. Therefore, R-R interval between normal QRS complex and premature ventricular beat shows many differences compared to R-R interval between normal beats, so premature ventricular contraction arrhythmia can be detected by using the difference in R-R interval.
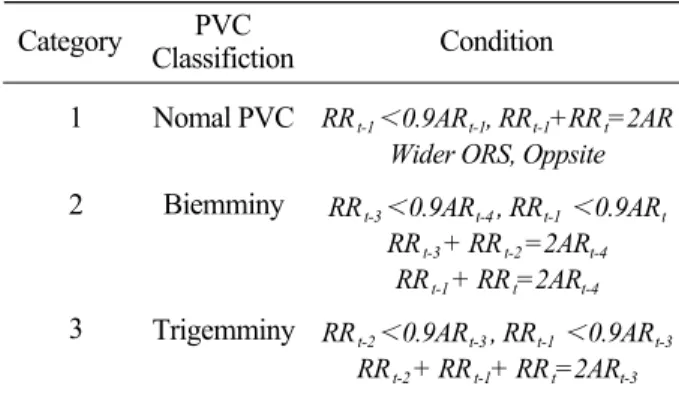
Classification of premature ventricular contraction is characterized by QRS width, form variable, and rhythm shape of R-R interval. Therefore, major beat time and major rhythm shall be determined to classify the input beats. Through the QRS width and R-R interval acquired after QRS preprocessing process explained previously and the extraction of the form variable through template, finally, the steps for the case of premature ventricular contraction is classified to general PVC, bigeminy, and tirgemny. Classification conditions are as in Table 1.
(3)
(4) : ithdata of template
: ithsample value of initial normal QRS complex
: ithdata of template
: ithsample value of MthQRS complex
(5) : ithMaximum sample value of MthQRS complex
: ithdata of new template : ithdata of previous template
: ithsample value of KthQRS complex
(a)
(b)
(c)
Fig. 5. Type of PVC; (a) Normal PVC, (b) bigemminy, and (c) trigemminy
The R wave of PVC is greatly different in the normal beat. When the PVC happens, the released energy, which is mainly from the ventricle, will affect the shape and will affect appearing time of QRS wave, leading to most R wave is wider and higher than the normal beat. Especially some R wave is huge negative waveforms, and only a few R waves are less than the normal beat in PVC. At the same time, most PVC have great T wave even greater than R wave. Besides this, the interval of last R wave and later R wave of PVC is approximately equal to twice R-R interval of the normal, because it happens in ventricle and the sinus will pace normally.
* RRt-1, RRt,,RRt+1 : Previous, current, subsequent RR interval.
4. RESULTS AND DISCUSSIONS Detection rate’s calculation is achieved throug equation (6).
In these equations, TP, TN, FP and FN denote true positives, true negatives, false positives and false negatives, respectively. False positives are beats which have been incorrectly assigned to that same class. A false negative occurs when a beat should have been assigned to that class but was missed and assigned to another class.
Consequently, sensitivity measures how successfully a classifier recognizes beats of a certain class without
missing them, and whereas positive predictively measures how exclusively it classifies beats of a certain type. In order to validate the algorithm developed for PVC detection, a comparative study using the MIT-BIH database has been employed. The PVC detection algorithm validation has been performed using 48 MIT-BIH database records. Non MLⅡ lead configurations records have been removed from the training and testing datasets, preserving coherence in the morphological characteristics of ECG records. The achieved results regarding PVC detection performance are presented and compared in Table 2 with state of the art algorithms. The values shown for the later are those reported by their respective authors. The achieved results by the algorithm platform regarding sensitivity and specificity for each of the arrhythmia assessment tasks are presented in Table 3.
* AT: Adaptive Threshold, DF:Digital Filter, LWT: Legacy Wavelet Transform,
FD: First Derivative, FS: First & Second Derivative.
5. CONCLUSION
The research proposed algorism that determines PVC in real time through morphological characteristics analysis of ECG signals to help clinical diagnosis. Especially the Table 1. PVC Classification
Category PVC
Classifiction Condition 1
2
3
Nomal PVC Biemminy
Trigemminy
RRt-1 0.9ARt-1, RRt-1+RRt=2AR Wider ORS, Oppsite RRt-3 0.9ARt-4 , RRt-1 0.9ARt
RRt-3 + RRt-2 =2ARt-4 RRt-1 + RRt=2ARt-4 RRt-2 0.9ARt-3 , RRt-1 0.9ARt-3
RRt-2 + RRt-1+ RRt=2ARt-3
Table 2. Comparison of detection rate Type
Detection Rate(%)
AT DF LWT FD FS Proposed
algorithm 98.73 98.50 98.84 98.69 98.43 99.76
Table 3. PVC detection rate by algorithm
record 200 228 106 116 119 121 total
1744 1688 1507 2302 1543 1861 10,645
855 365 520 110 444 2 2,296 avg
96.445 99.467 99.934 99.957 100 100
99.30
94.152 98.904 99.808 99.091 100 100
98.66 Normal PVC specificity
(%) sensitivity (%)
(6)
research suggested R wave detection method using wavelet and adaptive threshold value for the accuracy of the detection. For this, we first designed wavelet filter, composed with the summed signal in high frequency bandwidth using signals with their baseline noise removed, and designed the algorithm that detects R wave according to the changes of the gaps between adaptive threshold value and RR interval. After that, we developed the algorithm that determines PVC with adaptive form through beat matching of RR interval, QRS width interval and QRS form analysis. R wave’s average detection rate from 48 items of MIT-BIH records showed 99.76% of efficiency.
In case of PVC detection rate, each sensitivity and specificity showed 99.30 and 98.66% of detection result as a result of experiment having 6 items of records including more than 100 PVC as subject. Many detection errors appeared on number 105 data affected by a lot of noise compared to other signals, number 108 data that showed abrupt huge P wave, number 203 data that showed various forms of arrhythmia, and data that RR interval is drastically changed or size of signal is abruptly changed, but it was possible to know that proposed algorithm has better efficiency compared to other existing R wave detection algorithms. Also, even though general PVC, bigeminy, and tirgeminy had excellent detection rate, it was impossible to detect in the case of PVC-RUNS that PVC continuously occurred more than 3 times. In case of health care system that needs accurate diagnosis according to the existence and types of recipient’s symptom, it was judged that R wave detection algorithm suggested by this research, which used wavelet and adaptive threshold value, was effective.
Characteristics to detect arrhythmia are extracted based on R point, so more accurate R point detection is necessary to improve detection efficiency, and study on the algorithm which uses less number of characteristics is necessary for miniaturization and low electric power. Therefore, it is necessary to study algorithm that has function to detect exact R point with minimum amount of operation and to determine cardiac disorder in real time in a condition of known characteristics of normal bio signal of a specific person.
REFERENCES
[1] J. Millet, M. Perez, G. Joseph, A. Mocholi, and J.
Chorro, “Previous identification of QRS onset and
offset is not essential for classifying QRS complexes in a single lead”, IEEE Computers in Cardiology, Vol.
24, pp. 299-302, 1997.
[2] J. C. T. B. Moraes, M. O. Seixas, F. N. Vilani, and E.
V. Costa, “A real time QRS complex classification method using Mahalanobis distance”, IEEE Computers in Cardiology, Vol. 29, pp. 201-204, 2002.
[3] F. M. Ham and S. Han, “Classification of cardiac arrhythmias using Fuzzy ARTMAP”, IEEE Trans.
Biomed. Eng., Vol. 43, No. 4, pp. 425-430. 1996.
[4] B. Ribeiro, M. Amandio, and J. Henriques, “Choosing real-time predictors for ventricular arrhythmias detection”, Int. J. Pattern Recognit. Artif. Intell., Vol.
21, Issue 8, pp. 1249-1263, 2007.
[5] M. A. Chikh, N. Belgacem, A. Z. Chikh, and F. B.
Reguig, “The use of artificial neural network to detect the premature ventricular contraction (PVC) beats”, Electronic Journal Mechanial Acoustics, Vol. 2, 2004.
[6] I. Christov, I. Jekova, and G. Bortolan, “Premature ventricular contraction classification by Kth nearest- neighbours rule”, Physiol. Meas., Vol. 24, pp. 123-130, 2006.
[7] I. Jekova, G. Bortolan, and I. Christov, “Pattern recognition and optimal parameter selection in premature ventricular contraction classification”, IEEE Computers in Cardiology, Vol. 31, pp. 357-360, 2004.
[8] I. Christov and G. Bortolan, “Ranking of pattern recognition parameters for premature ventricular contractions classification by neural networks”, Physiol.
Meas., Vol. 25, pp. 1281-1290, 2004.
[9] H. Al-Nashash, “Cardiac arrhythmia classification using neural networks”, Technol. Health Care, Vol. 8, Issue 6, pp. 363-372, 2000.
[10] J. Wang, C. L. Yeo, and A. Aguire, “The design and evaluation of a new multi-lead arrhythmia monitoring algorithm”, IEEE Computers in Cardiology, Vol. 26, pp. 675-678, 1999.
[11] O. Wieben, V. X. Afonso, and W. J. Tompkinks,
“Classification of premature ventricular complexes using filter bank features, induction of decision trees and a fuzzy rule-based system”, Med. Biol. Eng.
Comput., Vol. 37, No. 1, pp. 560-565, 1999.
[12] T. I. Omer, L. Giovangrandi, and G. T. A. Kovacs,
“Robust neural-network-based classification of premature ventricular contraction using wavelet transform and timing interval features”, IEEE Trans.
Biomed. Eng., Vol. 53, No. 12, pp. 2507-2515, 2006.
[13] Y. Sun, K. L. Chan, and S. M. Krishnan,
“Characteristic wave detection in ECG signal using morphological transform”, BMC Cardiovasc. Disord., Vol. 5, No. 28, p. 1091, 2005.