D I A B E T E S & M E T A B O L I S M J O U R N A L
This is an Open Access article distributed under the terms of the Creative Commons Attribution Non-Commercial License (https://creativecommons.org/licenses/by-nc/4.0/) which permits unrestricted non-commercial use, distribution, and reproduction in any medium, provided the original work is properly cited.
Age- and Sex-Related Differential Associations between Body Composition and Diabetes Mellitus
Eun Roh1, Soon Young Hwang2, Jung A Kim1, You-Bin Lee1, So-hyeon Hong1, Nam Hoon Kim1, Ji A Seo1, Sin Gon Kim1, Nan Hee Kim1, Kyung Mook Choi1, Sei Hyun Baik1, Hye Jin Yoo1
1Division of Endocrinology and Metabolism, Department of Internal Medicine, 2Department of Biostatistics, Korea University College of Medicine, Seoul, Korea
Background: The age- and sex-related differences on the impacts of body composition on diabetes mellitus (DM) remain uncer- tain.
Methods: The fourth and fifth Korea National Health and Nutrition Examination Survey included 15,586 subjects over 30 years of age who completed dual-energy X-ray absorptiometry. We conducted a cross-sectional study to investigate whether muscle mass index (MMI), defined as appendicular skeletal muscle divided by body mass index (BMI), and fat mass index (FMI), de- fined as trunk fat mass divided by BMI, were differently associated with DM according to age and sex.
Results: In multivariate logistic regression, the risk for DM significantly increased across quartiles of FMI in men aged ≥70.
Meanwhile, MMI showed a protective association with DM in men of the same age. The odds ratios (ORs) for the highest quartile versus the lowest quartile of FMI and MMI were 3.116 (95% confidence interval [CI], 1.405 to 6.914) and 0.295 (95% CI, 0.157 to 0.554), respectively. In women, the ORs of DM was significantly different across FMI quartiles in those over age 50. The highest quartile of FMI exhibited increased ORs of DM in subjects aged 50 to 69 (OR, 1.891; 95% CI, 1.229 to 2.908) and ≥70 (OR, 2.275;
95% CI, 1.103 to 4.69) compared to lowest quartile. However, MMI was not significantly associated with DM in women of all age groups.
Conclusion: Both FMI and MMI were independent risk factors for DM in men aged 70 years or more. In women over 50 years, FMI was independently associated with DM. There was no significant association between MMI and DM in women.
Keywords: Abdominal fat; Body composition; Diabetes mellitus; Muscle, skeletal
Corresponding author: Hye Jin Yoo https://orcid.org/0000-0003-0600-0266 Division of Endocrinology and Metabolism, Department of Internal Medicine, Korea University Guro Hospital, Korea University College of Medicine, 148 Gurodong-ro, Guro-gu, Seoul 08308, Korea
E-mail: [email protected]
Received: Sep. 17, 2019; Accepted: Dec. 30, 2019
INTRODUCTION
The increase in visceral fat mass and the loss of muscle mass with aging has been well documented [1-3]. Age-dependent changes in body fat distribution are risk factors for the devel- opment of type 2 diabetes mellitus (DM). Visceral fat accumu- lation has been associated with the development of type 2 DM through peripheral insulin resistance, increased hepatic glu- cose production [4], hypoadiponectinemia [5], and systemic inflammation [6]. In animal studies, surgical removal of ab- dominal fat prevents the onset of age-dependent insulin resis-
tance and delays the onset of DM [7]. The physiologic role of low muscle mass in insulin resistance and DM has recently been studied. Low muscle mass was strongly associated with insulin resistance, prediabetes, and the development of type 2 DM independent of general obesity [8-10].
The patterns and rates of age-related changes in body com- position vary by sex, ethnicity, and physical activity. Several studies have demonstrated that men lose greater skeletal muscle mass with aging even though they have a greater skeletal mus- cle mass than that in women [11,12]. Furthermore, men accu- mulated more central adiposity than women throughout the https://doi.org/10.4093/dmj.2019.0171
pISSN 2233-6079 · eISSN 2233-6087
184
entire life span, although women generally have higher total adiposity relative to that in men [13,14]. As a result, men have a relatively higher risk of cardiovascular diseases compared to that in age-matched women, whereas by age 70, the incidence of cardiovascular diseases is similar between sexes [15]. In women, the transition into menopause leads to a critical shift to metabolic disturbances. The protective effect of favorable body fat distribution in women rapidly disappears after menopause [16]. After menopause, adipose distribution shifts from gluteo- femoral subcutaneous adipose tissue to abdominal visceral adi- pose tissue [17]. Therefore, the relative importance of body composition on the incidence of type 2 DM might be quite dif- ferent according to age and sex. However, few studies have si- multaneously compared the differential association between body composition and type 2 DM according to age and sex.
In this study, we evaluated the association of fat mass index (FMI), calculated as trunk fat mass divided by body mass in- dex (BMI), and muscle mass index (MMI), defined as appen- dicular muscle mass divided by BMI, with the presence of DM in different age groups (30 to 49, 50 to 69, and ≥70 years) in men and women based on data from the Korean National Health and Nutrition Examination Survey (KNHANES), a na- tionally representative cross-sectional survey.
METHODS
Study population
This study was performed using data from KNHANES IV and V (2008 to 2011). The KNHANES is a nationwide, communi- ty-based cross-sectional survey conducted by the Division of Health and Nutritional Survey under the Korean Centers for Disease Control and Prevention (KCDCP). The survey was composed of a health interview, health examination, and nu- trition surveys. The KNHANES used a stratified, multistage, clustered probability sampling method to select a representa- tive sample of the noninstitutionalized, civilian Korean popu- lation. The survey was conducted according to the guidelines in the Declaration of Helsinki and all procedures were ap- proved by the Institutional Review Board of the KCDCP (IRB:
2008-04EXP-01-C, 2009-01CON-03-2C, 2010-02CON-21-C, and 2011-02CON-06-C). All participants in this survey signed an informed consent form.
Among those who participated in the KNHANES 2008 to 2011, we included 16,893 individuals aged ≥30 years who completed dual-energy X-ray absorptiometry (DXA) (QDR
4500A; Hologic Inc., Bedford, MA, USA) measurements in the mobile examination centers. DXA is a widely used method of measuring muscle and fat mass for its reasonable cost and con- venience of examination. Individuals who had missing data on BMI, trunk fat mass, or appendicular skeletal muscle mass, or who had missing data on fasting plasma glucose or self-report- ed information on diagnosis of DM or antidiabetic medication were excluded.
Measurements
The BMI was calculated as the weight in kilograms divided by the square of the height in meters (kg/m2). Blood samples were obtained from each participant in the morning after overnight fasting. The fasting plasma concentrations of glucose and lipids were measured enzymatically in a central laboratory. Low- density lipoprotein cholesterol (LDL-C) levels were calculated using the Friedewald’s formula [18] in individuals with triglyc- eride (TG) concentrations ≤400 mg/dL in 2008. LDL-C level has been directly measured using automated enzymatic tech- niques since 2009.
Fat and muscle masses were obtained using the value of DXA. Appendicular skeletal muscle mass (ASM), the sum of the muscle masses of both arms and legs, was defined by ex- cluding the bone mass from the lean mass of the extremities.
We then adjusted the absolute level of ASM for body size using BMI as ASM/BMI. ASM/BMI was introduced as an indicator of MMI by the Foundation for the National Institutes of Health (FNIH) Sarcopenia Project in 2014 [19]. The abdominal fat in- dex used trunk fat/BMI as the FMI.
Definition of DM and covariates
DM was defined according to the American Diabetes Associa- tion guidelines [20] as subjects with fasting plasma glucose levels over 126 mg/dL or who responded to health interview survey as having had a previous diagnosis of DM by a physi- cian or treated with antidiabetic agents or insulin. Information concerning smoking and drinking status was obtained from a questionnaire in the health interview survey. Regular exercise was defined as strenuous physical activity for at least 20 min- utes and ≥3 time/week. Income levels were dichotomized at the lower 25%.
Statistical analysis
Statistical analyses were performed using SAS version 9.4 (SAS Institute Inc., Cary, NC, USA). All analyses were conducted
185 using sampling weights of KNHANES complex sample survey
design. The results were presented as mean±standard error for nominal data and as counts (percentage, %) for continuous variables. To investigate age-related differences in the impacts of muscle mass and fat mass on DM, we grouped the partici- pants into three age categories; 30 to 49, 50 to 69, and more than 70 years. We examined the baseline characteristics of the study population according to different age categories and the presence of DM. We then performed logistic regression to ex- amine the impact of body composition on the risk of DM.
Body composition was classified and expressed as quartiles of trunk fat/BMI and ASM/BMI. Next, we evaluated risk of DM according to quartiles of FMI and MMI after adjusting only for age and BMI, or by adding various metabolic parameters in- cluding age, BMI, systolic and diastolic BP, high-density lipo- protein cholesterol (HDL-C), TG, aspartate aminotransferase (AST), alanine aminotransferase (ALT), and lifestyle factors such as low income, current smoking, drinking, and regular exercise. Statistical significance was assumed at P<0.05. All statistical analyses were performed by an experienced profes- sional statistician who was also one of the authors.
RESULTS
Baseline characteristics of the study population
Among 16,893 individuals aged ≥30 years who completed
DXA measurement, a total of 1,307 individuals with missing data on BMI (n=30), trunk fat mass (n=374), or ASM (n=
117), or who missing data on fasting plasma glucose (n=722) or self-reported information on diagnosis of DM or antidia- betic medication (n=64) were excluded (Fig. 1). The baseline characteristics of the study participants according to age cate- gories and the presence of DM are described in Table 1. A total of 829 men with DM and 5,898 men without DM were includ- ed in this study. The proportion of subjects of DM was about 5%, 18.4%, and 18.5% in men aged 30 to 49, 50 to 69, and more than 70 years, respectively. In all age groups, subjects with DM had higher body weight, BMI, and waist circumference. Sub- jects with DM also had higher trunk fat and FMI and lower MMI although ASM did not differ according to the presence or absence of DM. Systolic BP was higher in subjects with DM in all age groups. Subjects with DM also had lower HDL-C and higher TG, AST, and ALT in all age groups. The percentage of subjects with low income was higher in subjects with DM aged 30 to 49 and 50 to 69 years.
A total of 792 women with DM and 8,067 women without DM were included in this study. The proportion of subjects of DM was about 2.4%, 12.4%, and 19.8% in women aged 30 to 49, 50 to 69, and more than 70 years, respectively. In women, patterns of anthropometric parameters, systolic BP, lipid levels, liver function tests and lifestyle according to the presence of DM were similar to those of men.
16,893 Individuals (aged ≥30 years) participated in the KNAHNES 2008 to 2011 and conducted DXA
15,586 Individuals were included
13,965 Without diabetes mellitus
(5,898 men, 8,067 women) 1,621 With diabetes mellitus (829 men, 792 women)
1,307 Individuals were excluded from analysis 30 With missing data on BMI
374 With missing data on trunk fat mass 117 With missing data on appendicular skeletal
muscle mass
722 With missing data on fasting plasma glucose 64 With missing data on diagnosis of diabetes
mellitus or anti-diabetic medication
Fig. 1. Flowchart of the study population. KNHANES, Korean National Health and Nutrition Examination Survey; DXA, dual- energy X-ray absorptiometry; BMI, body mass index.
186
Table 1. Baseline characteristics of study subjects stratified by age and status of DM VariableMenWomen 30–49 yr50–69 yr≥70 yr30–49 yr50–69 yr≥70 yr No DMDMNo DMDMNo DMDMNo DMDMNo DMDMNo DMDM Number2,8961522,2094977931803,950993,0794371,038256 Age, yr39.3±0.1642.9±0.45c57.5±0.1458.5±0.28b74.9±0.1774.6±0.4257.8±0.1865.8±1.10c58.2±0.1760.9±0.52c52.8±0.3657.4±0.66c WC, cm84.1±0.2188.1±0.84c85.1±0.2288.7±0.45c83.5±0.4288.0±0.78c76.1±0.2087.1±1.17c81.6±0.2287.2±0.56c81.8±0.3787.1±0.76c BMI, kg/m224.3±0.0725.6±0.33b23.9±0.0724.9±0.18c22.7±0.1323.9±0.27c22.9±0.0726.5±0.41c24.2±0.0625.5±0.19c23.6±0.1325.2±0.25c Trunk fat mass, kg16.0±0.1317.6±0.52b14.8±0.1416.0±0.28c13.9±0.2316.4±0.45c18.7±0.1223.0±0.76c20.0±0.1221.2±0.29b17.9±0.2420.4±0.44c FMI, m20.35±0.0030.39±0.01c0.34±0.0030.37±0.005c0.33±0.0050.39±0.009c0.39±0.0020.48±0.013c0.43±0.0030.47±0.005c0.40±0.0040.46±0.008c ASM, kg23.3±0.0723.5±0.3621.5±0.0821.5±0.1719.1±0.1218.8±0.2114.8±0.0516.1±0.26c14.4±0.0514.7±0.13b13.1±0.0713.5±0.15b MMI, m20.96±0.0030.93±0.012b0.90±0.0030.87±0.005c0.85±0.0040.79±0.008c0.65±0.0020.61±0.009c0.60±0.0020.58±0.004c0.56±0.0030.54±0.006b SBP, mm Hg115.2±0.33121.4±1.27c122.9±0.48125.8±1.05a128.4±0.77129.0±1.49108.2±0.26117.0±1.56c122.7±0.42129.5±0.94c132.1±0.70135.6±1.25a DBP, mm Hg78.2±0.2782.8±0.91c79.4±0.3278.0±0.55a73.7±0.4371.6±0.83a71.2±0.2075.9±0.97c77.2±0.2477.0±0.5174.8±0.3674.0±0.77 Fasting glucose, mg/dL93.7±0.21167.8±5.59c97.0±0.25144.9±2.37c96.1±0.45136.0±3.73c90.7±0.16164.7±6.33c94.4±0.2141.1±2.26c95.7±0.40140.3±3.33c TC, mg/dL192.4±0.73196.3±3.76190.7±0.89180.0±2.16c180.2±1.34181.3±3.72180.9±0.62195.7±4.82b202.3±0.86195.6±2.30b200.0±1.31198.3±2.94 LDL-C, mg/dL115.9±0.65110.6±3.44114.7±0.86101.1±1.87c109.2±1.24109.6±3.40109.7±0.55116.0±4.54126.8±0.73117.2±2.12c125.7±1.17120.4±2.53 HDL-C, mg/dL45.8±0.2543.3±0.98a45.8±0.3042.4±0.56c45.6±0.4942.0±0.94b51.8±0.2147.0±0.99c49.9±0.2746.1±0.69c46.2±0.4144.9±0.81 TG, mg/dL168.7±3.22241.7±21.43b163.9±3.73203.6±8.41c129.5±3.33149.9±7.38a98.7±1.32175.2±15.1c130.4±2.02165.3±5.17c141.3±2.96167.0±6.56b AST, IU/L24.7±0.3330.9±1.86b26.2±0.3828.0±0.9324.8±0.5226.1±1.6218.4±0.1225.8±2.34b22.6±0.2024.5±0.62b22.6±0.2723.8±0.64 ALT, IU/L29.4±0.5440.2±2.47c25.2±0.4029.5±0.97c19.5±0.4523.9±1.28b15.8±0.2029.7±4.00b20.3±0.3025.5±0.86c17.0±0.3021.1±0.76c Low income695 (25.1)43 (33.3)a506 (23.1)139 (32.3)b184 (23.4)42 (22.8)982 (27)35 (41.2)b734 (24.7)110 (24.9)271 (26.3)52 (21.9) Current smoker1,534 (54.1)85 (56.8)805 (38.6)177 (40.3)193 (24.6)41 (24.3)232 (6.6)3 (2.5)111 (4.1)14 (1.9)a65 (7.3)16 (7.7) Drinking2,322 (80.1)117 (78.5)1,605 (74.2)347 (72.4)438 (56.5)90 (51.2)1,934 (49.2)46 (48)903 (31.8)93 (24.2)a168 (16.1)37 (16) Regular exercise554 (19.6)35 (22.2)439 (20.9)88 (19.2)88 (11.1)20 (9.7)584 (15.2)13 (12.4)451 (15.1)44 (12.6)82 (7.7)22 (8.3) Values are presented as mean±standard error or number (%). DM, diabetes mellitus; WC, waist circumference; BMI, body mass index; FMI, fat mass index; ASM, appendicular skeletal muscle; MMI, muscle mass index; SBP, systolic blood pressure; DBP, diastolic blood pressure; TC, total cholesterol; LDL-C, low-density lipoprotein cholesterol; HDL-C, high-density lipoprotein cholesterol; TG, triglyceride; AST, aspartate aminotransferase; ALT, alanine aminotransferase. aP<0.05, bP<0.01, cP<0.001 in t-test for continuous variables and chi-square test for categorical variables comparing non-diabetics with subjects with diabetes mellitus.
187 Age-related associations between body composition and
DM in men and women after adjusting for age and BMI The age and BMI-adjusted odds ratios (ORs) and 95% confi- dence intervals (CIs) for the association of the quartiles of FMI and MMI with DM were analyzed by logistic regression and stratified by age (Fig. 2, Supplementary Table 1). In 30 to 69-year-old men, the subjects with the FMI Q4 showed a sig- nificantly increased risk for DM (OR, 2.311; 95% CI, 1.121 to 4.764 for 30 to 49-year-old men) (OR, 1.579; 95% CI, 1.010 to 2.468 for 50 to 69-year-old men) compared with those with FMI Q1, while those with FMI Q2 and Q3 exhibited no defi- nite increased risk. However, in elderly men (more than 70 years), there was a sequentially increased risk for DM accord-
ing to the quartiles of FMI (P=0.001). The ORs were 2.947 (95% CI, 1.481 to 5.864), 3.325 (95% CI, 1.600 to 6.910) and 5.063 (95% CI, 2.391 to 10.722) for Q2, Q3, and Q4 of FMI, re- spectively. In contrast, the quartiles of MMI had no significant association with DM in 30 to 49-year-old men. In 50 to 69-year-old men, there was a statistically significant associa- tion between MMI quartiles and DM (P=0.004) after adjust- ing age and BMI without considering other metabolic risk fac- tor; those with MMI Q4 showed a significant negative associa- tion with DM (OR, 0.481; 95% CI, 0.326 to 0.71) compared those with MMI Q1. Elderly men (≥70 years) exhibited a graded decreased risk of DM according to increasing MMI quartiles (P<0.001). The ORs were 0.476 (95% CI, 0.288 to
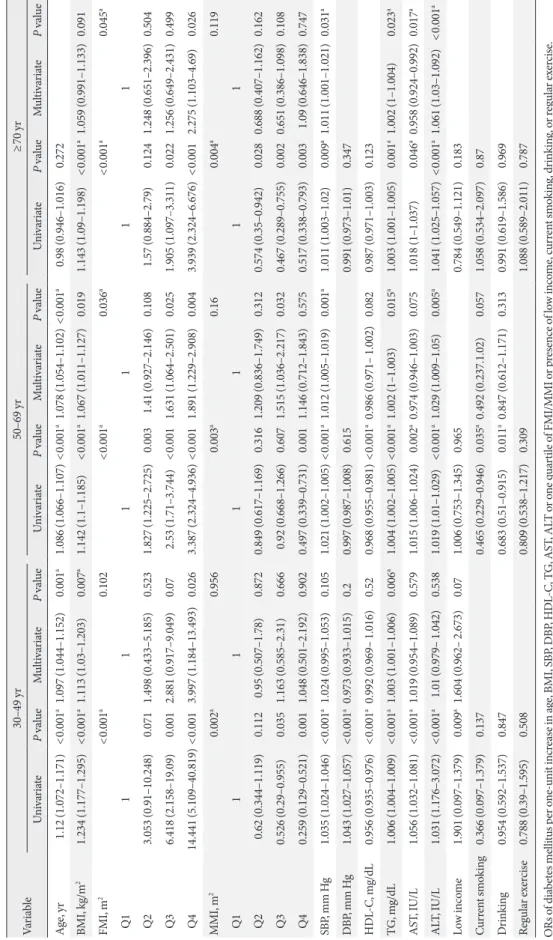
Fig. 2. Age and body mass index, adjusted odds ratio (ORs) (95% confidence intervals [CIs]) for diabetes mellitus by quartiles of (A) fat mass index (FMI) and (B) muscle mass index (MMI) stratified by age groups (30 to 49, 50 to 69, and ≥70 years) in men and women.
15
10
5
0
3
2
1
0
15
10
5
0
3
2
1
0
1 1
Adjusted OR (95% CI)Adjusted OR (95% CI) Adjusted OR (95% CI)Adjusted OR (95% CI)
Q1 Q2 Q3 Q4
Q1 Q2 Q3 Q4
Q1 Q2 Q3 Q4
Q1 Q2 Q3 Q4 Q1 Q2 Q3 Q4
Q1 Q2 Q3 Q4
Q1 Q2 Q3 Q4
Q1 Q2 Q3 Q4 Q1 Q2 Q3 Q4
Q1 Q2 Q3 Q4
Q1 Q2 Q3 Q4
Q1 Q2 Q3 Q4 30−49 yr
30−49 yr
30−49 yr
30−49 yr 50−69 yr
50−69 yr
50−69 yr
50−69 yr
≥70 yr
≥70 yr
≥70 yr
≥70 yr Men
FMI
MMI Men
Women
Women
A
B
188
0.787), 0.557 (95% CI, 0.339 to 0.916) and 0.190 (95% CI, 0.102 to 0.355) for Q2, Q3, and Q4 of MMI, respectively. These re- sults suggested that elderly men were more vulnerable to unfa- vorable body composition such as high visceral fat and low muscle mass than were middle-aged men.
In 30 to 49-year-old women, although there was no statisti- cally significant association between FMI quartiles and DM (P=0.083), subjects with FMI Q3 and Q4 had increased risk for DM (OR, 2.949; 95% CI, 1.020 to 8.532 for Q3) (OR, 4.111;
95% CI, 1.319 to 12.813 for Q4) compared to those with FMI Q1. On the other hand, in 50 to 69-year-old women, there was a sequentially increased risk for DM according to the quartiles of FMI (P=0.003). The ORs were 1.517 (95% CI, 1.014 to 2.270), 1.813 (95% CI, 1.205 to 2.729) and 2.169 (95% CI, 1.433 to 3.285) for Q2, Q3, and Q4 of FMI, respectively. In elderly women (≥70 years), the subjects with FMI Q4 showed a sig- nificantly increased risk for DM (OR, 2.493; 95% CI, 1.253 to 4.960) compared to those with FMI Q1 and FMI quartiles were significantly associated with DM (P=0.017). In contrast, there was no statistically significant association between MMI and DM in any age group, although subjects with MMI Q3 had in- creased risk for DM (OR, 1.515; 95% CI, 1.036 to 2.217) com- pared to those with MMI Q1 in women aged 50 to 69 years.
Age-related associations between body composition and DM in men and women after adjusting for other metabolic parameters
We performed univariate and multivariate logistic regression analyses to evaluate the association of body composition and other metabolic parameters with DM (Tables 2 and 3). In men, FMI remained significantly associated with DM only in age over 70 years in multivariate analysis after adjusting for other metabolic risk factors (P=0.049). In that age group, as the quartile of FMI increased, the risk of DM increased. The OR of subjects with FMI Q4 was 3.116 (95% CI, 1.405 to 6.914). Sim- ilarly, MMI had a significant negative association with DM only in age over 70 years in multivariate analysis (P=0.001).
The OR in subjects with MMI Q4 was 0.295 (95% CI, 0.157 to 0.554). However, in men aged 50 to 69 years, the significant as- sociation between the quartile of MMI and DM (P=0.004) (Supplementary Table 1) was disappeared after adjusting other metabolic risk factors (P=0.12), although subjects with MMI Q4 had decreased risk for DM (OR, 0.621; 95% CI, 0.411 to 0.937) compared to those with MMI Q1. In that age group, metabolic parameters such as BMI, systolic and diastolic BP,
HDL-C, and ALT and lifestyle parameters including low in- come and current smoking were statistically significant risk factors for DM. Finally, in men aged less than 50 years, age, TG level, and low income were significant factors related to DM (Table 2).
In women, FMI had a significant positive association with DM in univariate analysis in all age groups and remained sig- nificantly associated with DM only in subjects more than 50 years old after adjusting for other metabolic risk factors (P=
0.036 for women aged 50 to 69 and P=0.045 for women aged
≥70 years). The ORs in subjects with the FMI Q4 were 1.891 (95% CI, 1.229 to 2.908) and 2.275 (95% CI, 1.103 to 4.69) in age group 50 to 69 and ≥70 years, respectively. In women aged 30 to 49 years, there was no statistical significant association between FMI quartiles and DM (P=0.102), although subjects with FMI Q4 had increased risk for DM (OR, 3.997; 95% CI, 1.184 to 13.493) compared with those with FMI Q1. BMI itself was a statistically significant risk factor for DM in women aged 30 to 49 years (OR, 1.113; 95% CI, 1.03 to 1.203). In contrast, MMI had a significant negative association with DM in uni- variate analysis in all age groups; however, these associations all disappeared in multivariate analysis (Table 3).
DISCUSSION
The results of the present study revealed age-related differential associations between body composition and DM in both men and women. In men, after excluding the influence of other metabolic parameters, FMI and MMI were significant inde- pendent risk factors for DM especially in those over 70 years of age. In women, the impact of FMI on the presence of DM re- mained significant at age over 50 years but there was no signifi- cant association between MMI and DM in all ages of women in fully adjusted model.
In addition to general obesity, the distribution of body fat is independently associated with metabolic syndrome and DM [21,22]. Visceral adipose tissue, as measured using computed tomography, increased the risk of metabolic syndrome in el- derly men and women, particularly among those of normal body weight [21]. Moreover, visceral adipose tissue mass was higher in men and women with type 2 DM and was associated with higher fasting insulin levels in normal-weight men and women [22]. DXA is a simple tool to measure regional fat and lean masses in individuals. Using DXA, several studies showed that higher levels of trunk fat were associated with insulin re-
189 Table 2. OR (95% CI) for the association of metabolic parameters with the presence of diabetes mellitus stratified by age in men Variable 30–49 yr50–69 yr≥70 yr UnivariateP valueMultivariateP valueUnivariateP valueMultivariateP valueUnivariateP valueMultivariateP value Age, yr1.128 (1.09–1.168)<0.001a1.123 (1.081–1.166)<0.001a1.032 (1.014–1.051)0.001a1.007 (0.985–1.03)0.5170.979 (0.925–1.037)0.473 BMI, kg/m21.126 (1.064–1.192)<0.001a1.049 (0.963–1.142)0.271.134 (1.085–1.186)<0.001a1.094 (1.029–1.163)0.004a1.157 (1.085–1.234)<0.001a1.03 (0.946–1.121)0.497 FMI, m20.001a0.208<0.001a0.202<0.001a0.049a Q1111111 Q2 2.156 (1.135–4.099)0.0191.436 (0.738–2.797)0.2861.314 (0.911–1.895)0.1440.987 (0.655–1.489)0.9513.27 (1.693–6.318)0.0012.216 (1.098–4.47)0.026 Q32.086 (1.069–4.07)0.0311.298 (0.643–2.623)0.4661.52 (1.059–2.181)0.0231.007 (0.651–1.56)0.9733.876 (1.972–7.62)<0.0012.297 (1.062–4.965)0.035 Q43.358 (1.818–6.206)0.0011.993 (0.978–4.062)0.0582.409 (1.721–3.372)<0.0011.394 (0.863–2.251)0.1746.302 (3.234–12.282)<0.0013.116 (1.405–6.914)0.005 MMI, m20.09<0.001a0.12<0.001a0.001a Q111111 Q20.739 (0.46–1.187)0.210.695 (0.505–0.956)0.0260.849 (0.607–1.187)0.3370.468 (0.286–0.765)0.0030.521 (0.312–0.868)0.012 Q30.649 (0.392–1.074)0.0930.65 (0.481–0.878)0.0050.938 (0.665–1.323)0.7130.497 (0.303–0.815)0.0060.665 (0.393–1.126)0.128 Q40.515 (0.3–0.882)0.0160.346 (0.241–0.497)<0.0010.621 (0.411–0.937)0.0240.162 (0.089–0.294)<0.0010.295 (0.157–0.554)0.001 SBP, mm Hg1.027 (1.017–1.038)<0.001a1.007 (0.98–1.034)0.631.01 (1.002–1.017)0.009a1.032 (1.02–1.044)<0.001a1.002 (0.992–1.012)0.71 DBP, mm Hg1.036 (1.022–1.05)<0.001a1.011 (0.976–1.047)0.5430.987 (0.976–0.998)0.02a0.944 (0.927–0.961)<0.001a0.978 (0.959–0.997)0.024a0.968 (0.948–0.989)0.003a HDL-C, mg/dL0.975 (0.953–0.997)0.029a0.992 (0.969–1.016)0.5150.97 (0.958–0.982)<0.001a0.983 (0.971–0.995)0.005a0.97 (0.95–0.99)0.003a0.983 (0.961–1.005)0.122 TG, mg/dL1.002 (1.001–1.003)<0.001a1.001 (1–1.002)0.026a1.002 (1.001–1.002)0.001a1.001 (1–1.002)0.0661.003 (1.001–1.005)0.011 (0.997–1.002)0.983 AST, IU/L1.009 (1.002–1.016)0.016a1.005 (1–1.011)0.0631.006 (0.999–1.013)0.0711.005 (0.995–1.016)0.328 ALT, IU/L1.006 (0.997–1.015)0.1911.014 (1.007–1.02)<0.001a1.01 (1.003–1.017)0.006a1.025 (1.011–1.039)0.001a1.023 (1.009–1.038)0.002a Low income1.491 (1–2.222)0.049a1.548 (1.022–2.344)0.039a1.588 (1.195–2.109)0.002a1.631 (1.209–2.201)0.001a0.967 (0.629–1.487)0.879 Current smoking1.114 (0.791–1.568)0.5351.076 (0.849–1.363)0.5450.981 (0.632–1.522)0.931 Drinking0.905 (0.573–1.429)0.6690.913 (0.713–1.168)0.4660.81 (0.56–1.172)0.263 Regular exercise1.167 (0.776–1.754)0.4580.899 (0.669–1.207)0.4770.859 (0.463–1.592)0.628 ORs of diabetes mellitus per one-unit increase in age, BMI, SBP, DBP, HDL-C, TG, AST, ALT or one quartile of FMI/MMI or presence of low income, current smoking, drinking, or regular exercise. OR, odds ratio; CI, confidence interval; BMI, body mass index; FMI, fat mass index; MMI, muscle mass index; SBP, systolic blood pressure; DBP, diastolic blood pressure; HDL-C, high-density lipoprotein cholesterol; TG, triglyceride; AST, aspartate aminotransferase; ALT, alanine aminotransferase. aValues denote statistical significance at the P<0.05 level.
190
Table 3. ORs (95% CIs) for the association of metabolic parameters with the presence of diabetes mellitus stratified by age in women Variable 30–49 yr50–69 yr≥70 yr UnivariateP valueMultivariateP valueUnivariateP valueMultivariateP valueUnivariateP valueMultivariateP value Age, yr1.12 (1.072–1.171)<0.001a1.097 (1.044–1.152)0.001a1.086 (1.066–1.107)<0.001a1.078 (1.054–1.102)<0.001a0.98 (0.946–1.016)0.272 BMI, kg/m21.234 (1.177–1.295)<0.001a1.113 (1.03–1.203)0.007a1.142 (1.1–1.185)<0.001a1.067 (1.011–1.127)0.0191.143 (1.09–1.198)<0.001a1.059 (0.991–1.133)0.091 FMI, m2<0.001a0.102<0.001a0.036a<0.001a0.045a Q1111111 Q23.053 (0.91–10.248)0.0711.498 (0.433–5.185)0.5231.827 (1.225–2.725)0.0031.41 (0.927–2.146)0.1081.57 (0.884–2.79)0.1241.248 (0.651–2.396)0.504 Q36.418 (2.158–19.09)0.0012.881 (0.917–9.049)0.072.53 (1.71–3.744)<0.0011.631 (1.064–2.501)0.0251.905 (1.097–3.311)0.0221.256 (0.649–2.431)0.499 Q414.441 (5.109–40.819)<0.0013.997 (1.184–13.493)0.0263.387 (2.324–4.936)<0.0011.891 (1.229–2.908)0.0043.939 (2.324–6.676)<0.0012.275 (1.103–4.69)0.026 MMI, m20.002a0.9560.003a0.160.004a0.119 Q1111111 Q20.62 (0.344–1.119)0.1120.95 (0.507–1.78)0.8720.849 (0.617–1.169)0.3161.209 (0.836–1.749)0.3120.574 (0.35–0.942)0.0280.688 (0.407–1.162)0.162 Q30.526 (0.29–0.955)0.0351.163 (0.585–2.31)0.6660.92 (0.668–1.266)0.6071.515 (1.036–2.217)0.0320.467 (0.289–0.755)0.0020.651 (0.386–1.098)0.108 Q40.259 (0.129–0.521)0.0011.048 (0.501–2.192)0.9020.497 (0.339–0.731)0.0011.146 (0.712–1.843)0.5750.517 (0.338–0.793)0.0031.09 (0.646–1.838)0.747 SBP, mm Hg1.035 (1.024–1.046)<0.001a1.024 (0.995–1.053)0.1051.021 (1.002–1.005)<0.001a1.012 (1.005–1.019)0.001a1.011 (1.003–1.02)0.009a1.011 (1.001–1.021)0.031a DBP, mm Hg1.043 (1.027–1.057)<0.001a0.973 (0.933–1.015)0.20.997 (0.987–1.008)0.6150.991 (0.973–1.01)0.347 HDL-C, mg/dL0.956 (0.935–0.976)<0.001a0.992 (0.969– 1.016)0.520.968 (0.955–0.981)<0.001a0.986 (0.971– 1.002)0.0820.987 (0.971–1.003)0.123 TG, mg/dL1.006 (1.004–1.009)<0.001a1.003 (1.001–1.006)0.006a1.004 (1.002–1.005)<0.001a1.002 (1–1.003)0.015a1.003 (1.001–1.005)0.001a1.002 (1–1.004)0.023a AST, IU/L1.056 (1.032–1.081)<0.001a1.019 (0.954–1.089)0.5791.015 (1.006–1.024)0.002a0.974 (0.946–1.003)0.0751.018 (1–1.037)0.046a0.958 (0.924–0.992)0.017a ALT, IU/L1.031 (1.176–3.072)<0.001a1.01 (0.979– 1.042)0.5381.019 (1.01–1.029)<0.001a1.029 (1.009–1.05)0.005a1.041 (1.025–1.057)<0.001a1.061 (1.03–1.092)<0.001a Low income1.901 (0.097–1.379)0.009a1.604 (0.962– 2.673)0.071.006 (0.753–1.345)0.9650.784 (0.549–1.121)0.183 Current smoking0.366 (0.097–1.379)0.137 0.465 (0.229–0.946)0.035a0.492 (0.237.1.02)0.0571.058 (0.534–2.097)0.87 Drinking0.954 (0.592–1.537)0.8470.683 (0.51–0.915)0.011a0.847 (0.612–1.171)0.3130.991 (0.619–1.586)0.969 Regular exercise0.788 (0.39–1.595)0.5080.809 (0.538–1.217)0.3091.088 (0.589–2.011)0.787 ORs of diabetes mellitus per one-unit increase in age, BMI, SBP, DBP, HDL-C, TG, AST, ALT or one quartile of FMI/MMI or presence of low income, current smoking, drinking, or regular exercise. OR, odds ratio; CI, confidence interval; BMI, body mass index; FMI, fat mass index; MMI, muscle mass index; SBP, systolic blood pressure; DBP, diastolic blood pressure; HDL-C, high-density lipoprotein cholesterol; TG, triglyceride; AST, aspartate aminotransferase; ALT, alanine aminotransferase. aValues denote statistical significance at the P<0.05 level.
191 sistance and metabolic abnormalities related with cardiovascu-
lar diseases [23-25]. The rate of lipolysis is accelerated in trunk fat and circulating free fatty acids released from trunk fat con- tribute to disturbances in glucose metabolism [26,27]. In con- trast, leg fat may play a protective role as adipocytes in these regions are less sensitive to lipolytic stimuli and more likely to take up free fatty acids from the circulation [28,29]. Actually, higher leg fat mass was associated with a lower risk of DM in Korean adults aged 50 years or older [30]. As a result, body fat distribution critically mediates metabolic disturbances rather than simple obesity.
Recent and growing evidence has focused on the reciprocal negative cycle between the accumulation of visceral fat and muscle atrophy. Skeletal muscle mass comprises a large por- tion of body mass and is the major site for disposal of ingested glucose in individuals with normal glucose tolerance [31,32].
Previous epidemiologic studies showed that skeletal muscle mass was inversely associated with insulin resistance and the risk of developing type 2 DM. A cross-sectional study by Sri- kanthan et al. [9] based on the third National Health and Nu- trition Examination Survey (NHANES) showed that muscle mass was inversely associated with insulin resistance and the prevalence of prediabetes in middle-aged adults]. A recent co- hort study of young and middle-aged Korean men and women reported that muscle mass was negatively associated with the development of type 2 DM [33]. These two studies estimated the ratio of total skeletal muscle mass to total body weight as MMI using bioelectrical impedance. Using DXA, we used ASM/BMI as an indicator of muscle mass. Recently, ASM/BMI was proposed as an operational method for calculating muscle mass by the FNIH Sarcopenia Project [19]. By performing sta- tistical classification and regression tree analysis, they reported the MMI to be the most strongly and directly correlated index of weakness and slowness combined with sarcopenia [19].
As the changes in patterns of body composition according to age differ between men and women, it is critical to examine the differential relationships between body composition and DM by age and sex. Our study examined the age-related association of body composition with DM in both men and women aged 30 years and more. We compared the impact of body composi- tion and other metabolic parameters as determinants of DM in three age groups; 30 to 49, 50 to 69, and ≥70 years. Metabolic parameters such as BMI, BP, HDL-C, ALT and lifestyle factors such as low income and current smoking are risk factors for DM in men in their 50s and 60s. The 50 to 69-year-old men in
the highest quartile of MMI showed lower risk of DM com- pared to those in the lowest quartile of MMI, although there was no grossly significant difference in the risk of DM across MMI quartiles. Meanwhile, both FMI and MMI quartiles re- main independent risk factors for DM in men aged 70 years or more. In elderly men, DM risk decreased significantly as MMI quartiles increased; however, in women, MMI did not impact the presence of DM despite the risk of DM was increased in 50 to 69-year-old women with Q3 versus Q1 of MMI. Since MMI had a significant negative association with DM in univariate analysis in all age groups of women and the amount of muscle mass is a well-known protective factor for glucose intolerance, the significant increase in DM in 50 to 69-year-old women with MMI Q3 versus Q1 was unexpected. The reason for this finding remains unclear and there are no biological explana- tions for this finding. Therefore, we thought that it might be the incidental finding with a trivial clinical meaning. Similar to our study results, Kim et al. [34] reported that a high ASM sig- nificantly decreased the risk of incident DM regardless of obe- sity status in men but was not protective in women. Tatsukawa et al. [35] also reported that percentage of trunk fat was posi- tively associated with the development of DM in both men and women, whereas appendicular lean mass was negatively asso- ciated with DM risk only in normal-weight men.
Although we were unable to clarify the underlying mecha- nism of these sex-based differences in this study, the difference could arise from the differential influence of sex hormones on the shifting of body composition in men and women. In men, a decline in the circulating level of testosterone according to age deteriorates muscle mass and function, consequently lead- ing to visceral obesity [36], whereas in postmenopausal wom- en, the lack of estrogen leads directly to visceral fat accumula- tion [37]. In the present study, BMI, not FMI, was an impor- tant determinant for DM in women younger than 50 years of age; however, FMI was a significant independent risk factor for DM in women over 50 years old. When we further divided women according to menopause to exam the effects of estro- gen, there was a statistically significant association between FMI quartiles and DM only in postmenopausal women (P=
0.004) but not in premenopausal women (P=0.213). In con- trast, BMI was significantly associated with DM in premeno- pausal women (P=0.015) but not in postmenopausal women (P=0.063). These results suggested the greater importance of body fat distribution on the incidence of DM especially in postmenopausal women, whereas the imbalance between vis-
192
ceral and lower extremity subcutaneous fat was less critical for DM in premenopausal women. Similar to these results, we previously published that waist-to-hip ratio (WHR), a repre- sentative simple indicator for body fat distribution, had a supe- rior predictive value for subclinical atherosclerosis compared to BMI in postmenopausal women, whereas WHR and BMI showed a same power to predict subclinical atherosclerosis in premenopausal women [38]. Nevertheless, we must consider the possibility that the lack of statistical significance in the as- sociation between FMI quartiles and DM for women aged 30 to 49 years might have been influenced by the low incidence of DM in this age group. In this study, 30 to 49-year-old women in the highest quartile of FMI showed higher risk of DM com- pared to those in the lowest quartile of FMI, although there was no grossly significant difference in the risk of DM across FMI quartiles. To clarify the association between abdominal fat accumulation and development of DM in this age women, a larger scaled cohort study should be followed.
This study has several limitations. First, we could not adjust for individual family history of DM due to lack of information.
The health interview survey in the KNHANES IV (2008 and 2009) did not include this information. However, the impact of a family history of DM on type 2 DM is stronger in young adults and mediates changes in metabolic traits [39]; thus, it is unlikely to have affected our study results that the impacts of metabolic parameters are important determinants for DM in young age groups in both sexes. Second, each KNHANES was conducted with different subjects and since they were based on self-administered questionnaires, the potential for recall bias, residual or unmeasured confounding factors, and uninten- tional errors should be considered. Third, despite the potential impacts of anti-hypertensive agents and lipid-lowering agents on the development of DM, we could not adjust the medica- tion history of these drugs as covariates duet to high preva- lence of both hypertension and hyperlipidemia in patients with DM. Moreover, the prescription rate of those medications is naturally high in the elderly, which can mask the significant as- sociation between body composition and DM in older people.
Furthermore, KNHANES does not have data on the specific drug classes or types, duration of treatment and the drug dos- es; we are not able analyze accurately the effects of anti-hyper- tensive and lipid-lowering agents on the development of DM.
Fourth, due to the cross-sectional nature of the study, we could not investigate causal relationships or their underlying mecha- nism. Finally, because of ethnic differences in body fat distri-
bution and lean mass volume [40], further study is needed to investigate whether age-related impacts of body composition on DM have similar tendencies in other ethnic groups. Despite the limitations in the study design and data, the strength of our study was the assessment of the association between the DXA scan-measured muscle and fat mass and DM in a nationally representative sample.
By assessing the nationwide survey data representing the Korean population, we found the clinical significance of mus- cle mass and fat mass with DM, especially in older adults. After adjusting for multiple metabolic parameters, both FMI and MMI remained independent risk factors for DM in men aged 70 years or more. In women over 50 years, FMI, not MMI, was independently associated with DM. Therefore, different body composition according to sex; that is, abdominal fat and mus- cle mass in elderly men ≥70 years old and abdominal fat in women ≥50 years old, should be included as a public health screening tool and preventive target for DM.
SUPPLEMENTARY MATERIALS
Supplementary materials related to this article can be found online at https://doi.org/10.4093/dmj.2019.0171.
CONFLICTS OF INTEREST
No potential conflict of interest relevant to this article was re- ported.
AUTHOR CONTRIBUTIONS
Conception or design: E.R., J.A.K., Y.B.L., S.H., H.J.Y.
Acquisition, analysis, or interpretation of data: E.R., S.Y.H., H.J.Y.
Drafting the work or revising: E.R., N.H.K., J.A.S., S.G.K., N.H.K., K.M.C., S.H.B., H.J.Y.
Final approval of the manuscript: E.R., S.Y.H., J.A.K., Y.B.L., S.H., N.H.K., J.A.S., S.G.K., N.H.K., K.M.C., S.H.B., H.J.Y.
ORCID
Eun Roh https://orcid.org/0000-0001-8413-5006 Hye Jin Yoo https://orcid.org/0000-0003-0600-0266
193
FUNDING
None
ACKNOWLEDGMENTS
The authors would like to thank all subjects and researchers who participate in KNHANES IV and V.
This work was supported by Basic Science Research Pro- gram through the National Research Foundation of Korea (NRF) funded by the Ministry of Education (Grant No.
2018R1D1A1B07047587 and 2018R1D1A1B07050991). The funders had no role in the study design, data collection, analy- sis, and interpretation, decision to publish, or preparation of the manuscript.
REFERENCES
1. Baumgartner RN, Stauber PM, McHugh D, Koehler KM, Gar- ry PJ. Cross-sectional age differences in body composition in persons 60+ years of age. J Gerontol A Biol Sci Med Sci 1995;
50:M307-16.
2. Kyle UG, Genton L, Hans D, Karsegard L, Slosman DO, Pich- ard C. Age-related differences in fat-free mass, skeletal muscle, body cell mass and fat mass between 18 and 94 years. Eur J Clin Nutr 2001;55:663-72.
3. Yamada M, Moriguch Y, Mitani T, Aoyama T, Arai H. Age-de- pendent changes in skeletal muscle mass and visceral fat area in Japanese adults from 40 to 79 years-of-age. Geriatr Gerontol Int 2014;14 Suppl 1:8-14.
4. Gastaldelli A, Miyazaki Y, Pettiti M, Matsuda M, Mahankali S, Santini E, et al. Metabolic effects of visceral fat accumulation in type 2 diabetes. J Clin Endocrinol Metab 2002;87:5098-103.
5. Yatagai T, Nagasaka S, Taniguchi A, Fukushima M, Nakamura T, Kuroe A, et al. Hypoadiponectinemia is associated with vis- ceral fat accumulation and insulin resistance in Japanese men with type 2 diabetes mellitus. Metabolism 2003;52:1274-8.
6. Fontana L, Eagon JC, Trujillo ME, Scherer PE, Klein S. Visceral fat adipokine secretion is associated with systemic inflamma- tion in obese humans. Diabetes 2007;56:1010-3.
7. Gabriely I, Ma XH, Yang XM, Atzmon G, Rajala MW, Berg AH, et al. Removal of visceral fat prevents insulin resistance and glucose intolerance of aging: an adipokine-mediated pro- cess? Diabetes 2002;51:2951-8.
8. Srikanthan P, Hevener AL, Karlamangla AS. Sarcopenia exac-
erbates obesity-associated insulin resistance and dysglycemia:
findings from the National Health and Nutrition Examination Survey III. PLoS One 2010;5:e10805.
9. Srikanthan P, Karlamangla AS. Relative muscle mass is inverse- ly associated with insulin resistance and prediabetes. Findings from the third National Health and Nutrition Examination Survey. J Clin Endocrinol Metab 2011;96:2898-903.
10. Son JW, Lee SS, Kim SR, Yoo SJ, Cha BY, Son HY, et al. Low muscle mass and risk of type 2 diabetes in middle-aged and older adults: findings from the KoGES. Diabetologia 2017;
60:865-72.
11. Janssen I, Heymsfield SB, Wang ZM, Ross R. Skeletal muscle mass and distribution in 468 men and women aged 18-88 yr. J Appl Physiol (1985) 2000;89:81-8.
12. Fantin F, Di Francesco V, Fontana G, Zivelonghi A, Bissoli L, Zoico E, et al. Longitudinal body composition changes in old men and women: interrelationships with worsening disability.
J Gerontol A Biol Sci Med Sci 2007;62:1375-81.
13. Fan B, Shepherd JA, Levine MA, Steinberg D, Wacker W, Barden HS, et al. National Health and Nutrition Examination Survey whole-body dual-energy X-ray absorptiometry refer- ence data for GE Lunar systems. J Clin Densitom 2014;17:344- 77.
14. Hong S, Oh HJ, Choi H, Kim JG, Lim SK, Kim EK, et al. Char- acteristics of body fat, body fat percentage and other body composition for Koreans from KNHANES IV. J Korean Med Sci 2011;26:1599-605.
15. Carr MC. The emergence of the metabolic syndrome with menopause. J Clin Endocrinol Metab 2003;88:2404-11.
16. Auro K, Joensuu A, Fischer K, Kettunen J, Salo P, Mattsson H, et al. A metabolic view on menopause and ageing. Nat Com- mun 2014;5:4708.
17. Lim S, Meigs JB. Ectopic fat and cardiometabolic and vascular risk. Int J Cardiol 2013;169:166-76.
18. Friedewald WT, Levy RI, Fredrickson DS. Estimation of the concentration of low-density lipoprotein cholesterol in plasma, without use of the preparative ultracentrifuge. Clin Chem 1972;18:499-502.
19. Cawthon PM, Peters KW, Shardell MD, McLean RR, Dam TT, Kenny AM, et al. Cutpoints for low appendicular lean mass that identify older adults with clinically significant weakness. J Gerontol A Biol Sci Med Sci 2014;69:567-75.
20. American Diabetes Association. 15. Diabetes care in the hospi- tal: standards of medical care in diabetes-2019. Diabetes Care 2019;42(Suppl 1):S173-81.


![Fig. 2. Age and body mass index, adjusted odds ratio (ORs) (95% confidence intervals [CIs]) for diabetes mellitus by quartiles of (A) fat mass index (FMI) and (B) muscle mass index (MMI) stratified by age groups (30 to 49, 50 to 69, and ≥70 years) in men](https://thumb-ap.123doks.com/thumbv2/123dokinfo/5220484.123311/5.892.106.813.441.1018/adjusted-confidence-intervals-diabetes-mellitus-quartiles-muscle-stratified.webp)