D I A B E T E S & M E T A B O L I S M J O U R N A L
This is an Open Access article distributed under the terms of the Creative Commons Attribution Non-Commercial License (http://creativecommons.org/licenses/by-nc/4.0/) which permits unrestricted non-commercial use, distribution, and reproduction in any medium, provided the original work is properly cited.
Unusual Suspects in the Development of Obesity- Induced Inflammation and Insulin Resistance: NK cells, iNKT cells, and ILCs
Beatriz Dal Santo Francisco Bonamichi, Jongsoon Lee
The Joslin Diabetes Center and Department of Medicine, Harvard Medical School, Boston, MA, USA
The notion that obesity-induced inflammation mediates the development of insulin resistance in animal models and humans has been gaining strong support. It has also been shown that immune cells in local tissues, in particular in visceral adipose tissue, play a major role in the regulation of obesity-induced inflammation. Specifically, obesity increases the numbers and activation of pro- inflammatory immune cells, including M1 macrophages, neutrophils, Th1 CD4 T cells, and CD8 T cells, while simultaneously suppressing anti-inflammatory cells such as M2 macrophages, CD4 regulatory T cells, regulatory B cells, and eosinophils. Recent- ly, however, new cell types have been shown to participate in the development of obesity-induced inflammation and insulin resis- tance. Some of these cell types also appear to regulate obesity. These cells are natural killer (NK) cells and innate lymphoid cells (ILCs), which are closely related, and invariant natural killer T (iNKT) cells. It should be noted that, although iNKT cells resemble NK cells in name, they are actually a completely different cell type in terms of their development and functions in immunity and metabolism. In this review, we will focus on the roles that these relatively new players in the metabolism field play in obesity-in- duced insulin resistance and the regulation of obesity.
Keywords: Diabetes mellitus, type 2; Innate lymphoid cells; Insulin resistance; Killer cells, natural; Natural killer T-cells; Obesity
Corresponding author: Jongsoon Lee http://orcid.org/0000-0002-0891-5059 The Joslin Diabetes Center and Department of Medicine, Harvard Medical School, One Joslin Place, Boston, MA 02215, USA
E-mail: jongsoon.lee@joslin.harvard.edu
INTRODUCTION
The prevalence of obesity has increased dramatically recently, both in the United States (in 2011, 33.7% of men and 36.5% of women in the United States were obese) and worldwide (in 2014, 10.8% of men and 14.9% of women were obese) [1,2].
Obesity imposes a tremendous health burden on society be- cause it associates strongly with many diseases, including car- diovascular disease and immunological disorders such as rheumatoid arthritis and multiple sclerosis. Obesity is also considered to be the main cause of insulin resistance and type 2 diabetes mellitus (T2DM). Recent studies suggest that one of the mechanisms that drive the development of insulin resis-
tance and T2DM is obesity-induced inflammation [3], and that this inflammation is mainly mediated by immune cells in local tissues, in particular adipose tissue [4]. Moreover, it has been shown that adipose tissues contain many different types of immune cells and that obesity changes the numbers and ac- tivation status of these cells.
Obesity-induced inflammation shares many of the charac- teristics of more classical examples of inflammation such as in- fection-induced inflammation. For example, in the classical immunology field, immune system responses are often classi- fied into two categories, namely, innate immunity and adaptive immunity. These two distinct but related arms of the immune system also operate in obesity-induced inflammation.
https://doi.org/10.4093/dmj.2017.41.4.229 pISSN 2233-6079 · eISSN 2233-6087
INNATE IMMUNITY VERSUS ADAPTIVE IMMUNITY
The innate and adaptive arms of the immune system are de- signed to protect the organism from the harmful insults of for- eign agents, including viruses, bacteria, and the pathogenic products of foreign microorganisms. This protection can be achieved by innate immune responses that clear away the dan- gerous viruses and bacteria during infection, remove the host cells that are affected by these pathogens, and repair the tissue damage that has arisen during the infection. Later during the infection, the host also mobilizes adaptive immunity. Thereaf- ter, the adaptive arm of the immune system prepares for the next infection with the same pathogen.
It is crucial that, while the host is defending itself from the infection, its immune system does not also attack the host.
Thus, it is essential that the immune defense system can differ- entiate between “self” and “non-self.” Both the innate and adaptive arms of the immune system are endowed with such discriminatory ability, and thus can respond specifically to for- eign insults alone. However, they use different molecular and cellular mechanisms (Fig. 1).
Innate immunity
Innate immunity refers to a set of immediate responses to in- fections with pathogens [5]. The two major players are neutro- phils and macrophages. They not only directly remove patho- gens by phagocytosis; they also respond to pathogen-derived pathogen-associated molecular patterns (PAMPs) (e.g., lipo- polysaccharide and bacterial flagellin) and host cell-derived danger-associated molecular patterns (DAMPs) (e.g., chroma- tin-associated protein high-mobility group box 1, DNA, and
Fig. 1. Innate immunity versus adaptive immunity. NK, natural killer; ILC, innate lymphoid cell; NKT, natural killer T; DC, den- dritic cell.
hyaluronan fragment). When neutrophils and macrophages encounter these PAMPs or DAMPs, their cell-surface toll-like receptors (TLRs) or intracellular nucleotide-binding oligomer- ization domain (NOD)-like receptors (NLRs) bind to these molecules. These binding events induce the neutrophils and macrophages to secrete various chemokines (e.g., chemokine [C-C motif] ligand 2 [CCL2]) and cytokines (e.g., tumor ne- crosis factor α [TNFα] and interleukin 6 [IL-6]) that mediate the recruitment and activation of other immune cells. These cells in turn initiate secondary cascades of immune responses, including adaptive immune responses. The cytokines pro- duced by neutrophils and macrophages can also induce the apoptosis of infected cells. Hence, innate immune responses are not specific for particular invading pathogens. They are also immediate and short-lived.
Adaptive immunity
In adaptive immunity, pathogens are engulfed by antigen-pre- senting cells (APCs) and their antigens are digested. The re- sulting pathogen-derived peptides bind to major histocompat- ibility complex (MHC) molecules within the APCs. The pep- tide/MHC complexes are then presented on the APC surface, where they interact with the T cell receptor (TCR) on T cells.
There are two types of MHCs, namely, MHC I and II, and their roles in adaptive immunity differ markedly. MHC I is ex- pressed ubiquitously on all cell types, whereas MHC II expres- sion is limited to specific APCs, namely, macrophages, den- dritic cells (DCs), and B cells. Moreover, antigen/MHC I com- plexes are only recognized by the TCRs on CD8 T cells. This allows CD8 T cells to identify the pathogen-infected cells and kill them directly by cytotoxic mechanisms. By contrast, anti- gen/MHC II complexes only interact with the TCRs on CD4 helper T cells. These interactions activate the CD4 T cells and induce their elaboration of cytokines, which shape the activa- tion and functions of other immune cells. Another function of CD4 T cells is that they bind to B cells and thereby help them make antibodies. Thus, B cells take up pathogen antigens via their B cell receptor (BCR), which is a specific surface immu- noglobulin. The antigen is then processed and presented as an antigen/MHC II complex. The binding of the TCR to this complex causes the B cells to proliferate, mature, and produce antibodies against the pathogen-derived antigen. Since all T cells and B cells are clonal (i.e., TCRs and BCRs only recognize a single specific antigen peptide) and the MHCs on APCs can only bind peptides with a specific pattern of amino acids, the
adaptive immune system is highly specific for the pathogen.
This feature sets it apart from innate immunity, which is highly non-specific. Another extremely important difference between innate and adaptive immunity is that adaptive immunity has memory. This is the hallmark of this arm of the immune sys- tem. Memory arises as follows: when the host is infected with a pathogen for the first time, pathogen-specific clonal CD4 and CD8 T and B cells expand and help to clear the pathogen.
Thereafter, the numbers of these cells drop, leaving only a small number of memory T and B cells to patrol the body of the host.
When the same pathogen infects the host again, these memory T and B cells expand rapidly and differentiate into effector cells that eradicate the pathogens and infected cells anew. This sec- ondary response is much faster and more effective than the primary response. Thus, the adaptive immune system is not only highly specific for single antigens of the pathogen; it re- members the first insult and, when exposed to it again, elimi- nates it with great efficiency.
Innate immunity, adaptive immunity, and insulin resistance
Adipose tissues contain many different immune cell types from both the innate and adaptive arms of the immune system.
The innate immune cells include adipose tissue macrophages (ATMs), neutrophils, and mast cells, while the adaptive im- mune cells include T and B cells and DCs. Most studies on obesity-induced inflammation have focused on aspects of the innate immune system in adipose tissue. Specifically, they ex- amined the role of inflammatory mediators, including pro- and anti-inflammatory cytokines, in the development of obesi- ty-induced inflammation and insulin resistance [4]. ATMs play a central role in the production of these inflammatory mediators [6]. In the lean condition, ATMs are the most abun- dant cells in adipose tissue, and obesity increases these num- bers further. Moreover, obesity alters the ATM phenotype from the anti-inflammatory M2 phenotype to the proinflam- matory M1 phenotype [7]. This change causes the ATMs to express many proinflammatory cytokines, including TNFα and IL-1β [8]. Strong evidence for this obesity-induced change in ATM phenotype has been obtained by studies using several myeloid cell-specific mouse models that are generated using LysM-Cre mice, including myeloid cell-specific Ikkb knockout mice [9].
Nevertheless, other studies suggest that adaptive immunity also plays a role in the development of obesity-induced inflam-
mation: modulating the numbers of Th2 CD4 T cells, CD8 T cells, regulatory T cells (Tregs), B cells, and DCs in mice alters their development of obesity-induced inflammation and insu- lin resistance [4]. Furthermore, recent studies show that delet- ing MHC II in adipocytes or myeloid cells (thereby crippling the adaptive immune system) improves obesity-induced in- flammation and insulin resistance [10,11]. However, it is not yet clear which cell types play the more critical role in the anti- gen presentation that drives adaptive immune responses in obesity. Moreover, it is not clear what, if any, the antigens are.
In any case, the latter studies suggest that obesity-induced in- flammation may actually be an antibody-mediated chronic immune disease, and possibly even an autoimmune disease.
However, it should be strongly emphasized that this notion re- mains speculative and further studies are needed to validate it.
Moreover, it should be noted that, in many cases, these modu- lations of the expression of a specific protein in mice (includ- ing knocking out MHC II) also change the body and/or fat weights of the mice. Since these changes can secondarily mod- ulate insulin resistance in obesity, these results should be inter- preted with caution.
Immune cells that participate in both innate and adaptive immunity
In general, immune cells are exclusively categorized as being either innate or adaptive immune cells. However, many cells also play roles in both arms of the immune system. These cells include natural killer (NK) cells, invariant natural killer T (iNKT) cells, and innate lymphoid cells (ILCs) (Fig. 1). While all of these cells produce many different cytokines that regulate innate immunity, these cytokines also help to shape the devel- opment of adaptive immunity. Moreover, recent studies show that NK cells have memory, namely, they can recognize a spe- cific antigen that they have seen before and respond much more vigorously when encountering it than they did when they first saw it [12,13]. iNKT cells are a subset of CD3 T cells.
They recognize lipid antigens presented by CD1d, which is a non-polymorphic MHC 1 molecule. While the lipid antigens that are recognized by iNKT cells have not been identified, the features of iNKT cells suggest that they are likely to have mem- ory as well [14]. ILCs are newly identified cell types that closely resemble NK cells. Recent studies indicate that all three cell types in adipose tissues may play important roles in the devel- opment of obesity-induced inflammation and insulin resis- tance. Since there are many excellent reviews on the contribu-
tions of classical innate and adaptive immune cells to obesity- induced inflammation and insulin resistance, we will focus on NK cells, iNKT cells, and ILCs in this review.
NATURAL KILLER CELLS
NK cells are a very specialized subset of lymphocytes that are commonly identified as CD3– NK1.1+ [12,13]. Other common markers for NK cells are NKp46 (natural cytotoxicity trigger- ing receptor 1 [NCR1] or CD335) and CD49b (DX5). NK cells were first identified in 1975 due to their ability to kill tumor cells without previous priming [15]. Thus, the main function of NK cells is to kill tumor cells and infected cells via their cy- tolytic activity: this activity is mainly mediated by the perforin and granzymes that are released in granules by the NK cells [12,13]. However, another major function of NK cells is to pro- duce large quantities of various inflammatory mediators. These immune modulators include both pro- and anti-inflammatory cytokines (e.g., TNFα, interferon γ [IFNγ], and IL-10), growth factors for immune cells (e.g., granulocyte-macrophage colo- ny-stimulating factor and granulocyte-colony stimulating fac- tor), and chemokines (CCL2, RANTES [Regulated on Activa- tion, Normal T Cell Expressed and Secreted], and IL-8). Al- though these mediators can regulate cytotoxicity, they are also important for promoting the migration and proliferation, de- velopment, maturation, activation, and polarization of other immune cells. For example, NK cells secrete IFNγ, which pro- motes DC activation and the polarization of CD4 T cells and macrophages toward Th1 and M1 phenotypes, respectively.
NK cell development and maturation
In the adult mouse, NK cells develop in the bone marrow.
Thus, hematopoietic stem cells in the bone marrow differenti- ate into common lymphoid progenitor (CLP) cells, which in turn differentiate into T and B cells or NK cell precursors (NKPs). The NKPs then become immature NK (iNK) cells and eventually CD11b+ CD27+ mature NK (mNK) cells. The latter differentiation processes are regulated by E4BP4/NFIL3 (nu- clear factor interleukin-3-regulated protein) and Eomes, re- spectively. E4BP4/NFIL3 is a particularly critical transcription factor in NK cell development. For this reason, E4BP4/NFIL3 knockout mice are often used to study the roles of NK cells in various settings [16]. The CD11b+ CD27+ mNK cells egress from the bone marrow into the circulation and then migrate to local tissues. There, the NK cells mature further and become
activated into CD11b+ CD27– NK cells. Moreover, under in- flammatory conditions, NK cells can proliferate in local tis- sues.
The local maturation, activation, and proliferation of NK cells are regulated by IL-12, IL-15, and IL-18, which are de- rived from DCs or macrophages [12,13]. The role of IL-15 in NK cell activation and proliferation is particularly well under- stood [17]. IL-15 complexes with IL-15 receptor α subunit (IL- 15Rα) on DCs or macrophages, and these complexes are trans-presented to the IL-15 receptor components on NK cells.
The IL-15 receptor is composed of several subunits, including IL-2Rγ, which is also part of many other cytokine receptor complexes, including the IL-2 receptor.
NK cell receptors
NK cells differ from the more common T and B lymphocytes in that they do not have antigen-specific receptors (TCR and BCR, respectively). Instead, they have inhibitory and activat- ing receptors that recognize “self” and “non-self,” respectively [12,13]. The inhibitory receptors recognize the native MHC class I proteins that are expressed on all normal cells. Cells ex- pressing native MHC I (that does not present antigen) are rec- ognized as “self,” and NK cells take no action. However, if cells do not express native MHC I, they are seen by the NK cells as foreign and are killed. By contrast, the activating receptors rec- ognize “non-self” molecules on native cells. Thus, even if a cell expresses native MHC I, the presence of non-self molecules (such as viral proteins) will induce the NK cell to kill it. NK cells also express TLRs, which themselves recognize various bacterial and viral products. In addition, NK cells express CD16, which recognizes the Fc domain of antibodies and therefore antibody-coated cells. The engagement of the TLRs or CD16 with their ligands causes the NK cells to kill the li- gand-bearing target cell.
Recent studies in hypersensitivity and viral infection have identified new features of NK cells. These studies suggest that NK cells have “memory,” which is considered to be a central feature of adaptive immunity [13]. Thus, when mice were chal- lenged with an immunological insult and subsets of NK cells from these mice were adoptively transferred into naïve mice, these NK cells had characteristics of memory: when the recipi- ent was challenged with the same insult, the NK cells expanded rapidly and their immune response was greater than that seen in the donor mice during the first exposure to the insult. In ad- dition, the transferred NK cells homed to the tissue from
which they had been harvested in the recipient mice. Further- more, it has been shown that the activating Ly49H NK cell re- ceptor plays an important role in the memory of NK cells in cytomegalovirus infection.
NK cells in insulin resistance and T2DM
NK cells play an important role in infection because they kill infected cells [12]. Moreover, NK cells can kill cancer cells in humans [18]. This ability is the subject of intense research in- terest at present: there are currently more than 200 clinical tri- als on the clinicaltrial.gov site that are investigating NK cell immunotherapy in cancer.
Of particular interest in this review, NK cells also participate in the development of insulin resistance and T2DM, presum- ably because of their capacity to produce large amounts of cy- tokines such as IFNγ. However, this role of NK cells has only recently started to attract attention from researchers.
Association of NK cells with human obesity and T2DM Several studies have found that human obesity and/or T2DM associate with changes in the number and activity of NK cells.
However, these studies have discrepant results. Most studies found that obese or T2DM patients exhibit higher numbers and/or activation of NK cells in the circulation or adipose tis- sue than control subjects [19-29]. However, a few other studies observed decreases or no changes [30-32]. This discrepancy may relate to the fact that, in the latter studies, NK cell fre- quencies were normalized by the number of total leukocytes (CD45+) or lymphocytes. This variable may be misleading be- cause obesity dramatically increases total leukocyte and neu- trophil numbers in the circulation and the macrophage num- bers in adipose tissues. Thus, if NK cell numbers rise on obesi- ty, this would not be observed readily if these numbers are ex- pressed as a percentage of total leukocyte numbers. This is supported by studies on children with obesity-related hepatos- teatosis: while these children had higher absolute NK cell numbers than the control children, this difference disappeared when these numbers were converted to percentages of total leukocytes [28,33]. Furthermore, in most of the studies that showed obesity increases NK cell counts in the circulation or adipose tissue, absolute NK cell counts were used [19-28]. In- terestingly, when bariatric surgery or calorie restriction results in weight loss, the absolute circulating NK cell numbers also drop [23,33,34].
Other evidence showing that NK cells are altered by obesity
in humans includes the finding that circulating NK cells from obese and unhealthy subjects have more DNA methylation than the NK cells from lean and healthy subjects: this suggests that transcription of NK cells in obese and T2DM patients are differently regulated [24]. Furthermore, homozygotes for NK cell immunoglobulin-like receptor (KIR) haplotype A have a greater risk of T2DM (odds ratio, 7.97) [35]. Since KIRs are mainly inhibitory receptors that bind to MHC I, this observa- tion suggests that the cytotoxic activity of NK cells may associ- ate with risk of T2DM. Interestingly, the cytotoxic activity of the circulating NK cells is decreased in obese humans [27,30].
The role of NK cells in the development of obesity-induced insulin resistance in rodent models
Obese mice also exhibit higher NK cell numbers in the adipose tissue than lean mice [20,36-41], unless the NK cell numbers are presented as a percentage of leukocytes or stromal vascular cells: in this case, obesity associates with decreased frequencies of adipose NK cells [42,43]. Thus, the human and animal stud- ies together strongly suggest that obesity elevates NK cell num- bers. This consistent association led to speculation that NK cells may participate in the development of obesity-induced insulin resistance.
Our recent animal model study strongly supports this no- tion [39]. One of the approaches that we used to test this was to deplete NK cells by injecting a specific antibody against a NK cell-specific surface marker, namely, NK1.1. In the classical im- munology field, this approach is often used to determine the in vivo roles of NK cells. We found that depleting NK cells with an anti-NK1.1 (PK136) antibody improved insulin resistance under high fat diet (HFD) conditions (60% HFD). The Polic group also observed this effect of PK136-mediated NK cell de- pletion on insulin resistance [41]. In lean conditions, this de- pletion did not change the metabolic phenotypes [39,41]. Im- portantly, the antibody-mediated NK cell depletions did not alter body weight or obesity. However, anti-NK1.1 antibodies also recognize another immune cell type, namely, iNKT cells.
For this reason, the Polic group used a lower dose of anti- NK1.1 antibody: this depletes NK cells without markedly de- pleting iNKT cells [41]. In our study, we addressed this issue by examining whether knocking out iNKT cells affected meta- bolic phenotypes. Compared with control mice, iNKT cell knockout mice did not differ in terms of body and fat weights, fasting glucose and insulin levels, or glucose or insulin toler- ance test (GTT and ITT, respectively) results under both obese
and lean conditions [39]. Thus, iNKT cell deletion did not af- fect metabolic phenotypes in our lab, meaning that the im- proved metabolic phenotypes seen in wild-type animals after anti-NK1.1 injection were due to NK cell depletion rather than iNKT cell depletion (see the following section on iNKT cells as well). Nevertheless, to validate these results further, we em- ployed another NK cell-specific antibody to deplete NK cells, namely, the anti-asialo ganglio-N-tetraosylceramide (asialo- GM1) antibody that recognizes NK cells, but not iNKT cells [39]. The results were identical to those of the PK136 antibody experiments: the NK cell depletion improved HFD-induced insulin resistance. In addition, we assessed the effects of genet- ic NK cell deficiency on HFD-induced insulin resistance using E4bp4/Nfil3 knockout mice [39]. Homozygous E4bp4/Nfil3 knockout mice, which had ~5% of the NK cells seen in wild- type mice, showed improved insulin resistance under the HFD condition alone. However, their body and fat weights were also significantly decreased in HFD conditions, which made it dif- ficult to interpret the insulin resistance results. We therefore examined heterozygous E4bp4/Nfil3 knockout mice, which have only 50% of the NK cell numbers seen in normal chow- fed and HFD-fed wild-type mice and do not exhibit any differ- ences from wild-type mice in terms of fat and body weights.
When we examined the metabolic status of these heterozygous E4bp4/Nfil3 knockout mice on a HFD, they exhibited im- proved insulin resistance [39]. Notably, this effect was only ob- served after 9 weeks on a HFD. This suggests that NK cells par- ticipate in the regulation of obesity-induced insulin resistance at the late stage of obesity only.
Our results are further validated by the study of O’Rourke et al. [44]. They used mice that specifically express diphtheria toxin receptor (DTR) in NK cells. Hence, injections of low doses of diphtheria toxin specifically kill the NK cells in these mice. When these mice were fed a HFD and then injected with diphtheria toxin, they exhibited a mild improvement in ITT.
However, changes in fasting glucose and insulin levels and GTT results were not observed [44]. It is not clear why only mild improvements in obesity-induced insulin resistance were observed: much stronger effects were observed when NK cell numbers were reduced using neutralizing antibodies or E4bp4/
Nfil3 haplodeficiency [39,41]. It may be due, at least in part, to the side-effects of diphtheria toxin, which are well-known to include loss of body weight.
We also used the opposite approach to assess the role of NK cells in insulin resistance, namely, we expanded NK cells in
vivo. In the classical immunology field, the most commonly used NK cell-expanding technique is to inject IL-15. Alterna- tively, because cells are presented with IL-15 after it complexes with an IL-15Rα, NK cells can be expanded by injecting ani- mals with a pre-assembled IL-15/IL-15Rα complex. However, the latter approach is limited by the fact that long-term injec- tions with IL-15/IL-15Rα complexes cause NK cell exhaustion, resulting in the expansion of non-functional NK cells [45].
Hence, we injected our mice with a low dose of IL-15 alone.
This expands NK cell numbers by 2- to 3-fold, which is equiva- lent to the NK cell numbers seen in HFD conditions [39]. We found that such NK cell expansion worsened HFD-induced insulin resistance. We also found that reconstituting NK cell- deficient E4bp4/Nfil3 homozygous knockout mice with wild- type NK cells from HFD-fed mice exacerbated their obesity- induced insulin resistance [39].
In summary, our results [39], together with those of the Polic group and O’Rourke et al. [41,44], strongly indicate that NK cells play an important role in the development of obesity-in- duced insulin resistance, especially at the late stage of obesity.
Regulation of epididymal NK cell numbers and activation by obesity
Our study and those of the Polic group and O’Rourke et al.
[39,41,44] also examined the mechanism by which NK cells may promote the development of obesity-induced inflamma- tion and insulin resistance. First, we all showed repeatedly that, although multiple tissues were examined, obesity only in- creased the activation of NK cells in the epididymal fat. Indeed, changes in NK cell activation were not even observed in the subcutaneous fat [39,41,44]. The Polic group found that obesi- ty altered the cytokine production of NK cells: this change was only observed in the epididymal fat. Specifically, they found that, 2 to 4 weeks after starting HFD feeding, the epididymal NK cells produced about 2-fold more IFNγ than the equivalent cells from mice fed with normal chow [41]. IFNγ is the classi- cal signature cytokine of NK cells. Similarly, we found that epi- didymal NK cells also express higher levels of IFNγ at a later stage of obesity, namely, 12 weeks of HFD feeding. However, this increase was only due to a relatively small rise in the num- bers of these cells (~4%): the production of IFNγ by the indi- vidual IFNγ-expressing NK cells did not change [39]. By con- trast, we found that, at the same later stage of obesity, there was a dramatic increase in both the numbers of TNFα-expressing epididymal NK cells (~60% of all epididymal NK cells from
HFD-fed mice expressed TNFα versus 10% of the cells from control animals) and the production of TNFα by individual epididymal NK cells (6-fold higher relative to control NK cell production). A small increase in IL-6-producing NK cells (~4%) was also observed at the later stage of obesity. However, like IFNγ, the HFD did not alter the amount of IL-6 that was produced by the individual IL-6-producing cells [39]. Hence, our study together with that of the Polic group suggests that, while early stages of obesity associate with increased NK cell production of the classical signature cytokine of NK cells (i.e., IFNγ), TNFα becomes the major NK cell cytokine when obe- sity becomes more severe [39,41].
Second, the studies by all three groups consistently showed that obesity only increased the number of NK cells in the epi- didymal fat. Again, changes in NK cell numbers were not even observed in the subcutaneous fat [39,41,44]. Local NK cell numbers are regulated by recruitment of NK cells from the cir- culation and/or by local proliferation of tissue resident NK cells. We and the Polic group have evidence that suggests that obesity regulates the NK cell numbers in the epididymal fat by inducing both recruitment and local proliferation. Thus, our study showed that obesity increased the ATM expression of genes that encode NK cell-attracting chemokines (e.g., Ccl3, Ccl4, and Cxcl10) [39]. Furthermore, when we intravenously transferred splenic NK cells from obese wild-type mice into HFD-fed E4bp4/Nfil3–/– mice, the transferred NK cells were found in the epididymal fat. This shows that NK cells can mi- grate to the epididymal fat. These two lines of evidence togeth- er suggest that obesity increases the epididymal recruitment of NK cells from the circulation. On the other hand, the Polic group showed that obesity increased the frequency of Ki67+ NK cells and EdU (5-ethynyl-2’-deoxyuridine) incorporation in the epididymal fat [41]. Since both are markers of prolifera- tion, this suggests that there is local NK cell proliferation in the epididymal fat under HFD conditions. This is further support- ed by our finding that obesity elevates the epididymal ATM expression of the Il15 cytokine, which, as described above, plays an important role in NK cell development, proliferation and activation. We also observed that the increased expression of Il15 in obesity was only observed in the epididymal fat: it was not observed in any other tissues, including the subcuta- neous fat [39]. These results together suggest that obesity in- creases the expression of IL-15 in epididymal ATMs only, and that this in turn induces the resident NK cells in the epididy- mal fat to proliferate. It may also activate these cells. Thus, obe-
sity may activate ATMs, which in turn promote the epididymal recruitment and local proliferation of NK cells.
In addition, the Polic group found that the obesity-induced activation of epididymal NK cells may involve an as-yet-un- known ligand for NCR1 on adipocytes [41]. NCR1 is a recep- tor on NK cells: when it is ligated, it potently activates NK cells.
The Polic group showed that obesity upregulates the expres- sion of the unknown ligand on adipocytes and that this induc- es epididymal NK cells to produce IFNγ. They also showed that this chain of events promotes the development of insulin resistance, as follows. First, while HFD-fed Ifng homozygous knockout mice exhibit decreased glucose intolerance com- pared with wild-type controls, their glucose tolerance is im- paired and their insulin resistance rises when wild-type, but not NCR1-deficient, NK cells are adoptively transferred. Sec- ond, obesity-induced insulin resistance improves when HFD- fed mice are injected with an NCR1-immunoglobulin fusion protein that blocks NCR1 ligand binding. These observations suggest that, along with ATMs, epididymal adipocytes may also play a role in the activation of NK cells in obesity [41].
Thus, the fact that obesity only increases the numbers and cytokine production of NK cells in the epididymal fat suggests that epididymal NK cells may play a specific role in the devel- opment of obesity-induced inflammation and insulin resis- tance.
Regulation of epididymal adipose tissue and ATM inflam- mation by NK cells
The two main functions of NK cells are cytotoxicity and the regulation of other immune cells. However, the cytotoxic func- tion of NK cells does not appear to mediate their regulation of obesity-induced inflammation because obesity does not alter NK cell cytotoxicity in mice [41]. This is in line with the obser- vation that, in obese humans, the cytotoxic activity of the cir- culating NK cells is decreased [27,30]. Moreover, while the perforin in the cytotoxic pathway does participate in obesity- induced insulin resistance, CD8 T cells, not NK cells, appear to be its main source [46]. These observations suggest that NK cells regulate obesity-induced inflammation by regulating oth- er cells via cytokine/chemokine secretion.
This notion is supported by our study: we showed that mod- ulating NK cell numbers in obesity shapes the numbers and/or activation of ATMs in a predictable manner [39], as follows.
First, we showed that modulating NK cells alters the ATM in- flammatory phenotype (M1 polarization), as indicated by
CD11c expression analyses. These changes are seen in the epi- didymal fat only. Thus, antibody-mediated NK cell depletion and E4bp4/Nfil3 deletion decreased epididymal CD11c+ ATM numbers while IL-15-mediated expansion of NK cells and NK cell reconstitution in E4bp4/Nfil3 homozygous knockout mice increased them [39].
Second, we showed that, when NK cells were depleted by GM1 antibody injections, the sorted ATMs exhibited down- regulated expression of proinflammatory genes, including Tnf, Il1b, and Itgax (which encodes CD11c), and upregulated ex- pression of Il10 (an anti-inflammatory gene) and Arg1 (an M2 marker gene) [39]. Moreover, when the neutralizing GM1 an- tibody was substituted by the control immunoglobulin G and the NK cell numbers were allowed to recover, this pro/anti-in- flammatory pattern in the ATMs was reversed: proinflamma- tory gene expression rose while anti-inflammatory and M2 marker gene expression was downregulated. Modulating NK cell numbers also shaped the inflammatory gene expression in the total epididymal fat: loss of NK cells decreased epididymal Tnf and Il6 gene expression while NK cell expansion increased it. Importantly, these changes in inflammatory mediator gene expression were not observed in any other tissue, including the subcutaneous fat. Notably, we found that modulating NK cell numbers in obesity did not alter the Ifng gene expression in any tissue, including the epididymal fat. Indeed, even a HFD did not upregulate Ifng gene expression in any tissue. This sup- ports the notion proposed above that NK cell-derived TNFα may be the primary proinflammatory mediator that regulates obesity-induced inflammation and insulin resistance [39].
Third, we found that modulating NK cells not only alters ep- ididymal ATM numbers; it also affected the epididymal fat ex- pression of Ccl2, which encodes a chemokine that attracts monocytes. Again, this effect was not observed in any other tissue [39]. By contrast, modulating NK cell numbers did not affect the expression of another macrophage chemokine gene, Cx3cl1, in any of the tissues. Hence, our study suggests that NK cells may specifically regulate epididymal ATM numbers by controlling Ccl2 gene expression. Interestingly, modulating NK cell numbers did not change the macrophage numbers in other tissues, including the subcutaneous fat. It also did not affect the numbers of other immune cell types in any of the tissues, in- cluding the epididymal fat. Thus, the effect of NK cells seems to be specific for macrophage numbers in epididymal fat only.
Our findings are partly supported by the study by the Polic group: they too found that antibody-mediated NK cell deple-
tion in obesity influences ATM polarization (CD11c expres- sion) [41]. However, they did not detect changes in the overall ATM numbers. By contrast, O’Rourke et al. [44] showed that, when NK cells in HFD-fed NCR1-DTR mice were depleted by injecting diphtheria toxin, the total epididymal ATM numbers decreased without changing the CD11c+ (M1) or CD206+ (M2) ATM numbers. Interestingly, they found that NK cell depletion decreased the numbers of double-negative (CD11c– CD206–) ATMs [44]. Although it is not clear why our study [39] and those of the Polic group and O’Rourke et al. [41,44] showed different results, it may reflect differences in mouse models and the durations for the HFD treatments that were employed in these studies.
Model for the NK cell-mediated regulation of obesity-in- duced inflammation and insulin resistance
Our study and those of the Polic group and O’Rourke et al.
[39,41,44] suggest that NK cells regulate obesity-induced in- flammation and insulin resistance via the following mecha- nism. As obesity increases, ATMs become activated and pro- duce chemokines that recruit NK cells from the circulation.
This increases the NK cell numbers in epididymal fat (Fig. 2A).
In addition, the obese ATMs produce IL-15, which promotes NK cell proliferation and activation. Adipocytes also produce an as-yet-unknown ligand for NCR1 that directly activates the NK cells in epididymal fat (Fig. 2A). As the activated NK cell numbers in the epididymal fat rise, these cells start to cross- regulate the numbers and activation of ATMs, as follows. First, the NK cells mediate the epididymal production of CCL2, which recruits circulating monocytes into the epididymal fat (Fig. 2B). This increases the ATM numbers in the epididymal fat. Second, the epididymal NK cells secrete proinflammatory cytokines, notably TNFα, but also IFNγ, which lead to the full activation of ATMs (Fig. 2B). This vicious cycle of escalating
Fig. 2. Model for the natural killer (NK) cell-mediated regulation of obesity-induced inflammation and insulin resistance. (A) As obesity increases, adipose tissue macrophages (ATMs) become activated and produce chemokines that recruit NK cells from the circulation. This increases the NK cell numbers in epididymal fat. In addition, the obese ATMs produce interleukin 15 (IL- 15) and adipocytes produce an as-yet-unknown ligand for natural cytotoxicity triggering receptor 1 (NCR1), which activates the NK cells in epididymal fat. (B) Then, the activated NK cells induce increases in ATM numbers and activation. (C) This cross-activation of ATMs and NK cells induces adipose tissue inflammation in obesity, and eventually adipocyte insulin resis- tance. Epididymal fat also produces mediators that can regulate insulin resistance in liver and muscle, which eventually leads to the development of systemic insulin resistance. See the text for more details. CCL2, chemokine (C-C motif) ligand 2; TNFα, tu- mor necrosis factor α.
A B C
inflammatory stimuli and responses between ATMs and NK cells induces adipose tissue inflammation in obesity, and even- tually adipocyte insulin resistance (Fig. 2C). Notably, while our study showed that modulating NK cell numbers does not affect liver and muscle inflammation [39], the study by the Polic group and our study found that modulating NK cell numbers does affect the insulin sensitivity of these tissues [39,41].
Hence, epididymal fat produces mediators that can regulate insulin resistance in liver and muscle, which eventually leads to the development of systemic insulin resistance.
Our study and those of the Polic group and O’Rourke et al.
[39,41,44] were performed relatively recently, and there are still some unresolved discrepancies in the results. Thus, several questions remain. These include the following: how obesity regulates NK cell activation; how epididymal NK cells regulate the development of obesity-induced inflammation; what are the NK cell-derived inflammatory mediators that induce adi- pocyte insulin resistance; and what are the epididymal fat me- diators that induce liver and muscle insulin resistance? The implications of these preclinical studies should also be tested in clinical studies in the future.
INVARIANT NATURAL KILLER T CELLS
iNKT cells are a specialized subset of T cells. Like conventional T cells, they express TCRs. However, unlike conventional T cells, which have diverse TCR sequences, iNKT cells have TCRs with an invariant α chain (Va4-Ja18 in mice and Va24- Ja18 in humans). Moreover, whereas conventional T cells rec- ognize peptide antigens that are presented by MHC I or II molecules, iNKT cells recognize lipid antigens presented by CD1d [47]. α-Galactosylceramide (α-GalCer) is the prototypi- cal lipid antigen that is recognized by iNKT cells. However, they also recognize pathogen-associated glycolipids and self- glycolipid antigens. Since iNKT cell responses are dependent on CD1d, Cd1d or Jα18 (TCR α chain Ja18) knockout mice, which lack iNKT cells, are often used to determine the in vivo role of iNKT cells [48].
Conventional T cell development in the thymus starts with double-negative (CD4– CD8–) thymocytes. These cells then ex- press clonal TCRs that are generated by random TCR gene re- arrangement and become double-positive (CD4+ CD8+) thy- mocytes. The TCRs of these cells subsequently encounter MHC I or II molecules on thymus epithelial cells. If they rec- ognize the MHC molecules with at least a weak affinity, they
are positively selected. However, if the T cells recognize self- peptides or MHC molecules with an affinity that is too high, they are negatively selected and die. This process results in sin- gle-positive conventional CD4+ or CD8+ T cells. With regard to iNKT cells, immature iNKT precursors arise from double- positive thymocytes by a stochastic process where double-pos- itive thymocytes engage with an as-yet-unknown lipid antigen that is presented by CD1d on other double-positive thymo- cytes. In other words, the signal for iNKT development is pre- sented on other double-positive thymocytes rather than on thymus epithelial cells [49]. Thereafter, the immature iNKT cells differentiate fully into mature iNKT cells in the thymus and periphery. The promyelocytic leukemia zinc finger protein (PLZF) is thought to be the master regulator that controls iNKT cell development, including the final stage that produces the various effector phenotypes of iNKT cells.
Fully developed iNKT cells can produce various pro- and anti-inflammatory cytokines. As a result, iNKT cells can be categorized like conventional CD4 T cells as Th1-like, Th2- like, and Th17-like iNKT cells. These cells produce a Th1 cyto- kine (IFNγ), Th2 cytokines (IL-4 and IL-13), and IL-17 and IL- 22, respectively. The transcription factors that drive CD4 T cell polarization also participate in iNKT cell differentiation; thus, T-bet (T-box transcription factor), GATA3 (GATA binding protein 3), and RORγt (retinoid-related orphan receptor gam- ma) drive the differentiation of Th1-like, Th2-like, and Th17- like iNKT cells, respectively. However, it should be noted that the same iNKT cell can produce both Th1 and Th2 cytokines iNKT cells in insulin resistance and T2DM
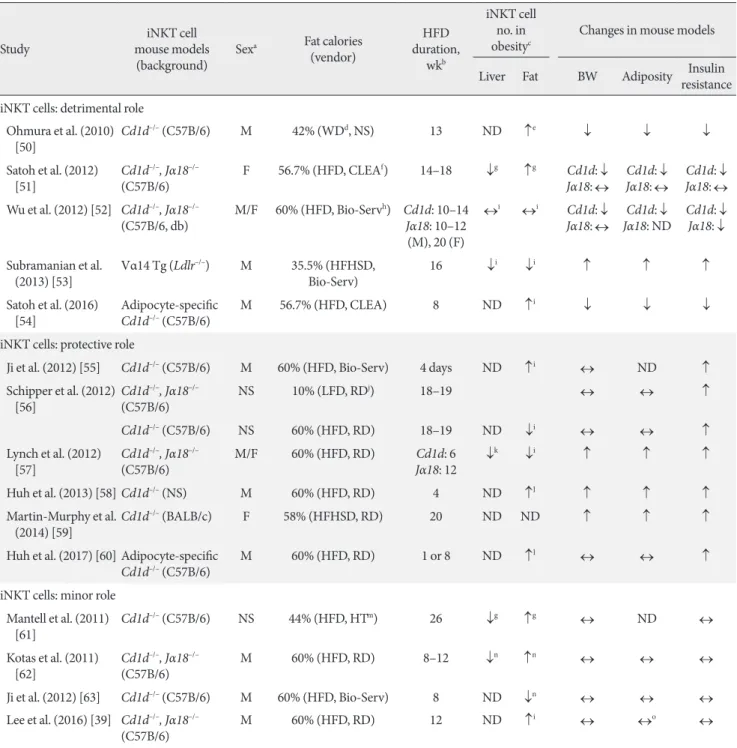
iNKT cells play both pro- and anti-inflammatory roles in bac- terial and viral infections, type 1 diabetes, and multiple sclero- sis. There is also speculation that, because iNKT cells recognize lipid antigens, they may also participate in the development of obesity-induced inflammation and insulin resistance. Many groups, including ours, have explored this possibility. Many of these studies employed the total body Cd1d–/– and Jα18–/–
iNKT knockout lines (Table 1) [39,50-63]. Most of the studies show that obesity decreases the numbers of iNKT cells in the liver. As a result, it has been suggested that loss of hepatic iNKT cells may play a role in the development of hepatosteato- sis. However, the studies differ markedly in terms of the effect of obesity on adipose iNKT cell numbers: some show that obe- sity upregulates adipose iNKT cell numbers, other show no ef- fect, and still others show that obesity downregulates adipose
Table 1. Basic features of the studies that examine the role of iNKT cells in obesity-induced insulin resistance
Study iNKT cell
mouse models
(background) Sexa Fat calories (vendor)
duration, HFD wkb
iNKT cell no. in
obesityc Changes in mouse models Liver Fat BW Adiposity Insulin resistance iNKT cells: detrimental role
Ohmura et al. (2010)
[50] Cd1d–/– (C57B/6) M 42% (WDd, NS) 13 ND ↑e ↓ ↓ ↓
Satoh et al. (2012)
[51] Cd1d–/–, Jα18–/–
(C57B/6) F 56.7% (HFD, CLEAf) 14–18 ↓g ↑g Cd1d: ↓
Jα18: ↔ Cd1d: ↓
Jα18: ↔ Cd1d: ↓ Jα18: ↔ Wu et al. (2012) [52] Cd1d–/–, Jα18–/–
(C57B/6, db) M/F 60% (HFD, Bio-Servh) Cd1d: 10–14 Jα18: 10–12 (M), 20 (F)
↔i ↔i Cd1d: ↓
Jα18: ↔ Cd1d: ↓
Jα18: ND Cd1d: ↓ Jα18: ↓ Subramanian et al.
(2013) [53] Vα14 Tg (Ldlr–/–) M 35.5% (HFHSD,
Bio-Serv) 16 ↓i ↓i ↑ ↑ ↑
Satoh et al. (2016)
[54] Adipocyte-specific
Cd1d–/– (C57B/6) M 56.7% (HFD, CLEA) 8 ND ↑i ↓ ↓ ↓
iNKT cells: protective role
Ji et al. (2012) [55] Cd1d–/– (C57B/6) M 60% (HFD, Bio-Serv) 4 days ND ↑i ↔ ND ↑ Schipper et al. (2012)
[56] Cd1d–/–, Jα18–/–
(C57B/6) NS 10% (LFD, RDj) 18–19 ↔ ↔ ↑
Cd1d–/– (C57B/6) NS 60% (HFD, RD) 18–19 ND ↓i ↔ ↔ ↑
Lynch et al. (2012)
[57] Cd1d–/–, Jα18–/–
(C57B/6) M/F 60% (HFD, RD) Cd1d: 6
Jα18: 12 ↓k ↓i ↑ ↑ ↑
Huh et al. (2013) [58] Cd1d–/– (NS) M 60% (HFD, RD) 4 ND ↑l ↑ ↑ ↑
Martin-Murphy et al.
(2014) [59] Cd1d–/– (BALB/c) F 58% (HFHSD, RD) 20 ND ND ↑ ↑ ↑
Huh et al. (2017) [60] Adipocyte-specific
Cd1d–/– (C57B/6) M 60% (HFD, RD) 1 or 8 ND ↑l ↔ ↔ ↑
iNKT cells: minor role Mantell et al. (2011)
[61] Cd1d–/– (C57B/6) NS 44% (HFD, HTm) 26 ↓g ↑g ↔ ND ↔
Kotas et al. (2011)
[62] Cd1d–/–, Jα18–/–
(C57B/6) M 60% (HFD, RD) 8–12 ↓n ↑n ↔ ↔ ↔
Ji et al. (2012) [63] Cd1d–/– (C57B/6) M 60% (HFD, Bio-Serv) 8 ND ↓n ↔ ↔ ↔
Lee et al. (2016) [39] Cd1d–/–, Jα18–/–
(C57B/6) M 60% (HFD, RD) 12 ND ↑i ↔ ↔o ↔
iNKT, invariant natural killer T; HFD, high fat diet; BW, body weight; WD, Western diet; NS, not stated in the literature; ND, not determined;
HFHSD, high-fat high-sucrose diet; LFD, low-fat diet; RD, Research Diet; HT, Harlan Teklad.
aThe sexes that were used to determine the metabolic phenotypes, bDuration of HFD treatment at the time the metabolic phenotypes were mea- sured, cIf the study expressed iNKT cell numbers in various ways, the variable “cell number/g of tissue” was shown in this table, dWD, vendor not described (HFD containing 21% fat and 0.15% cholesterol), eGene expression of Vα14Jα18, fCLEA, vendor is CLEA from Japan (HFD-32; 56%
kcal from fat; powdered tallow and safflower oil of high oleic type), g% of total cell or stromal vascular cell, hBio-Serv, vendor is Bio-Serv (HFD, 60% kcal from fat; lard, F3282; HFHSD, 35.5% kcal from fat and 36.6% kcal from carbohydrate, F4997), iCell number/g of tissue, jRD, vendor is Research Diets (HFD, 60% kcal from fat, D12492; LFD, 10% kcal, D12450B; HFHSD, 58% kcal from fat with sucrose, Surwit diet, D12331), k% of T cells, l% of lymphocytes, mHT, vendor is Harlan Teklad (44% kcal from fat; 19% lard; 1% corn oil), nAbsolute total cell number/tissue, oData not shown.
iNKT cell numbers (Table 1). These discrepancies may be due in part to the fact that some studies express iNKT cell numbers as a percentage of T or total lymphocytes while others, includ- ing ours, use absolute iNKT cell numbers normalized by tissue weight. However, the studies also differ markedly in terms of the effect of iNKT cell knockout on obesity-induced metabolic phenotypes. Some show that the deletion improves insulin re- sistance in obesity (insulin resistance: ↓ in Table 1), which sug- gests that iNKT cells promote the development of obesity-in- duced insulin resistance. However, many other studies show that iNKT cell deletion increases insulin resistance (insulin re- sistance: ↑ in Table 1), which suggests that iNKT cells protect against the development of obesity-induced insulin resistance.
The latter possibility is supported by the protective effect of in- jecting wild-type mice with α-GalCer, which activates iNKT cells. However, just as many studies (including ours) show that iNKT deletion has no effect on obesity-induced insulin resis- tance (insulin resistance: ↔ in Table 1). Thus, these total body iNKT knockout mouse studies have yielded extremely incon- clusive results.
Recent studies have focused on how adipose iNKT cells could be activated in obesity. Of particular interest is whether adipocytes present lipid antigens via CD1d. This possibility was suggested by the study by Huh et al. [58], which showed that fully differentiated adipocytes express high levels of CD1d.
As a result, two studies have examined the effect of specifically deleting CD1d in adipocytes on the metabolic phenotypes in obesity [54,60]. However, like the studies on the total body Cd1d–/– knockout mice, these two studies do not entirely agree with each other. Satoh et al. [54] found that the deletion re- duced the body and fat weights in obesity and improved obesi- ty-induced insulin resistance, whereas the more recent study by Huh et al. [60] showed that the deletion worsened obesity- induced insulin resistance without affecting the body and fat weights. Moreover, Satoh et al. [54] used heterozygous adipo- cyte-specific Cd1d+/– knockout mice as a control instead of true wild-type mice such as floxed Cd1d–/– knockout mice, whereas Huh et al. [60] used more traditional control mice (LysM- Cre–/– Cd1d flox/flox). It should be noted that both groups also published studies on total body Cd1d–/– knockout mice that showed the respective same results as their studies on adipo- cyte-specific CD1d knockout mice [51,58].
It would also be of interest to determine whether macro- phages can present lipid antigens via CD1d and thereby acti- vate iNKT cells in obesity. However, the effect of deleting
CD1d in macrophages has not yet been reported.
Interestingly, most of the studies on iNKT cell deletion showed that the insulin resistance phenotypes mirror the changes in body weights and obesity (fat weights). Thus, when iNKT cell deletion improved insulin resistance in obesity, the body weights and adiposity decreased. By contrast, when iNKT cell deletion worsened insulin resistance, the body and fat weights increased. Finally, if there were no changes in body weight or adiposity, then the insulin resistance phenotypes were also not changed.
These contradictory results have greatly puzzled researchers in the field, especially considering that (apart from the study by Subramanian et al. [53] that used iNKT cell transgenic mice) all of the studies used the same total body or adipocyte- specific knockout mouse lines on the same background. How- ever, when the details of these studies are reviewed closely, some subtle but significant differences can be observed. These differences include the sex of the animals that are used, the source and fat content of the diet, and the duration of the diet treatment (Table 1). In relation to these factors, none of the studies that showed that iNKT cells promote the development of insulin resistance used the HFD that is provided by Re- search Diet (Table 1). By contrast, almost all of the studies that showed iNKT cells are protective in obesity used the HFD from Research Diet (New Brunswick, NJ, USA) (Table 1). Dif- ferent vendors use different fat sources; for example, lard may be used instead of coconut oil. Since iNKT cells can have both pro- and anti-inflammatory functions, it is possible that the HFD from one vendor may contain lipid antigens that prefer- entially induce the proinflammatory functions of iNKT cells whereas the HFD from another vendor provokes the anti-in- flammatory functions of these cells. This difference may yield opposite metabolic phenotypes despite the fact that the same mouse lines are used. The duration of HFD treatment may also affect outcomes. This is exemplified by the two studies by the Qi group, who examined the metabolic phenotypes of Cd1d–/–
mice on a HFD at 4 days and 8 weeks. After 8 weeks of treat- ment, they found that the mice had no metabolic phenotype changes, including body and fat weights and insulin resistance [63]. By contrast, at 4 days, the same mouse strain showed worse obesity-induced insulin resistance, albeit no change in body weight [55]. These studies suggest that iNKT cells may play a protective role at the early phase of obesity and that they lose their protective capacity as obesity worsens. Another in- triguing, but as-yet-untested, hypothesis is that the gut micro-
biome may be responsible for the differences in the metabolic phenotypes of the iNKT cell knockout mice. Several studies show that the gut microbiome controls the development of obesity [64]. It is also well-accepted that the animal facilities in different institutes have quite different microbiomes. Further- more, a recent study showed that the gut microbiome is im- portant for iNKT cell development [65]. Hence, it will be inter- esting to see whether the different body and fat weights of the iNKT cell knockout mice at the different facilities may be caused by gut microbiome differences and whether these dif- ferences regulate the metabolic outcomes. All of these possibil- ities should be examined in the future.
Moreover, a recent study revealed a new role of iNKT cells that may help to explain why some of the studies on iNKT cell knockout mice showed that the loss of iNKT cells increased body and fat weights. This new role relates to the regulation of the browning of white fat [66]. The recent study showed that, when iNKT cells are activated by α-GalCer injections, the metabolic rate and whole body thermogenesis increases. This in turn decreases the body and fat weights. This phenomenon appears to be caused by iNKT cell-mediated induction of fi- broblast growth factor 21 (FGF21) expression by white adipo- cytes. This iNKT cell-FGF21 axis also induces the browning of white adipocytes in the subcutaneous fat. Hence, the study suggests that the body and fat weight increase that was ob- served in some of the studies on iNKT cell knockout mice may have been mediated by decreased browning of white adipo- cytes, which reduces the metabolic rate.
Regardless of the metabolic outcomes of iNKT cell deletion, all studies agree that iNKT cells regulate ATM inflammation, albeit in different directions. Thus, the studies that found that iNKT cells promote insulin resistance all suggest that iNKT cells promote the development of proinflammatory (M1) ATMs, in particular by producing IFNγ. By contrast, all of the studies that found that iNKT cells are protective showed that iNKT cells suppress ATM inflammation by producing IL-4. In relation to these observations, the Qi group showed that, al- though α-GalCer injections (which activate iNKT cells) im- proved HFD-induced insulin resistance in wild-type mice, such injections did not show any effects on insulin resistance in Il4–/– knockout mice [55,63]. In addition, iNKT cells have been shown to regulate the activation of adipose Tregs [67].
Tregs have been shown to influence the metabolic outcomes of obesity [68]. Thus, it is possible that this role of Tregs is also mediated by iNKT cells.
INNATE LYMPHOID CELLS
ILCs were described and classified relatively recently. ILCs are defined by (1) the lack of an antigen receptor that is rearranged by recombination activating genes (RAGs) (by contrast, ma- ture TCRs and BCRs arise from RAG-mediated recombina- tion); (2) the lack of myeloid cell-specific surface and lineage markers; and (3) the presence of the classical lymphocyte mor- phology [69]. Based on these criteria, ILCs include NK cells and lymphoid tissue inducer (LTi) cells, both of which were identified decades ago. All ILCs derive from CD127+ CLPs in the bone marrow. The CLPs first develop into ILC/NKPs, which then become pre-NKPs or Id2 (inhibitor of DNA bind- ing 2)+ LTi/ILC precursors. The pre-NK cells finally develop into NK cells while the LTi/ILC precursors develop into LTi cells or Id2+ PLZF+ ILC precursors that in turn become ILC1, 2, and 3 cells [70]. E4BP4/NFIL3 plays a critical role in the de- velopment of ILCs in the bone marrow. Hence, deletion of E4BP4/NFIL3 causes the loss of all ILCs [71,72].
ILC classification
In general, ILCs are classified according to the cytokines that they produce, analogous to the situation with T helper cells (Table 2). In T helper cells, the signature cytokine of Th1 T cells is IFNγ while Th2 T cells are defined by their expression of IL-4 and IL-13. The signature Th2 cytokines also include IL-5. Th17 cells are defined by their production of IL-17. Similarly, the group 1 ILCs are defined by production of the Th1 cytokine IFNγ, the group 2 ILCs are characterized by their production of the Th2 cytokines IL-5 and IL-13, and the group 3 ILCs are defined by their IL-17A expression. Hence, the group 1, 2, and 3 ILCs are the ILC equivalents of CD4 Th1, Th2, and Th17 cells, respectively. It should be noted that the ILC family tran- scription factors are the same transcription factors that are used in the differentiation of the corresponding CD4 T cell members. Thus, Th1 and group 1 ILCs require T-bet, Th2 and group 2 ILCs require GATA3, and Th17, and group 3 ILCs re- quire RORγt.
Since the signature cytokine of NK cells is IFNγ, NK cells are categorized as group 1 ILCs. However, unlike the other CD4 T helper cells, NK cells also play an important role in cytotoxici- ty. Therefore, the NK cells in the group 1 ILCs are considered to be analogous to CD8 T cells, which also have an important cytotoxic role. Notably, because of this distinct function of NK cells, ILCs have also been subcategorized as Killer ILCs versus
Helper ILCs. However, this system is much less commonly used to classify ILCs than the group 1, 2, and 3 ILC categoriza- tion system (Table 2).
The biggest challenge in terms of ILC classification is that unique cell surface markers that differentiate between the ILC subtypes have not yet been clearly established. Hence, as the research on ILCs progresses, it is likely that the classification of ILCs will undergo further definition or even re-categorization.
Thus, based on current knowledge, ILCs can be categorized as follows.
Group 1 ILCs
Group 1 ILCs contain NK cells and ILC1. While the signature cytokine of both cell types is IFNγ, they also produce other proinflammatory cytokines such as TNFα. NK cells also gen- erate perforin and granzyme, which mediate cytotoxicity. It was thought that ILC1s do not express these enzymes until re- cent studies that suggested that ILC1 can also express these proteins and have cytotoxicity activity, albeit weaker than that in NK cells [73]. NK cells and ILCs also share common surface
markers, including NK1.1 and NCR1. It was also initially thought that NK cells and ILC1s express unique cell surface markers, including CD49b (DX5) for NK cells and CD27, CD127, and CD49a for ILC1s. However, depending on the tis- sue, activation status and stress conditions, other cell types can express these markers. Therefore, at present, cell surface mark- ers and functions that can clearly differentiate between these two cell types have not yet been identified. Similarly, it was ini- tially thought that a possible distinguishing marker could be Eomes, which is required for the development of NK cells: it was believed that ILC1s do not use Eomes and thus Eomes- tagged mice have often been used to differentiate between these cell types. However, the possibility that Eomes is specific for NK cells recently became less likely when it was found that ILC1s from the salivary gland also express Eomes [74]. Ge- nomic studies have further complicated the matter [75]: the gene expression profiles of NK cells and ILC1s from various tissues at a steady state show that, although these cell types de- velop from different lineages, their gene expression profiles are very similar. This suggests that these two cell types play inter- Table 2. Classification and characterization of ILCs
Variable
Killer ILCs Helper ILCs
Group 1 ILCs Group 1 ILCs Group 2 ILCs Group 3 ILCs
NK cells ILC1 ILC2 ILC3 LTi
Cytotoxicity + – – – –
Surface marker NK1.1, NKp46, IL- 7Rα (CD127)–/+, α2 integrin (CD49b, DX5), CD11b
NK1.1, NKp46, IL- 7Rα (CD127), CD27, α1 integrin (CD49a)
IL-7Rα (CD127), ST2 (IL1RL1, IL- 33R), SCA1, CD117+/–, ICOS, IL-17RB
NKp46, IL-7Rα
(CD127) IL-7Rα (CD127),
CD117+/–, CD4
Immediate precursor Pre-NK cells Id2+PLZF+ ILC
precursor Id2+PLZF+ ILC
precursor Id2+PLZF+ ILC
precursor Id2+ LTi/ILC precursor
Transcription factor T-bet, Eomes, Id2 T-bet GATA3, RORα RORγt, T-bet RORγt
Activating cytokines/
mediators IL-12, IL-15, IL-18 IL-12, IL-15, IL-18 IL-25, IL-33, TSLP IL-1β, IL-23, AHR
ligands IL-1β, IL-23, AHR ligands
Cytokines/mediatorsa IFNγa, TNFα,
perforin, granzyme IFNγa, TNFα IL-4, IL-5a, IL-9,
IL-13a IL-22a, IL-17Aa/F,
GM-CSF IL-22a, IL-17Aa/F, TNFα, GM-CSF
T cell equivalent CD8 T cells CD4 Th1 Cells CD4 Th2 Cells Th17 Cells –
Functions Cytotoxicity Proinflammation Anti-inflammation Proinflammation Lymphoid tissue formation
ILC, innate lymphoid cell; NK, natural killer; LTi, lymphoid tissue inducer; IL, interleukin; ST2, suppression of tumorigenicity 2; SCA1, stem cells antigen-1; ICOS, inducible T-cell costimulator; Id2, inhibitor of DNA binding 2, HLH protein; PLZF, promyelocytic leukemia zinc finger;
GATA3, GATA binding protein 3; RORα, retinoid-related orphan receptor alpha; RORγt, retinoid-related orphan receptor gamma; TSLP, thy- mic stromal lymphopoietin; AHR, airway hyper-reactivity; IFNγ, interferon γ; TNFα, tumor necrosis factor α; GM-CSF, granulocyte-macro- phage colony-stimulating factor.
aCytokines indicate the signature cytokines of each ILC type.