https://doi.org/10.12997/jla.2016.5.2.133
pISSN 2287-2892 • eISSN 2288-2561
JLA
Serum Lipid Level in HBsAg Carriers without a History of Hepatitis based on Nationwide Health and Nutrition Examination Datasets
Bo Kyung Koo1,2, Min Kyong Moon1,2
1Department of Internal Medicine, Seoul National University College of Medicine,
2Department of Internal Medicine, Boramae Medical Center, Seoul, Korea
Objective: We investigated serum lipid levels in asymptomatic HBsAg carriers and the general population using the Korean National Health and Nutrition Examination Survey (KNHANES).
Methods: We analyzed the data of patients aged ≥30 years from the KNHANES 2007-2014 datasets. Subjects with diabetes mellitus, triglyceride levels >1000 mg/dL, a history of heavy alcohol consumption, or lipid-lowering medication were excluded.
HBsAg carriers were divided into “unknown HBsAg carrier” and “known HBsAg carrier” according to previous self-recognition of HBsAg status using a questionnaire.
Results: Compared with control subjects (n=24,880; male 33.9%; mean age 52±14 years), HBsAg carriers (n=1,061;
male 40.6%; mean age 50±13 years) showed significantly higher AST and ALT levels, lower platelet counts and higher body mass index (BMI) (all p<0.001). HBsAg carriers revealed lower total cholesterol, LDL cholesterol and triglyceride levels (all p<0.001) compared with control subjects, irrespective of previous awareness of HBsAg positivity. Hypertriglyceridemia and low HDL cholesterolemia were less prevalent even in the “unknown HBsAg carrier” group compared with control subjects [age, sex and BMI-adjusted odds ratio, 0.566 (95% confidence interval, 0.468-0.684) and 0.822 (0.708-0.956), respectively].
Conclusion: In conclusion, HBsAg carriers exhibited low total cholesterol, LDL cholesterol, and triglyceride levels compared with control subjects. Hypertriglyceridemia and low HDL cholesterolemia were also less frequently detected in HBsAg carriers even after adjustments for age, sex, and BMI. (J Lipid Atheroscler 2016 December;5(2):133-143)
Key Words: Cholesterol, Triglyceride, HDL cholesterol, Hepatitis B virus
Received:
Revised:
Accepted:
November 17, 2016 December 16, 2016 December 19, 2016
Corresponding Author: Min Kyong Moon, Department of Internal Medicine, Seoul National University College of Medicine, 20 Boramae-ro 5-gil, Dongjak-Gu, Seoul 07061, Korea
Tel: +82-2-870-2226, Fax: +82-2-831-2826, E-mail: [email protected]
This is an Open Access article distributed under the terms of the Creative Commons Attribution Non-Commercial License (http://creativecommons.org/licenses/by-nc/3.0) which permits unrestricted non-commercial use, distribution, and reproduction in any medium, provided the original work is properly cited.
INTRODUCTION
Liver diseases can alter serum lipid levels by altering lipoprotein synthesis, secretion and catabolism.1,2 Subjects with chronic hepatitis have lower low-density lipoprotein (LDL), high-density lipoprotein (HDL) and total cholesterol levels and lower triglyceride level, when compared with healthy subjects.2 These decreases in lipid levels become more prominent as the disease advances.2 Hepatitis C virus (HCV) infection is well-known to directly affect lipid
metabolism aside from liver function; HCV interferes with lipid metabolism via impaired lipoprotein secretion, increased lipogenesis, and impaired fatty acid degra- dation.3 HCV infection is closely associated with insulin resistance, and each can aggravate the course of the other.3
However, the association between hepatitis B virus (HBV) and lipid metabolism or insulin resistance has been rarely been reported, using a small number of study subjects. In chronic HBV-infection, there appears to be
no association between insulin resistance and histologic severity among chronic HBV-infected subjects.4,5 However, controversy exists concerning the association between HBV infection and insulin resistance or lipid metabolism.6,7 A Korean group recently reported that chronic HBV infection was associated with increased insulin resistance and high cholesterol levels, when compared with that of healthy controls.6 As chronic HBV infection is more popular in the Korean population, as compared with Caucasians, it may be important to investigate whether HBV infection affects insulin resistance or lipid metabolism in the Korean population.
The present study used Korean National Health and Nutrition Examination Survey (KNHANES) data, which is a nationwide survey that includes the HBV surface antigen (HBsAg) titer of participants (even those without any history of hepatitis), to compare lipid profiles between HBsAg carriers and control subjects. Data of HBsAg carriers without previous awareness of HBsAg positivity may be helpful in investigating the effect of HBV infection on lipid profile and insulin resistance aside from liver disease status.
MATERIALS AND METHODS
1. SubjectsThe present analysis of patients aged ≥30 years was conducted using data from KNHANES 2007–2014, which is a nationwide survey conducted by the Ministry of Health and Welfare of Korea. Among 38,800 individuals aged
≥30 years with HBsAg data, subjects with the following were excluded: (i) diabetes mellitus; (ii) triglyceride levels
>1,000 mg/dL (to rule out cases with hereditary hypertriglyceridemia8); (iii) a history of heavy alcohol consumption; or (iv) lipid-lowering medication. Heavy alcohol consumption was defined as consuming >60 g (40 g for women) of alcohol/day with a frequency of
≥1/week.9 As diabetes mellitus significantly affects lipid
metabolism, patients with diabetes were excluded. In total, 26,016 subjects aged ≥30 years were included in the analysis.
This study was approved by the Institutional Review Board of Korea Centers for Disease Control and Prevention.
2. Measurement of metabolic parameters and case definitions
Anthropometric and laboratory measurements in the KNHANES were as described below. Height was measured to the nearest 0.1 cm using a stadiometer (Seca 210; Seca, Hamburg, Germany) and weight was measured to the nearest 0.1 kg using a calibrated balance beam scale (Giant-150N; Hana, Seoul, Korea). Body mass index (BMI) was calculated as body weight (kg) divided by square of height (m2).2 Waist circumference was measured to the nearest 0.1 cm from the narrowest point between the lower borders of the rib cage and the iliac crest at the end of normal expiration. Fasting plasma concentrations of glucose, total cholesterol, HDL cholesterol, LDL cholesterol, and triglycerides were measured by using respective equipment [ADIVIA 1650, Siemens, USA (2007); Hitachi Automatic Analyzer 7600, Hitachi, Tokyo, Japan (2008-2012); COBAS 8000 C702, Roche, Germany (2013–2014)]. To verify the accuracy of HDL cholesterol, traceability analysis was conducted to confirm the accuracy of HDL cholesterol measurements. Differences in HDL cholesterol values from Korean Central Laboratory and U.S. Centers for Disease Control and Prevention (CDC) were 2.3–9.2% in each KNHANES. For this reason, a new regression formula of HDL cholesterol was necessary to verify HDL cholesterol values; the conversion rates were obtained via the Passing and Bablok regression method as follows:
• Revised HDL cholesterol (2007)=(1.15×HDL chole- sterol+3.70)×0.872+2.460 (mg/dL)
• Revised HDL cholesterol (2008-2011, 2013)=0.872
×HDL cholesterol+6.162 (mg/dL)
• Revised HDL cholesterol (2012)=0.952×HDL chole- sterol+1.096 (mg/dL)
Cases of diabetes mellitus were defined as subjects who (i) were using anti-diabetic medication, including insulin, at the time of the survey, (ii) had hemoglobin A1c ≥48 mmol/mol (6.5%), or (iii) had 8-h fasting plasma glucose levels ≥126 mg/dL. Hypertension was defined as blood pressure ≥140/90 mmHg or the use of antihypertensive medication. Based on the revised National Cholesterol Education Program - Adult Treatment Panel III (NCEP-ATP III) criteria,10 we defined metabolic syndrome as the presence of 3 or more of the following 5 components:
(i) abdominal obesity, waist circumference ≥90 and ≥85 cm in men and women, respectively11 suggested by the Korean Society for the Study of Obesity, (ii) blood pressure
≥130/85 mmHg, (iii) triglyceride ≥150 mg/dL, (iv) high-density lipoprotein (HDL) cholesterol <40 mg/dl in men and <50 mg/dl in women, and (v) elevated blood glucose levels and fasting blood glucose >100 mg/dl. Body mass index (BMI) ≥25 kg/m2 is defined as obesity according to Obesity Task Force criteria for the Asian-Pacific population.12
HBsAg was measured using electrochemiluminescence immunoassay [E-170, Roche, Germany (2007–2012);
Cobas8000 e602, Roche, Germany (2013–2014)]; and anti-hepatitis C antibody (HCV-Ab) was measured using ARCHITECT i4000Sr (ABBOTT, Germany). HBsAg carriers were divided into “unknown HBsAg carrier” and “known HBsAg carrier” according to previous self-recognition of HBsAg status using a questionnaire, in order to avoid the effect of awareness of HBsAg positivity. Control subjects were defined as subjects without HBsAg, HCV-Ab, or any history of hepatitis, as assessed via the questionnaire.
The FIB-4 index was calculated from “(age [year] × AST [IU/L]) / (platelet count [109/L]×ALT [U/L]1/2)”.13 The FIB-4 index was developed as a marker of fibrosis in HCV-related hepatitis13 and it is also useful for detecting significant
fibrosis and cirrhosis in HBV-infected patients.14 A FIB-4 index <1.45 had a negative predictive value of 90% for advanced fibrosis.13
Those who stated performing 30-min moderate- intensity exercise ≥5 days a week or 20-min high-intensity exercise ≥3 days a week were considered to have attained the aerobic exercise goal. The goal for resistance exercise was performing resistance exercise ≥2 days/week.
Nutritional information was collected using 24-h recall administered by a trained dietary interviewer in the Korea Health Industry Development Institute. The 24-h recall was based on a 1-week diary of daily food intake and nutrients were quantified using the Database Management System (Korea Health Industry Development Institute, Seoul, Korea). To aid recall, supplementary tools, such as food models and two-dimensional food volumes and containers, were used. Detailed data has been published previously.15 Heavy drinking was defined as consuming
>60 g (40g for women) of alcohol/day,9 and frequency of heavy drinking was compared according to HBsAg status.
3. Statistical analyses
All statistical analyses were performed using a complex sample design using SPSS version 20.0 (SPSS IBM Co., Armonk, NY, U.S.). The statistical significance of differences between groups was evaluated using the independent t-test or the Mann-Whitney U test for continuous variables and the chi-square test for categorical variables. The linear-by-linear association test was used to identify trends in the prevalence of metabolic syndrome according to HBsAg status. Binary logistic regression analysis was used to compare the prevalence of dyslipidemia or metabolic syndrome according to HBsAg status with adjustments for age, sex, and BMI. To investigate the independent association between lipid level and HBsAg titer, a linear regression model adjusted for covariates was used.
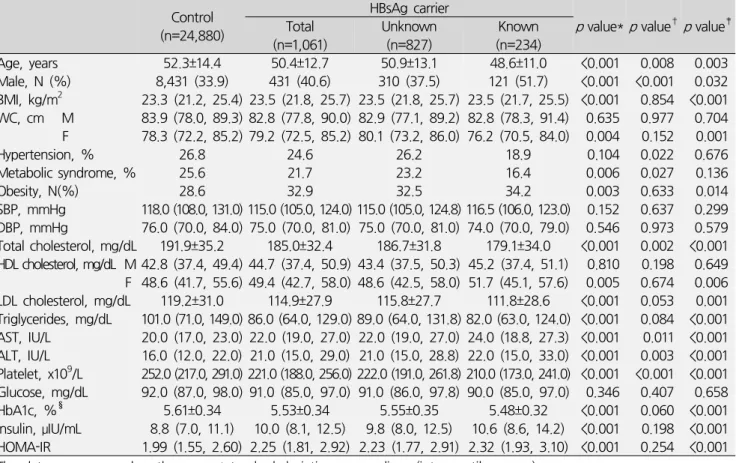
Table 1. Characteristics of study participants according to HBsAg status Control
(n=24,880)
HBsAg carrier
p value*p value†p value‡ Total
(n=1,061) Unknown
(n=827) Known
(n=234)
Age, years 52.3±14.4 50.4±12.7 50.9±13.1 48.6±11.0 <0.001 0.008 0.003
Male, N (%) 8,431 (33.9) 431 (40.6) 310 (37.5) 121 (51.7) <0.001 <0.001 0.032 BMI, kg/m2 23.3 (21.2, 25.4) 23.5 (21.8, 25.7) 23.5 (21.8, 25.7) 23.5 (21.7, 25.5) <0.001 0.854 <0.001 WC, cm M 83.9 (78.0, 89.3) 82.8 (77.8, 90.0) 82.9 (77.1, 89.2) 82.8 (78.3, 91.4) 0.635 0.977 0.704 F 78.3 (72.2, 85.2) 79.2 (72.5, 85.2) 80.1 (73.2, 86.0) 76.2 (70.5, 84.0) 0.004 0.152 0.001
Hypertension, % 26.8 24.6 26.2 18.9 0.104 0.022 0.676
Metabolic syndrome, % 25.6 21.7 23.2 16.4 0.006 0.027 0.136
Obesity, N(%) 28.6 32.9 32.5 34.2 0.003 0.633 0.014
SBP, mmHg 118.0 (108.0, 131.0) 115.0 (105.0, 124.0) 115.0 (105.0, 124.8) 116.5 (106.0, 123.0) 0.152 0.637 0.299 DBP, mmHg 76.0 (70.0, 84.0) 75.0 (70.0, 81.0) 75.0 (70.0, 81.0) 74.0 (70.0, 79.0) 0.546 0.973 0.579 Total cholesterol, mg/dL 191.9±35.2 185.0±32.4 186.7±31.8 179.1±34.0 <0.001 0.002 <0.001 HDL cholesterol, mg/dL M 42.8 (37.4, 49.4) 44.7 (37.4, 50.9) 43.4 (37.5, 50.3) 45.2 (37.4, 51.1) 0.810 0.198 0.649 F 48.6 (41.7, 55.6) 49.4 (42.7, 58.0) 48.6 (42.5, 58.0) 51.7 (45.1, 57.6) 0.005 0.674 0.006 LDL cholesterol, mg/dL 119.2±31.0 114.9±27.9 115.8±27.7 111.8±28.6 <0.001 0.053 0.001 Triglycerides, mg/dL 101.0 (71.0, 149.0) 86.0 (64.0, 129.0) 89.0 (64.0, 131.8) 82.0 (63.0, 124.0) <0.001 0.084 <0.001 AST, IU/L 20.0 (17.0, 23.0) 22.0 (19.0, 27.0) 22.0 (19.0, 27.0) 24.0 (18.8, 27.3) <0.001 0.011 <0.001 ALT, IU/L 16.0 (12.0, 22.0) 21.0 (15.0, 29.0) 21.0 (15.0, 28.8) 22.0 (15.0, 33.0) <0.001 0.003 <0.001 Platelet, x109/L 252.0 (217.0, 291.0) 221.0 (188.0, 256.0) 222.0 (191.0, 261.8) 210.0 (173.0, 241.0) <0.001 <0.001 <0.001 Glucose, mg/dL 92.0 (87.0, 98.0) 91.0 (85.0, 97.0) 91.0 (86.0, 97.8) 90.0 (85.0, 97.0) 0.346 0.407 0.658
HbA1c, %§ 5.61±0.34 5.53±0.34 5.55±0.35 5.48±0.32 <0.001 0.060 <0.001
Insulin, μIU/mL 8.8 (7.0, 11.1) 10.0 (8.1, 12.5) 9.8 (8.0, 12.5) 10.6 (8.6, 14.2) <0.001 0.198 <0.001 HOMA-IR 1.99 (1.55, 2.60) 2.25 (1.81, 2.92) 2.23 (1.77, 2.91) 2.32 (1.93, 3.10) <0.001 0.254 <0.001 The data are expressed as the means±standard deviations or medians (interquartile ranges)
*Comparing control vs. entire HBsAg carriers, †Comparing “unknown HBsAg carriers” vs. “known HBsAg carriers”, ‡Comparing control vs. “unknown HBsAg carriers”, §HbA1c from Korean National Health and Nutrition Examination Survey (KNHANES) 2011-2014, as all adult participants in KNHANES were measured their HbA1c level since 2011.
Abbreviations: BMI; body mass index, WC; waist circumference, SBP; systolic blood pressure, DBP; diastolic blood pressure, HDL;
high-density lipoprotein, ALT; alanine aminotransferase, AST; aspartate aminotransferase, HOMA-IR; homeostasis model assessment of insulin resistance
p values from independent T test, Mann-Whitney or chi-square test
RESULTS
1. Baseline characteristics and lipid profiles accor- ding to HBsAg status
Among 26,016 eligible subjects, 1,061 subjects (431 men and 630 women) exhibited HBsAg. Among subjects without HBsAg (n=24,955), control subjects who did not have HCV-Ab or any previous history of hepatitis were defined (n=24,880).
Compared with control subjects, HBsAg carriers were significantly younger (mean age: 50.4±12.7 years vs. 52.3
±14.4 years), more male-prevalent (40.6% vs. 33.9%)
and had higher BMI [median BMI (interquartile range), 23.5 (21.8, 25.7) vs. 23.3 (21.2, 25.4) kg/m2]. HBsAg carriers had significantly higher AST and ALT levels (both p<0.001) and lower platelet counts (p<0.001), compared with control subjects (Table 1). HBsAg carriers also exhibited a higher prevalence of obesity (32.9% vs.
28.6%, p=0.003); both fasting insulin and HOMA-IR were also significantly higher in HBsAg carriers compared with control subjects (both p<0.001). However, the prevalence of metabolic syndrome was significantly lower in HBsAg carriers compared with control subjects (21.7% vs. 25.6%, p=0.006). In addition, they had lower total cholesterol
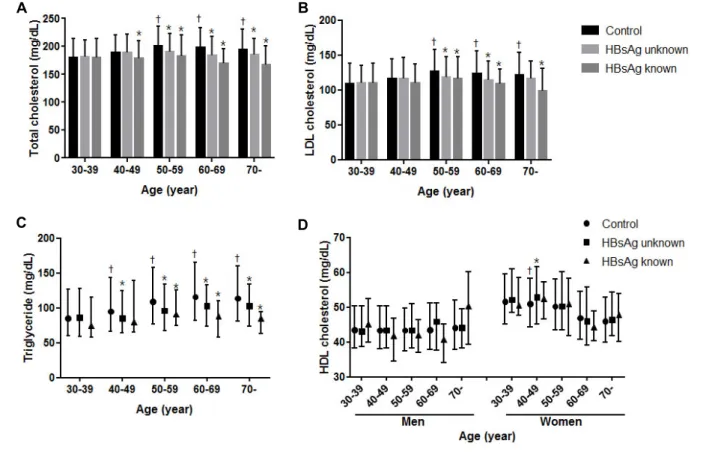
Fig. 1. Serum total cholesterol (A), LDL cholesterol (B), triglyceride (C) and HDL cholesterol level (D) according to HBsAg status in age group. Total cholesterol and LDL cholesterol levels were compared between HBsAg carriers and control subjects using independent t-test; for comparison of triglyceride and HDL cholesterol level, the Mann-Whitney U test was used.
Total cholesterol and LDL cholesterol level in each group was presented as mean value with standard deviation (A, B), and triglyceride and HDL cholesterol level was as median value with interquartile range (C, D).
*significantly different compared to control group (p<0.05), †significantly different compared to entire HBsAg carriers (p<0.05)
(p<0.001), LDL cholesterol (p<0.001), triglyceride (p<
0.001) and HbA1c (p<0.001) levels. In women, HDL cholesterol levels were significantly higher in HBsAg carriers, as compared with that of control subjects (p= 0.005). Between the groups, there was no difference in fasting glucose level and systolic or diastolic blood pressure according to HBsAg status (Table 1).
On comparing control subjects with “unknown HBsAg carriers” alone, the same patterns were maintained.
Compared with control subjects, “unknown HBsAg carriers” also had significantly higher AST and ALT levels (both p<0.001), higher fasting insulin and HOMA-IR levels (both p<0.001), higher prevalence of obesity (p=0.014), and significantly lower levels of total cholesterol, LDL
cholesterol, and triglyceride (p<0.001, p=0.001 and p<0.001, respectively; Table 1).
As there was statistically significant differences in age, stratified analysis according to age was subsequently performed. Although statistical significance could not be gained in a few age-groups due to a limited number of subjects in each group, the same findings were found in these stratified analyses: HBsAg carriers exhibited lower total cholesterol, LDL cholesterol, and triglyceride levels when compared with control subjects in each age group (Fig. 1). For HDL cholesterol, there was no statistical difference between HBsAg carriers and control subjects, with the exception of women with aged 40–49 years, in which HBsAg carriers exhibited higher HDL cholesterol
A B
C D
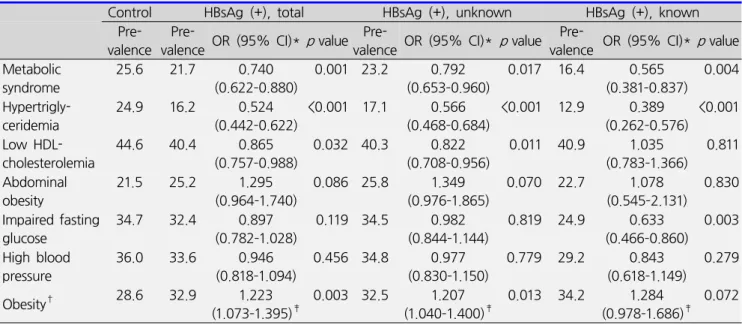
Table 2. Risk of metabolic abnormality in subjects with HBsAg compared to control subjects
Control HBsAg (+), total HBsAg (+), unknown HBsAg (+), known Pre-
valence Pre-
valence OR (95% CI)*p value Pre-
valence OR (95% CI)* p value Pre-
valence OR (95% CI)* p value Metabolic
syndrome
25.6 21.7 0.740
(0.622–0.880)
0.001 23.2 0.792
(0.653–0.960)
0.017 16.4 0.565
(0.381–0.837)
0.004 Hypertrigly-
ceridemia 24.9 16.2 0.524
(0.442–0.622) <0.001 17.1 0.566
(0.468–0.684) <0.001 12.9 0.389
(0.262–0.576) <0.001 Low HDL-
cholesterolemia 44.6 40.4 0.865
(0.757–0.988) 0.032 40.3 0.822
(0.708–0.956) 0.011 40.9 1.035
(0.783–1.366) 0.811 Abdominal
obesity
21.5 25.2 1.295
(0.964–1.740)
0.086 25.8 1.349
(0.976–1.865)
0.070 22.7 1.078
(0.545–2.131)
0.830 Impaired fasting
glucose 34.7 32.4 0.897
(0.782–1.028) 0.119 34.5 0.982
(0.844–1.144) 0.819 24.9 0.633
(0.466–0.860) 0.003 High blood
pressure 36.0 33.6 0.946
(0.818–1.094) 0.456 34.8 0.977
(0.830–1.150) 0.779 29.2 0.843
(0.618–1.149) 0.279
Obesity† 28.6 32.9 1.223
(1.073–1.395)‡
0.003 32.5 1.207
(1.040–1.400)‡
0.013 34.2 1.284
(0.978–1.686)‡ 0.072
*With adjustment for age, sex and body mass index, †Defined as body mass index ≥25 kg/m2, ‡With adjustment for age and sex
Abbreviations: OR; odds ratio, CI; confidence interval
levels compared with control subjects (p=0.019). On comparing control subjects with “unknown HBsAg carriers” alone, the same tendency was noted. “Unknown HBsAg carriers” exhibited lower total cholesterol, LDL cholesterol, and triglyceride levels compared with control subjects in each age group (Fig. 1).
To exclude patients with cirrhosis, cholesterol levels were subsequently analyzed in participants with an FIB-4 index <1.45, as an FIB-4 index <1.45 has a negative predictive value of 90% for advanced fibrosis.13 Total cholesterol and triglyceride levels were also significantly reduced in HBsAg carriers (p=0.001 and p<0.001, respectively; Supplementary Table 1). Although statistical significance could not be detected in the analysis for LDL cholesterol, there was a trend that HBsAg carriers had lower levels of LDL cholesterol when compared with control subjects (Supplementary Table 1). Furthermore, HBsAg carriers had higher HDL cholesterol levels when compared with control subjects, but only in women (p= 0.010; Supplementary Table 1).
2. Prevalence of metabolic syndrome and obesity according to HBsAg status
Prevalence of metabolic syndrome was decreased in HBsAg carriers irrespective of HBsAg awareness status, even after adjustment for age, sex, and BMI (Table 2).
Among components of metabolic syndrome, hypertri- glyceridemia and low HDL cholesterolemia were less frequently found even in “unknown HBsAg carriers”, when compared with control subjects, even after adjustment for age, sex, and BMI. The prevalence of hypertrigly- ceridemia was 24.9%, 17.1%, and 12.9% in controls,
“unknown HBsAg carriers” and “known HBsAg carriers”, respectively. The risk of hypertriglyceridemia was signifi- cantly lower in “unknown HBsAg carriers” [odds ratio (OR), 0.566; 95% confidence interval (CI), 0.468–0.684] and
“known HBsAg carriers” (OR, 0.389; 95% CI, 0.262–
0.576), as compared with control subjects. The prevalence of low HDL cholesterolemia (OR, 0.822; 95% CI, 0.708–
0.956) and metabolic syndrome (OR, 0.792; 95% CI, 0.653–0.960) was also lower in “unknown HBsAg carriers”,
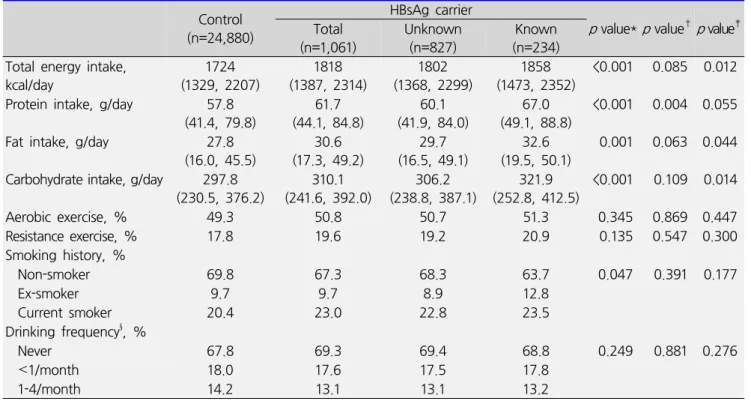
Table 3. Energy intake and health-related activity in daily life according to HBsAg status Control
(n=24,880)
HBsAg carrier
p value*p value†p value‡ Total
(n=1,061) Unknown
(n=827) Known
(n=234) Total energy intake,
kcal/day
1724 (1329, 2207)
1818 (1387, 2314)
1802 (1368, 2299)
1858 (1473, 2352)
<0.001 0.085 0.012 Protein intake, g/day 57.8
(41.4, 79.8) 61.7
(44.1, 84.8) 60.1
(41.9, 84.0) 67.0
(49.1, 88.8) <0.001 0.004 0.055
Fat intake, g/day 27.8
(16.0, 45.5) 30.6
(17.3, 49.2) 29.7
(16.5, 49.1) 32.6
(19.5, 50.1) 0.001 0.063 0.044 Carbohydrate intake, g/day 297.8
(230.5, 376.2)
310.1 (241.6, 392.0)
306.2 (238.8, 387.1)
321.9 (252.8, 412.5)
<0.001 0.109 0.014
Aerobic exercise, % 49.3 50.8 50.7 51.3 0.345 0.869 0.447
Resistance exercise, % 17.8 19.6 19.2 20.9 0.135 0.547 0.300
Smoking history, %
Non-smoker 69.8 67.3 68.3 63.7 0.047 0.391 0.177
Ex-smoker 9.7 9.7 8.9 12.8
Current smoker 20.4 23.0 22.8 23.5
Drinking frequency§, %
Never 67.8 69.3 69.4 68.8 0.249 0.881 0.276
<1/month 18.0 17.6 17.5 17.8
1-4/month 14.2 13.1 13.1 13.2
The data are expressed as the means±standard deviations or medians (interquartile ranges) p values from independent T test, Mann-Whitney or chi-square test
*Comparing control vs. entire HBsAg carriers, †Comparing "unknown HBsAg carriers" vs. "known HBsAg carriers", ‡Comparing control vs. "unknown HBsAg carriers", §Frequency of alcohol drinking more than 60 g (40 g for women) of alcohol
when compared with control subjects, even after adjustment for age, sex, and BMI (Table 2). In contrast, obesity was more prevalent in “unknown HBsAg carriers”
when compared with control subjects (age and sex-adjusted OR, 1.207; 95% CI, 1.040–1.400). The prevalence of abdominal obesity, impaired fasting glucose or high blood pressure exhibited no difference between
“unknown HBsAg carriers” and control subjects after adjustment for age and sex (Table 2).
As there was a statistically significant difference in age and sex among HBsAg status, age and sex-stratification analysis was performed. Although statistical significance could not be detected due to the limited number of subjects in each age- and sex-stratified group, the same tendency was found after stratified analyses for the association between HBsAg status and hypertriglyceridemia, low HDL cholesterolemia and obesity (Supplementary Fig. 1).
3. Energy intake and health-related activity in daily life according to HBsAg status
To investigate whether there was a difference in lifestyle associated with metabolic disease according to HBsAg status, energy intake and exercise were compared between control subjects and HBsAg carriers. HBsAg carriers showed a significantly higher daily total energy intake compared with control subjects (Table 3). The amount of daily protein intake, fat intake and carbohydrate intake was also increased in HBsAg carriers when compared with control subjects (Table 3).
There was no difference in the prevalence of subjects performing aerobic exercise or resistance exercise among the groups and no difference was found in the frequency of alcohol intake (Table 3). Current smoking status was more prevalence in HBsAg carriers, compared with that
Table 4. Association between HBsAg titer (/1,000) and metabolic parameters among HBsAg carriers
β (standard error)* p value Total cholesterol -0.953 (0.364) 0.009 LDL cholesterol -0.568 (0.316) 0.073 HDL-cholesterolemia† (M) 0.000 (0.001) 0.636 (F) 0.002 (0.001) 0.006
Triglyceride† -0.004 (0.002) 0.072
Insulin† 0.004 (0.003) 0.156
HOMA-IR† 0.004 (0.003) 0.147
AST† 0.000 (0.002) 0.810
ALT† 0.001 (0.003) 0.728
Platelet† -0.004 (0.002) 0.011
*With adjustment for age, sex and body mass index, †Log- transformed before analysis
Abbreviations: HDL; high-density lipoprotein, ALT; alanine aminotransferase, AST; aspartate aminotransferase, HOMA- IR; homeostasis model assessment of insulin resistance
of control subjects (p=0.047). Stratified analysis according to awareness of HBsAg positivity also demonstrated the same trend, despite the weakened statistical significance (Table 3).
4. The association between lipid levels and HBsAg titer
The association between lipid levels and HBsAg titer was investigated among HBsAg carriers. Among serum lipid levels, total cholesterol levels showed a significant negative correlation with HBsAg titer even after adjustment for age, sex, and BMI (p=0.009; Table 4).
HBsAg titer also exhibited a trend of negative association with LDL cholesterol (p=0.073) and triglyceride (p=0.072) levels.
DISCUSSION
Using nationwide health and nutrition examination datasets, the present study showed that HBV carriers have lower LDL cholesterol and triglyceride levels compared with control subjects, irrespective of the previous awareness status of HBsAg positivity. HBsAg carriers also
showed a tendency for higher HDL cholesterol levels despite its relatively low statistical significance. Owing to lower prevalence of hypertriglyceridemia and low HDL-cholesterolemia, the prevalence of metabolic syndrome was significantly lower in HBsAg carriers, even in those who were previously unaware of their HBsAg positivity. A previous epidemiologic study in the Chinese population also showed that the likelihood of developing metabolic syndrome was 26% lower in HBsAg-positive subjects than control subjects.16
This is an interesting finding considering that HBV carriers were more insulin resistant and more obese when compared with the control subjects in our study population. Low cholesterol and triglyceride levels in HBsAg carriers in the present study may be in the line with the findings observed in advanced liver disease.2 However, relatively high HDL cholesterol levels and a significantly lower prevalence of low HDL cholesterolemia was detected in “unknown HBsAg carriers” in our study, indicating that asymptomatic HBV infection may be associated with low risk of dyslipidemia aside from low lipid levels, which are associated with decreased lipid metabolism in liver diseases. In advanced liver diseases, HDL cholesterol levels are also significantly decreased as disease severity increases,17 which is in contrast with the present findings. In our study, HBsAg titer exhibited a significant negative correlation with total cholesterol level even after adjustments for age, sex and BMI. A recent study reported that chronic HBV infection was associated with high cholesterol levels and increased insulin resistance compared to healthy controls6; however, control subjects were significantly younger than patients with chronic HBV infection in that study (44 years vs. 51 years). Subsequent studies to elucidate the mechanism of lipid metabolism in HBV infection are required.
The association between HBV infection and insulin resistance has been debated. At first, hyperinsulinemia of chronic active hepatitis can result from impaired insulin
removal rather than pancreatic hypersecretion or insulin resistance.18,19 High fasting insulin levels and high HOMA-IR, calculated from fasting insulin, in HBsAg carriers in our study may also be the result of decreased insulin removal. The prevalence of impaired fasting glucose in our study was not higher among the HBsAg carriers despite their significantly increased levels of fasting insulin, which also indicated that fasting insulin level may not be suitable for insulin resistance markers in HBsAg carriers. Previous studies have shown that hyperinsuli- nemia found in subjects with chronic HBV hepatitis was not associated with HBV infection itself5,7; it was merely determined by host factors, such as obesity5 or fatty liver disease.7 However, recent epidemiologic studies report that HBV infection is associated with a significant increase in the risk of diabetes compared with uninfected persons.20,21 Furthermore, among protein originating from the HBV genome, HBx protein impaired hepatic insulin signaling through the degradation of insulin receptor substrate protein and induction of suppressor of cytokine signaling (SOCS).22
There are several limitations to this study. Firstly, since this is a cross-sectional study, a causal relationship could not be proven. We could not show the mechanism underlying not only the association between lipid prolife and HBsAg status but also the discrepancy between prevalence of dyslipidemia and insulin resistance accor- ding to HBsAg status. Secondly, the questionnaires were self-reported, and may have been subjected to recall bias.
However, the strength of our study is that data were analyzed from a nationwide survey using a large number of individuals. Notably, inclusion of a relatively large number of HBsAg carriers who were previously unaware of their HBsAg status (n=827) may reduce the bias from health pursuits associated with an awareness of HBsAg positivity.
In conclusion, HBsAg carriers exhibited low total cholesterol, LDL cholesterol, and triglyceride levels
compared with control subjects. Hypertriglyceridemia, low HDL cholesterolemia and metabolic syndrome were also less frequently detected in HBsAg carriers, even after adjustments for age, sex, and BMI.
FINANCIAL DISCLOSURE
The authors have nothing to disclose.
This work has no grant support.
REFERENCES
1. Fabris C, Federico E, Soardo G, Falleti E, Pirisi M. Blood lipids of patients with chronic hepatitis: differences related to viral etiology. Clin Chim Acta 1997;261:159- 165.
2. Cicognani C, Malavolti M, Morselli-Labate AM, Zamboni L, Sama C, Barbara L. Serum lipid and lipoprotein patterns in patients with liver cirrhosis and chronic active hepatitis. Arch Intern Med 1997;157:792-796.
3. Alaei M, Negro F. Hepatitis C virus and glucose and lipid metabolism. Diabetes Metab 2008;34:692-700.
4. Kumar M, Choudhury A, Manglik N, Hissar S, Rastogi A, Sakhuja P, et al. Insulin resistance in chronic hepatitis B virus infection. Am J Gastroenterol 2009;104:76-82.
5. Park SH, Kim DJ, Lee HY. Insulin resistance is not associated with histologic severity in nondiabetic, noncirrhotic patients with chronic hepatitis B virus infection. Am J Gastroenterol 2009;104:1135-1139.
6. Lee JG, Lee S, Kim YJ, Cho BM, Park JS, Kim HH, et al.
Association of chronic viral hepatitis B with insulin resistance. World J Gastroenterol 2012;18:6120-6126.
7. Wang CC, Hsu CS, Liu CJ, Kao JH, Chen DS. Association of chronic hepatitis B virus infection with insulin resistance and hepatic steatosis. J Gastroenterol Hepatol 2008;23:779-782.
8. Jacobson TA, Miller M, Schaefer EJ. Hypertriglyceridemia and cardiovascular risk reduction. Clin Ther 2007;29:
763-777.
9. World Health Organization, Noncommunicable Disease and Mental Health Cluster, Department of Mental Health and Substance Dependence. International guide for
monitoring alcohol consumption and related harm.
Geneva: World Health Organization; 2000.
10. Expert Panel on Detection, Evaluation, and Treatment of High Blood Cholesterol in Adults. Executive summary of the third report of the National Cholesterol Education Program (NCEP) expert panel on detection, evaluation, and treatment of high blood cholesterol in adults (Adult Treatment Panel III). JAMA 2001;285:2486-2497.
11. Lee SY, Park HS, Kim DJ, Han JH, Kim SM, Cho GJ, et al. Appropriate waist circumference cutoff points for central obesity in Korean adults. Diabetes Res Clin Pract 2007;75:72-80.
12. World Health Organization Western Pacific Region;
International Association for the Study of Obesity;
International Obesity Task Force. The Asia-Pacific perspective: redefining obesity and its treatment.
Sydney: Health Communications Australia Pty Limited;
2000.
13. Sterling RK, Lissen E, Clumeck N, Sola R, Correa MC, Montaner J, et al. Development of a simple noninvasive index to predict significant fibrosis in patients with HIV/HCV coinfection. Hepatology 2006;43:1317-1325.
14. Li Y, Chen Y, Zhao Y. The diagnostic value of the FIB-4 index for staging hepatitis B-related fibrosis: a meta- analysis. PLoS One 2014;9:e105728.
15. Ministry of Health and Welfare, Korea Centers for Disease Control and Prevention. Korea Health Statistics 2009: Korea National Health and Nutrition Examination Survey (KNHANES IV-3). Cheongwon: Korea Centers for Disease Control and Prevention; 2010.
16. Jan CF, Chen CJ, Chiu YH, Chen LS, Wu HM, Huang CC, et al. A population-based study investigating the association between metabolic syndrome and hepatitis B/C infection (Keelung Community-based Integrated Screening study No. 10). Int J Obes (Lond) 2006;30:
794-799.
17. Ghadir MR, Riahin AA, Havaspour A, Nooranipour M, Habibinejad AA. The relationship between lipid profile and severity of liver damage in cirrhotic patients. Hepat Mon 2010;10:285-288.
18. Bonora E, Coscelli C, Orioli S, Cambi R, Buzzelli G, Gentilini P, et al. Hyperinsulinemia of chronic active hepatitis: impaired insulin removal rather than pancreatic hypersecretion. Horm Metab Res 1984;16:111-114.
19. Letiexhe MR, Scheen AJ, Gérard PL, Bastens BH, Pirotte J, Belaiche J, et al. Insulin secretion, clearance, and action on glucose metabolism in cirrhotic patients. J Clin Endocrinol Metab 1993;77:1263-1268.
20. Li-Ng M, Tropp S, Danoff A, Bini EJ. Association between chronic hepatitis B virus infection and diabetes among Asian Americans and Pacific Islanders. Dig Liver Dis 2007;39:549-556.
21. Lao TT, Tse KY, Chan LY, Tam KF, Ho LF. HBsAg carrier status and the association between gestational diabetes with increased serum ferritin concentration in Chinese women. Diabetes Care 2003;26:3011-3016.
22. Kim K, Kim KH, Cheong J. Hepatitis B virus X protein impairs hepatic insulin signaling through degradation of IRS1 and induction of SOCS3. PLoS One 2010;5:e8649.
Supplementary Fig. 1. Prevalence of hypertriglyceridemia (A), low HDL cholesterolemia (B), and obesity (C) according to HBsAg status in each age and sex group
Supplementary Table 1. Characteristics of study participants according to HBsAg status with FIB-4 <1.45 Control
(n=15,117)
HBsAg carrier
p value*p value†p value‡ Total
(n=542) Unknown
(n=432) Known
(n=110)
Age, years 48.0±12.2 45.2±10.2 45.4±10.4 44.3±9.1 <0.001 0.302 <0.001
Male, N (%) 4,802 (31.8) 212 (39.1) 155 (35.9) 57 (51.8) <0.001 0.002 0.070 BMI, kg/m2 23.2 (21.3, 25.4) 23.6 (21.9, 25.7) 23.6 (21.9, 25.7) 23.5 (21.9, 25.5) 0.002 0.944 0.004
Metabolic syndrome, % 23.8 19.8 21.3 14.2 0.035 0.101 0.227
Obesity, N (%) 29.0 32.5 32.0 34.5 0.077 0.614 0.177
Total cholesterol, mg/dL 192.7±35.2 188.1±32.7 189.7±31.8 181.7±35.4 0.001 0.023 0.050 HDL cholesterol, mg/dL M 43.4 (38.0, 50.3) 42.5 (38.4, 49.0) 42.6 (38.2, 49.0) 42.0 (36.1, 49.5) 0.161 0.464 0.412 F 50.4 (43.4, 58.2) 51.1 (45.1, 60.5) 51.6 (45.1, 60.9) 49.4 (44.3, 58.5) 0.011 0.508 0.009 LDL cholesterol, mg/dL 119.7±30.8 117.6±29.0 118.6±28.9 113.9±29.3 0.101 0.135 0.419 Triglycerides, mg/dL 101.0 (70.0, 150.0) 89.0 (65.0, 130.0) 92.0 (65.0, 131.0) 81.5 (65.3, 124.0) <0.001 0.207 0.002 AST, IU/L 19.0 (16.0, 22.0) 21.0 (18.0, 24.0) 20.0 (18.0, 23.8) 22.0 (18.0, 27.0) <0.001 0.068 <0.001 ALT, IU/L 16.0 (12.0, 22.0) 19.0 (15.0, 26.3) 18.5 (15.0, 26.0) 21.5 (15.0, 35.0) <0.001 0.031 <0.001 Insulin, μIU/mL 8.82 (7.11, 11.22) 10.07 (8.21, 12.52) 9.87 (8.01, 12.38) 10.7 (8.62, 14.78) <0.001 0.165 <0.001 HOMA-IR 2.00 (1.57, 2.60) 2.25 (1.82, 2.94) 2.23 (1.76, 2.86) 2.32 (1.94, 3.13) <0.001 0.164 <0.001 The data are expressed as the means±standard deviations or medians (interquartile ranges)
Abbreviations: BMI; body mass index, HDL; high-density lipoprotein, ALT; alanine aminotransferase, AST; aspartate aminotransferase, HOMA-IR; homeostasis model assessment of insulin resistance
p values from independent T test, Mann-Whitney or chi-square test
*Comparing control vs. entire HBsAg carriers, †Comparing "unknown HBsAg carriers" vs. "known HBsAg carriers", ‡Comparing control vs. "unknown HBsAg carriers"
A B
C