Overestimation of own body weights in female university students: associations with lifestyles, weight control behaviors and depression
Miso Kim1 and Hongmie Lee2§
1Graduate School of Nutrition Education, Daejin University, Kyeonggi-do 487-711, Korea
2Department of Food Science & Nutrition, Daejin University, 11-1 Sundan-dong, Pocheon-city, Kyeonggi 487-711, Korea
Abstract
The study aimed to analyze the lifestyles, weight control behavior, dietary habits, and depression of female university students. The subjects were 532 students from 8 universities located in 4 provinces in Korea. According to percent ideal body weight, 33 (6.4%), 181 (34.0%), 283 (53.2%), 22 (4.1%) and 13 (2.5%) were severely underweight, underweight, normal, overweight and obese, respectively, based on self-reported height and weight. As much as 64.1% and only 2.4%, respectively, overestimated and underestimated their body weight status. Six overweight subjects were excluded from overestimation group for the purpose of this study, resulting in overestimation group consisting of only underweight and normal weight subjects. Compared to those from the normal perception group, significantly more subjects from the overestimation group were currently smoking (P = 0.017) and drank more often than once a week (P = 0.015), without any significant differences in dietary habits. Despite similar BMIs, subjects who overestimated their own weight statuses had significantly higher weight dissatisfaction (P = 0.000), obesity stress (P = 0.000), obsession to lose weight (P = 0.007) and depression (P = 0.018). Also, more of them wanted to lose weight (P = 0.000), checked their body weights more often than once a week (P = 0.025) and had dieting experiences using ‘reducing meal size’ (P = 0.012), ‘reducing snacks’ (P = 0.042) and ‘taking prescribed pills’ (P = 0.032), and presented ‘for a wider range of clothes selection’ as the reason for weight loss (P = 0.039), although none was actually overweight or obese. Unlike the case with overestimating one’s own weight, being overweight was associated with less drinking (P = 0.035) and exercising more often (P = 0.001) and for longer (P = 0.001) and healthier reasons for weight control (P = 0.002), despite no differences in frequency of weighing and depression. The results showed that weight overestimation, independent of weight status, is associated with risky lifestyles, weight control behaviors, and mental conditions. Preventive interventions should focus not only on obesity, but also on body weight overestimation.
Key Words: Overweight, misperception, weight control, depression, college students
Introduction8)
Overweight and obesity are known to increase mortality and morbidity related to a wide range of chronic diseases, including diabetes mellitus, cardiovascular diseases and, several cancers.
Serious psycho-social consequences, such as a negative self esteem, depression and high-risk behaviors are also associated to obesity [1,2].
Although obesity is a disease which should be treated, many are trying to lose weight which is not necessary. For example, approximately 46% of US college students from 1995 National College Health Risk Behavior Survey were currently trying to lose weight, while only 35% were overweight or obese [3]. This may result partly from the messages from the media and culture that being thin means being beautiful and successful. As a result, not only obesity and overweight but also excessive dieting to lose weight has become a focus of concern worldwide [4]. It is consistently shown that, while females are less likely than
males to be overweight, they are more likely to overestimate their weight, be dissatisfied with weight, and have attempted to lose weight [5]. According to the results of International Health
& Behaviors Study [6] with 18,512 university students, 51% of the females were currently on dieting compared to 25% of the males. Meanwhile, the portion who was currently on dieting was as much as 77% in Korean female students, which was the highest among males and females of all 22 countries that participated.
Unjustified weight dissatisfaction due to a distorted body image has been attributed to unnecessary attempts to lose weight, which are consequently associated with psychological malfunctions.
Among female university students, only 56.5% in the normal weight group thought to have normal weight, while as much as 42.0% thought to be fat, resulting in that more than half were unsatisfied with their weight and 79.5% had been on diet [7].
There are some studies suggesting “feeling fat” to be more important than “being fat” by showing that mental health indicators are more closely associated with the body weight perception
This work was supported by Daejin University Research Grant in 2010.
§Corresponding Author: Hongmie Lee, Tel. 82-31-539-1862, Fax. 82-31-539-1860, Email. [email protected] Received: August 29, 2010, Revised: December 7, 2010, Accepted: December 7, 2010
ⓒ2010 The Korean Nutrition Society and the Korean Society of Community Nutrition
This is an Open Access article distributed under the terms of the Creative Commons Attribution Non-Commercial License (http://creativecommons.org/licenses/by-nc/3.0/) which permits unrestricted non-commercial use, distribution, and reproduction in any medium, provided the original work is properly cited.
Subjective weight perception
Weight status Severe underweight
(below 80%)
Underweight (80-90%)
Normal (90-110%)
Overweight (110-120%)
Obese
(Above 120%) Total
Very thin 12 (36.4)a 6 (3.3)c - - -
Somewhat thin 18 (54.5)b 53 (29.3)a 3 (1.1)c - -
Normal 1 (3.0)b 101 (55.8)b 88 (31.1)a - -
Somewhat fat 2 (6.1)b 19 (10.5)b 179 (63.3)b 16 (72.7)a 4 (30.8)
Very fat - 2 (1.1)b 13 (4.6)b 6 (27.3)bd 9 (69.2)a
Total 33 (6.2) 181 (34.0) 283 (53.2) 22 (4.14) 13 (2.4) 532 (100)
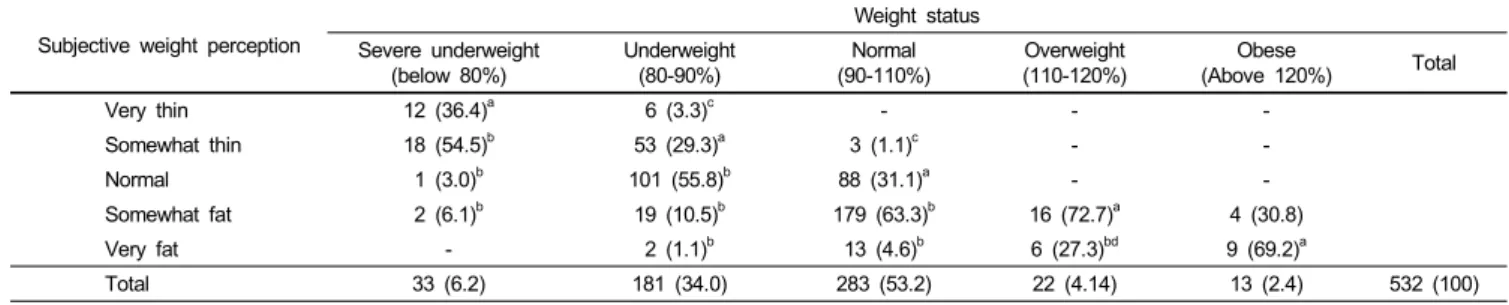
a178 (33.5%) of total 532 recognized own weight status correctly
b341 (64.1%) of total 532 overestimated own weight status
c13 (2.4%) of total 532 underestimated own weight status, all of whom were not included for further analysis
dSix subjects excluded from the statistics for the purpose of the study
Table 1. Distribution of weight status and weight perception (N : %)
rather than self-reported or measured weight statuses [8].
On the other hand, there were not many studies reporting the association of weight misperception, especially overestimation, with lifestyles, weight control behavior, dietary habits, and psychological factors on Korean females, to date. The studies on body image perception by gender [9] and BMI [10] were on adolescents. Early adulthood, such as the period attending university, is the life span in which one might take care of diet and health at the least throughout whole life, partly due to a newly obtained independency. Excessive dieting not only harms females’ own health now and later in life, but also may put the next generation’s health at risk, through fetal imprinting [11].
Therefore, lifestyles, dietary habits and weight loss behaviors, as well as psychological aspects, such as the obsession to weight loss, obesity stress and depression were compared in female university students, according to body weight perceptions as well as weight statuses.
Subjects and Methods
Study subjects
In September 2010, subjects consisting of 532 female students from 8 universities in Seoul, Gyungsang-do, Chungcheong-do, Jolla-do and Gyeonggi-do, Korea participated, after incomplete questionnaires were discarded.
Questionnaire development
A four-paged self-administered questionnaire was developed, consisting of 7 sections: general information including self-reported height and weight, dietary habits, lifestyles, obesity stress, obsession to lose weight, psychological statuses, and weight loss behaviors. Body image perception was determined by asking students to mark their own body shape as ‘very thin’, ‘somewhat thin’, ‘normal’, ‘somewhat fat’ and ‘very fat’. Dietary habits were determined by asking students to respond “often (6-7 days /week)”, “sometimes (3-5 days/week)” and “rarely (0-2 days /week)” to each dietary habits, which were encoded as 5, 3, and
1, respectively [12]. The negative dietary habits were encoded reversely. Questions on lifestyle were hours spent in watching TV and using the computer, smoking, drinking, and frequency and duration of exercise. Questions about weight control behaviors regarded weight satisfaction, weight standard, the method experienced to lose weight, dieting experience, reason and direction of weight control, and frequency of weighing.
Weight satisfaction was determined by asking students to mark
“satisfied very much”, “somewhat satisfied”, “average”, “somewhat dissatisfied”, and “dissatisfied very much”, of their own weight, which were encoded as 5, 4, 3, 2, and 1, respectively.
Obsession to lose weight was determined by eleven questions out of twenty-six items of the Eating Attitudes Test-26, which was developed as a diagnosing tool for eating disorders by Linda and Michael [13] and standardized by Won [14]. Subjects were asked to answer “never”, “rare”, “sometimes”, “often”, “very often” and “always”, which were encoded as 0 to 5, respectively.
Stress level from obesity was determined by 11 questions of the Body Attitudes Questionnaire-11, which were developed to diagnose obesity stress by Ben and Walker [15] and translated by Cho and Kim [16]. Subjects were asked to answer “strongly disagree”, “tend to disagree”, “average”, “tend to agree”,
“strongly agrees”, which were encoded as 0 to 4, respectively.
Beck Depression Inventory- Korean version (K-BDI) which was developed by Beck [17] and standardized after translation by Lee and Song [18] was used to determine the degree of depression.
Grouping into subgroups
Since body mass index categorizes weight status into only four groups, percent ideal body weight (PIBW) was used in this study to categorize weight perception as well as weight status. Table 1 summarizes the distribution of subjects according to five categories of weight status and five categories of body image perception. By using ideal body weight calculated with modified Broca method, PIBW were used to diagnose body weight into severe underweight (< 80%), underweight (80%-90%), normal (90%-110%), overweight (110-120), and obese (> 120%).
Characteristics according to weight status were compared between underweight (< 90%), normal weight (90%-110%), and
Variables
Weight status
P
Weight misperception Underweight P
(n = 208) Normalweight
(n = 280) Overweight
(n = 31) Correct perception
(n = 178) Overestimation (n = 335)
Age (yr) 20.71 ± 2.46 20.60 ± 2.58 20.13 ± 1.91 0.476 20.84 ± 2.65 20.52 ± 2.43 0.161
Height (cm) 162.21 ± 5.17 162.41 ± 4.77 161.94 ± 4.15 0.823 162.17 ± 4.43 162.33 ± 5.15 0.732
Weight (kg) 47.88 ± 3.83 55.43 ± 4.50 67.36 ± 6.72 0.000*** 52.94 ± 7.76 52.97 ± 5.92 0.970
Body mass index 18.18 ± 0.93 21.00 ± 1.16 25.70 ± 2.56 0.000*** 20.14 ± 2.91 20.08 ± 1.81 0.778
*** Significantly different at P < 0.001.
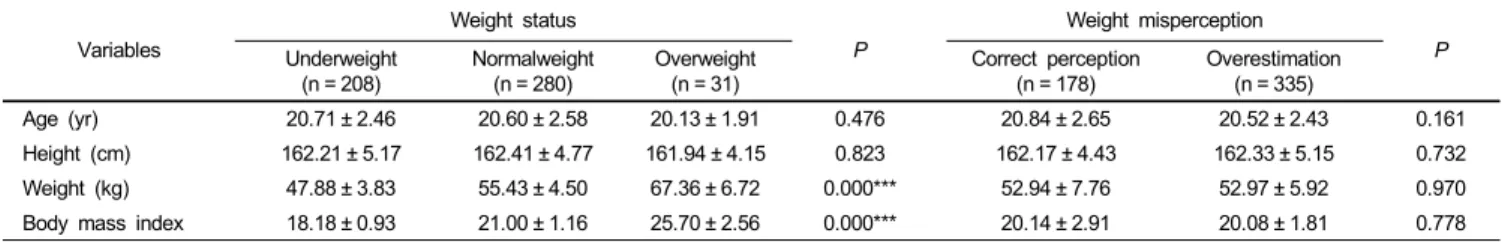
Table 2. Distribution of the subjects according to weight status and weight misperception
overweight (> 120%).
Subjects in the severe underweight, underweight, normal, overweight, and obese groups who perceived their weight as
“very thin” (n = 0), “somewhat thin” (n = 41), “normal” (n = 208), “somewhat fat” (n = 70) and “very fat” (n = 28), respe- ctively, were categorized as correct perception group. And characteristics of the correct perception group were compared to those of the overestimation group. The overestimation group categorizes subjects in the severely underweight group who perceived their own weight as ‘somewhat thin’ (n= 2), those in the underweight group who did as ‘normal’ (n = 15) and
‘somewhat fat’ (n = 1), those in normal weight group who did as ‘somewhat fat’ (n = 70) and ‘very fat’ (n = 7) and those in overweight group who did as ‘very fat’ (n = 10). Six subjects in the overestimation group who were overweight and all 13 subjects in the underestimation group were excluded from the further analysis due to the purpose of this study, which was to identify the characteristics of students who had distorted body image perception by overestimation without being overweight.
Therefore, the overestimation group consisted of non-overweight subjects, while the normal perception group consisted of all five weight categories.
Statistical analysis
The data were examined for significant associations using SPSS 18.0 K for Windows. The anthropometry, age, dietary habits, and psychological data were reported as mean ± standard deviation. The differences between overestimation group and correct perception group were analyzed for the statistical significance by Students’ t-test at P < 0.05. After the analysis of variance, the significances of the differences among three weight groups were tested using Duncan multiple range tests at P < 0.05. Distribution of grade and gender and weight control behaviors were reported as frequency (%), and significances of differences were analyzed using X2-test at P < 0.05.
Results
Distribution of weight status and misperception
Table 1 shows that 53.2% and 34.0% of the subjects belong to normal weight and underweight groups, respectively. As much
as 54.5% of the severely underweight group perceived their own weight as ‘somewhat thin’ and 3.0% and 6.1% did even as
‘normal’ and ‘overweight’. As a result, only 33.5% of the subjects in this study perceived their own weights in the correct weight group, while as much as 64.1% and as little as 2.4%
overestimated and underestimated own weight, respectively.
There were no significant differences in height, weight and BMI as well as age between groups according to weight misperception (Table 2).
Lifestyle
The overweight subjects had several desirable lifestyles, compared to those with normal weight: more of overweight group never drank (38.7% vs. 17.1%, respectively, P = 0.035);
exercised more frequently than once a week (51.6% vs. 2.4%, respectively, P = 0.001) and for longer than 30 minutes/time (74.2% vs. 52.9%, respectively, P = 0.000) (Table 3). Compared to correct perception group, more of the overestimation group drank more often than once a week (23% vs. 11.8%, respectively, P = 0.015) and were currently smoking (7.8% vs. 1.7%, respectively, P = 0.017).
Dietary habits
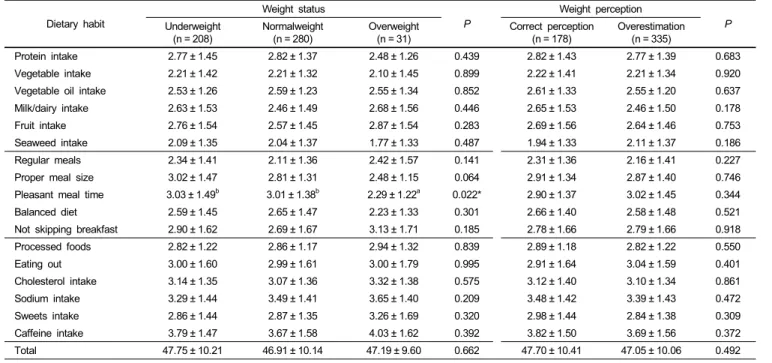
Table 4 shows that there were no significant differences in dietary habits between groups according to weight statuses as well as weight misperception, except for that overweight subjects had significantly lower score for “enjoying meals at pleasant atmosphere” than normal weight (2.29 vs. 3.01, respectively, P
= 0.022).
Weight control behaviors
Table 5 summarizes the weight control behaviors, obesity stress, and obsession to losing weight between subgroups.
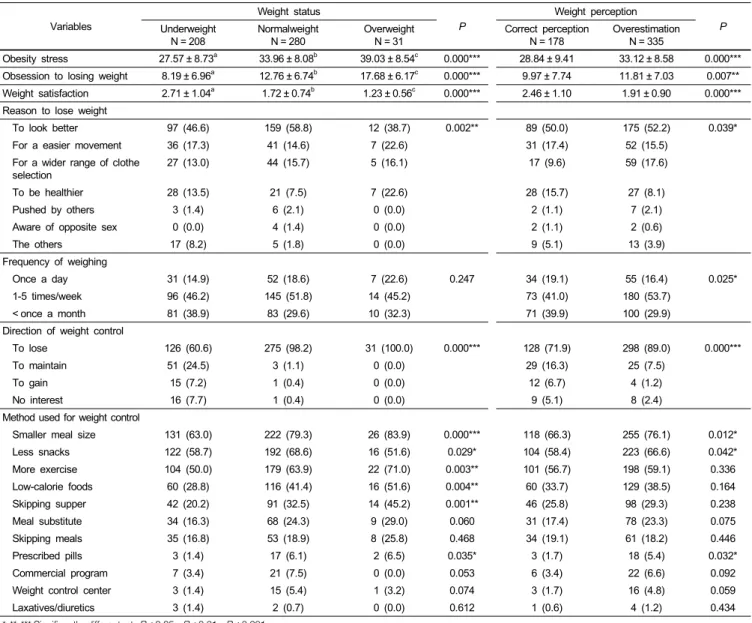
Compared to subjects with normal weight, significantly more overweight subjects had experiences of dieting through reducing meal size (83.9% vs. 79.3%, respectively, P = 0.000), increasing exercise (71.0% vs. 63.9%, respectively, P = 0.003), choosing lower-calorie foods (51.6% vs. 41.4%, respectively, P = 0.004), and skipping dinner (45.2% vs. 32.5%, respectively, P = 0.001)).
Overweight subjects had significantly lower weight satisfaction (1.23 vs. 1.72, respectively, P = 0.000) and higher obesity stress
Lifestyle
Weight status
P
Weight misperception Underweight P
(n = 208) Normalweight
(n = 280) Overweight
(n = 31) Correct perception
(n = 178) Overestimation (n = 335) Screen-viewing
< 1 hour 30 (14.4) 38 (13.6) 4 (12.9) 0.833 28 (15.7) 44 (13.1) 0.718
1-2 hours 79 (38.0) 99 (35.4) 9 (29.0) 62 (34.8) 122 (36.4)
> 2 hours 99 (47.6) 143 (51.1) 18 (58.1) 88 (49.4) 169 (50.4)
Drinking
Never 47 (22.6) 48 (17.1) 12 (38.7) 0.035* 45 (25.3) 59 (17.6) 0.015*
Sometimes 131 (63.0) 168 (60.0) 15 (48.4) 112 (62.9) 199 (59.4)
1-3 times/week 24 (11.5) 58 (20.7) 3 (9.7) 19 (10.7) 66 (19.7)
4-5 times/week 3 (1.4) 4 (1.4) 1 (3.2) 2 (1.1) 6 (1.8)
Everyday 3 (1.4) 2 (0.7) 0 (0.0) 0 (0) 5 (1.5)
Frequency of exercise
Never 79 (38.0) 64 (22.9) 3 (9.7) 0.001** 46 (25.8) 99 (29.6) 0.076
Sometimes 67 (32.2) 97 (34.6) 12 (38.7) 69 (38.8) 106 (31.6)
1-2 times/week 36 (17.3) 62 (22.1) 8 (25.8) 26 (14.6) 78 (23.3)
3-5 times/week 16 (7.7) 48 (17.1) 5 (16.1) 28 (15.7) 39 (11.6)
Everyday 10 (4.8) 9 (3.2) 3 (9.7) 9 (5.1) 13 (3.9)
Duration of exercise
< 30 min 135 (64.9) 132 (47.1) 8 (25.8) 0.000** 86 (48.3) 186 (55.1) 0.056
≧ 30 min 73(35.1) 148(52.9) 23(74.2) 92 (51.7) 147 (43.9)
Smoking
Never 187 (89.9) 247 (88.2) 29 (93.5) 0.574 166 (93.3) 291 (86.9) 0.017*
Past smoker 11 (5.3) 14 (5.0) 2 (6.5) 9 (5.1) 18 (5.4)
Current smoker 10 (4.8) 19 (6.8) 0 (0.0) 3 (1.7) 26 (7.8)
Table 3. Lifestyle by weight status and body image distortion N (%)
Dietary habit
Weight status
P
Weight perception Underweight P
(n = 208)
Normalweight (n = 280)
Overweight (n = 31)
Correct perception (n = 178)
Overestimation (n = 335)
Protein intake 2.77 ± 1.45 2.82 ± 1.37 2.48 ± 1.26 0.439 2.82 ± 1.43 2.77 ± 1.39 0.683
Vegetable intake 2.21 ± 1.42 2.21 ± 1.32 2.10 ± 1.45 0.899 2.22 ± 1.41 2.21 ± 1.34 0.920
Vegetable oil intake 2.53 ± 1.26 2.59 ± 1.23 2.55 ± 1.34 0.852 2.61 ± 1.33 2.55 ± 1.20 0.637
Milk/dairy intake 2.63 ± 1.53 2.46 ± 1.49 2.68 ± 1.56 0.446 2.65 ± 1.53 2.46 ± 1.50 0.178
Fruit intake 2.76 ± 1.54 2.57 ± 1.45 2.87 ± 1.54 0.283 2.69 ± 1.56 2.64 ± 1.46 0.753
Seaweed intake 2.09 ± 1.35 2.04 ± 1.37 1.77 ± 1.33 0.487 1.94 ± 1.33 2.11 ± 1.37 0.186
Regular meals 2.34 ± 1.41 2.11 ± 1.36 2.42 ± 1.57 0.141 2.31 ± 1.36 2.16 ± 1.41 0.227
Proper meal size 3.02 ± 1.47 2.81 ± 1.31 2.48 ± 1.15 0.064 2.91 ± 1.34 2.87 ± 1.40 0.746
Pleasant meal time 3.03 ± 1.49b 3.01 ± 1.38b 2.29 ± 1.22a 0.022* 2.90 ± 1.37 3.02 ± 1.45 0.344
Balanced diet 2.59 ± 1.45 2.65 ± 1.47 2.23 ± 1.33 0.301 2.66 ± 1.40 2.58 ± 1.48 0.521
Not skipping breakfast 2.90 ± 1.62 2.69 ± 1.67 3.13 ± 1.71 0.185 2.78 ± 1.66 2.79 ± 1.66 0.918
Processed foods 2.82 ± 1.22 2.86 ± 1.17 2.94 ± 1.32 0.839 2.89 ± 1.18 2.82 ± 1.22 0.550
Eating out 3.00 ± 1.60 2.99 ± 1.61 3.00 ± 1.79 0.995 2.91 ± 1.64 3.04 ± 1.59 0.401
Cholesterol intake 3.14 ± 1.35 3.07 ± 1.36 3.32 ± 1.38 0.575 3.12 ± 1.40 3.10 ± 1.34 0.861
Sodium intake 3.29 ± 1.44 3.49 ± 1.41 3.65 ± 1.40 0.209 3.48 ± 1.42 3.39 ± 1.43 0.472
Sweets intake 2.86 ± 1.44 2.87 ± 1.35 3.26 ± 1.69 0.320 2.98 ± 1.44 2.84 ± 1.38 0.309
Caffeine intake 3.79 ± 1.47 3.67 ± 1.58 4.03 ± 1.62 0.392 3.82 ± 1.50 3.69 ± 1.56 0.372
Total 47.75 ± 10.21 46.91 ± 10.14 47.19 ± 9.60 0.662 47.70 ± 10.41 47.05 ± 10.06 0.492
* Significantly different at P< 0.05.
Values with the different superscripts are significantly different at P< 0.05.
Table 4. Dietary habits according to weight status and weight misperception N (%)
(39.03 vs. 33.96, respectively P = 0.000) and obsession to lose weight (17.68 vs. 12.76, respectively, P = 0.000).
Despite similar BMIs, subjects who overestimated their own
weights had significantly lower weight satisfaction (1.91 vs. 2.46, respectively, P = 0.000), and higher obesity stress (33.12 vs.
28.84, respectively, P = 0.000) and obsession to lose weight
Variables
Weight status
P
Weight perception Underweight P
N = 208 Normalweight
N = 280 Overweight
N = 31 Correct perception
N = 178 Overestimation N = 335
Obesity stress 27.57 ± 8.73a 33.96 ± 8.08b 39.03 ± 8.54c 0.000*** 28.84 ± 9.41 33.12 ± 8.58 0.000***
Obsession to losing weight 8.19 ± 6.96a 12.76 ± 6.74b 17.68 ± 6.17c 0.000*** 9.97 ± 7.74 11.81 ± 7.03 0.007**
Weight satisfaction 2.71 ± 1.04a 1.72 ± 0.74b 1.23 ± 0.56c 0.000*** 2.46 ± 1.10 1.91 ± 0.90 0.000***
Reason to lose weight
To look better 97 (46.6) 159 (58.8) 12 (38.7) 0.002** 89 (50.0) 175 (52.2) 0.039*
For a easier movement 36 (17.3) 41 (14.6) 7 (22.6) 31 (17.4) 52 (15.5)
For a wider range of clothe
selection 27 (13.0) 44 (15.7) 5 (16.1) 17 (9.6) 59 (17.6)
To be healthier 28 (13.5) 21 (7.5) 7 (22.6) 28 (15.7) 27 (8.1)
Pushed by others 3 (1.4) 6 (2.1) 0 (0.0) 2 (1.1) 7 (2.1)
Aware of opposite sex 0 (0.0) 4 (1.4) 0 (0.0) 2 (1.1) 2 (0.6)
The others 17 (8.2) 5 (1.8) 0 (0.0) 9 (5.1) 13 (3.9)
Frequency of weighing
Once a day 31 (14.9) 52 (18.6) 7 (22.6) 0.247 34 (19.1) 55 (16.4) 0.025*
1-5 times/week 96 (46.2) 145 (51.8) 14 (45.2) 73 (41.0) 180 (53.7)
< once a month 81 (38.9) 83 (29.6) 10 (32.3) 71 (39.9) 100 (29.9)
Direction of weight control
To lose 126 (60.6) 275 (98.2) 31 (100.0) 0.000*** 128 (71.9) 298 (89.0) 0.000***
To maintain 51 (24.5) 3 (1.1) 0 (0.0) 29 (16.3) 25 (7.5)
To gain 15 (7.2) 1 (0.4) 0 (0.0) 12 (6.7) 4 (1.2)
No interest 16 (7.7) 1 (0.4) 0 (0.0) 9 (5.1) 8 (2.4)
Method used for weight control
Smaller meal size 131 (63.0) 222 (79.3) 26 (83.9) 0.000*** 118 (66.3) 255 (76.1) 0.012*
Less snacks 122 (58.7) 192 (68.6) 16 (51.6) 0.029* 104 (58.4) 223 (66.6) 0.042*
More exercise 104 (50.0) 179 (63.9) 22 (71.0) 0.003** 101 (56.7) 198 (59.1) 0.336
Low-calorie foods 60 (28.8) 116 (41.4) 16 (51.6) 0.004** 60 (33.7) 129 (38.5) 0.164
Skipping supper 42 (20.2) 91 (32.5) 14 (45.2) 0.001** 46 (25.8) 98 (29.3) 0.238
Meal substitute 34 (16.3) 68 (24.3) 9 (29.0) 0.060 31 (17.4) 78 (23.3) 0.075
Skipping meals 35 (16.8) 53 (18.9) 8 (25.8) 0.468 34 (19.1) 61 (18.2) 0.446
Prescribed pills 3 (1.4) 17 (6.1) 2 (6.5) 0.035* 3 (1.7) 18 (5.4) 0.032*
Commercial program 7 (3.4) 21 (7.5) 0 (0.0) 0.053 6 (3.4) 22 (6.6) 0.092
Weight control center 3 (1.4) 15 (5.4) 1 (3.2) 0.074 3 (1.7) 16 (4.8) 0.059
Laxatives/diuretics 3 (1.4) 2 (0.7) 0 (0.0) 0.612 1 (0.6) 4 (1.2) 0.434
*,**,*** Significantly different at P< 0.05, P< 0.01, P< 0.001.
Values with the different superscripts are significantly different at P< 0.05.
Table 5. Weight control behaviors, obesity stress, and obsession to losing weight N (%)
(11.81 vs. 9.97, respectively, P = 0.007). More of them wanted to lose weight (89.0% vs. 71.9%, respectively, P = 0.000), had dieting experiences using reducing meal size (76.1% vs. 66.3%, respectively, P = 0.012), reducing snacks (66.6% vs. 58.4%, respectively, P = 0.042) and taking prescribed pills (5.4% vs.
1.7%, respectively, P = 0.012) and presented “for a wider range of clothes selection for purchase” as the reason for weight loss (P = 0.039).
The most frequently answered reason to lose weight was “to look better for self-confidence” (51.6%) throughout all the groups, followed by “for the easier movement” (16.2%), “for a wider range of clothes selection for purchase” (16.1%), and
“to be healthier” (10.8%). Approximately, twice as more subjects who overestimated their own weight as those who perceive own weight status correctly presented “for a wider range of clothes
selection for purchase” as the main reason to lose weight (17.6%
vs. 9.6%, respectively), while only a half of them did “to be healthier” (8.1% vs. 15.1%, respectively) (P = 0.039). On the other hand, three times as more in the overweight group as the normal weight group answered that they wanted to lose weight mainly “to be healthier” (22.6% vs. 7.5%, respectively), while those answered to have “for a wider range of clothes selection for purchase” were not different according to weight status.
Compared to their counterparts, more of overestimation group checked their body weight more often than once a week (70.1%
vs. 60.1%, respectively, P = 0.025), but it was not the case of overweight subjects.
Depression
Weight status
P
Weight perception Underweight P
N = 208
Normal weight N = 280
Overweight N = 31
Correct perception N = 178
Overestimation N = 335
Sadness 0.29 ± 0.48 0.26 ± 0.50 0.29 ± 0.53 0.812 0.22 ± 0.43 0.30 ± 0.52 0.093
Desperation 0.40 ± 0.52 0.45 ± 0.54 0.45 ± 0.51 0.622 0.40 ± 0.49 0.45 ± 0.55 0.348
Loser 0.20 ± 0.53 0.31 ± 0.65 0.16 ± 0.45 0.076 0.17 ± 0.46 0.31 ± 0.66 0.009**
Dissatisfaction 0.62 ± 0.68 0.62 ± 0.71 0.55 ± 0.72 0.855 0.57 ± 0.70 0.64 ± 0.70 0.312
Guiltiness 0.20 ± 0.43 0.22 ± 0.46 0.39 ± 0.67 0.102 0.20 ± 0.46 0.23 ± 0.47 0.567
Punishment 0.27 ± 0.58 0.32 ± 0.59 0.32 ± 0.54 0.697 0.20 ± 0.46 0.35 ± 0.63 0.005**
Hatred 0.50 ± 0.61 0.55 ± 0.60 0.58 ± 0.56 0.616 0.44 ± 0.58 0.59 ± 0.61 0.010*
Misfortune 0.48 ± 0.59 0.53 ± 0.60 0.52 ± 0.57 0.641 0.46 ± 0.59 0.54 ± 0.60 0.136
Suicide 0.29 ± 0.52 0.29 ± 0.49 0.29 ± 0.53 1.000 0.30 ± 0.51 0.29 ± 0.50 0.811
Crying 0.24 ± 0.48 0.21 ± 0.53 0.29 ± 0.64 0.706 0.22 ± 0.49 0.23 ± 0.53 0.822
Annoyed 0.61 ± 0.73 0.56 ± 0.65 0.65 ± 0.80 0.683 0.56 ± 0.69 0.60 ± 0.69 0.525
Concern 0.50 ± 0.65 0.55 ± 0.66 0.65 ± 0.76 0.454 0.50 ± 0.65 0.56 ± 0.67 0.370
Decision-making 0.59 ± 0.66 0.57 ± 0.64 0.55 ± 0.57 0.926 0.52 ± 0.63 0.61 ± 0.65 0.149
Ugliness 0.46 ± 0.64 0.60 ± 0.79 0.68 ± 0.87 0.071 0.47 ± 0.73 0.59 ± 0.75 0.092
Work 0.37 ± 0.57 0.40 ± 0.60 0.58 ± 0.67 0.171 0.39 ± 0.62 0.40 ± 0.59 0.782
Sleep 0.28 ± 0.49 0.35 ± 0.63 0.35 ± 0.71 0.407 0.29 ± 0.53 0.35 ± 0.61 0.248
Fatigue 0.78 ± 0.64 0.75 ± 0.62 0.84 ± 0.64 0.682 0.69 ± 0.61 0.81 ± 0.64 0.049*
Sum 7.08 ± 5.44 7.55 ± 5.60 8.13 ± 6.21 0.489 6.61 ± 5.01 7.84 ± 5.83 0.018*
*,**,*** Significantly different at P< 0.05, P< 0.01 and P< 0.001.
Values with the different superscripts are significantly different at P< 0.05.
Table 6. Scores of depression by weight status and weight misperception N (%)
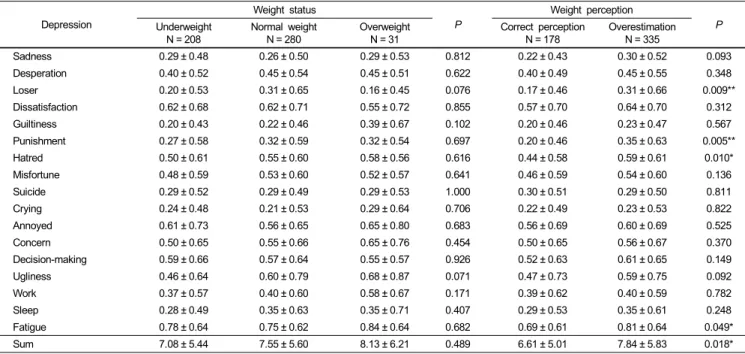
Depression degree by weight status and body image distortion Table 6 shows no significant differences in depression between weight status groups, while the overestimation group had a significantly higher score for “loser” (0.31 vs. 0.17, respectively, P = 0.009), “punishment” (0.35 vs. 0.20, respectively, P = 0.005),
“hatred” (0.59 vs. 0.44, respectively, P = 0.010), and “fatigue”
(0.81 vs. 0.69, respectively, P = 0.049) as well as the total depression score (0.31 vs. 0.17, respectively, P = 0.018).
Discussion
The most distinctive result of this study is that, despite of similar BMIs, overestimating one’s own weight showed a significantly higher weight dissatisfaction, obesity stress and obsession to weight loss, and even worse, higher depression level than being overweight did. Also overestimating was associated with unhealthy reason for and method of weight control, along with undesirable lifestyles, compared with those of the correct perception group.
It is notable to find several desirable aspects in the overweight female students in this study: better lifestyles and healthier reasons for losing weight compared to their counterpart. More subjects from the overweight group drank less than once a week and exercised more frequently and for a longer time, although in the previous study on female college students [19] reported no differences in exercise frequency and duration of exercise.
Most importantly, overweight subjects were less depressed than normal weight subjects, despite a higher weight dissatisfaction
as well as obsession and obesity stress. In fact, obesity stress and obsession to lose weight may be not only reasonable to have, but also may be necessary to achieve healthier weight. The significantly higher obsession to lose weight in overweight (13.36 vs. 11.70, respectively) as well as in the group who perceived themselves as “fat” (13.36 vs. 11.70, respectively) was also reported in the previous study with female university students in the Gunsan area [7]. On their review on the relation between obesity and body dissatisfaction, self esteem, and depression, they concluded that few among overweight and obese children and adolescents were significantly depressed, although they had a significantly higher body dissatisfaction than their normal-weight counterpart, consistent to the present study [1].
Only 33.5% of subjects in this study recognized their own body weight group correctly, which is lower than 44.8% reported from Male and female together in Iksan [20]. This higher tendency of girls to have distorted body image has been reported elsewhere [5].
The most frequently answered methods to lose weight in each group in this study were “reducing meal size” and “reducing snacking”, followed by “increasing exercise”, which is consistent to the previous studies [21,22], but inconsistent to the results in another study, in which more subjects answered “increasing exercise” than “reducing meal size” and “reducing snacking”
[19]. Dieting with only reducing caloric intake without exercise should be avoided since it may lead to worse psychological malfunctions due to failure to weight loss resulting from muscle loss. Programs to increase students’ awareness of healthy weight management methods should emphasize the importance of physical activity combined with a healthy diet. Considering that
nobody was overweight, it is surprising that as much as 5.4%
of the overestimation group experienced taking prescribed pills to lose weight. It is doubtful whether the prescription is currently made by a correct diagnosis of obesity.
The result that “to be healthier” is the 4th frequently answered main reason to lose weight is consistent to the previous studies, which found “external feature” is always more important than
“to be healthier” as the reason to lose weight [23,24], which is not the case in male students [19]. Reports [25] stating that people who answered that they want to lose weight “to look better” rather than “to be healthier” were more likely to use unhealthy methods for losing weight emphasize the importance of nutrition education regarding healthy weight.
The depression score of the subjects in this study was lower than the 15.2 reported in female high school girls [26], in which the overweight group had a significantly higher depression level than underweight and normal weight, which is inconsistent to the present study.
The number of subjects who overestimated their weight is twice as many as that of subjects who recognized their own body weight correctly (64.1% vs. 33.5%) in this study, similar to 65.0% and 31.5%, respectively in Iksan [20] and 62.2% and 35.8%, respectively in Gunsan [7], suggesting the urgency to educate female college students to have a correct perception of their weight. However, compared to this study, a lesser proportion of female college students overestimated their weight, in which 46.2% overestimated their weight while 51.9% recognized their weight statuses correctly in the previous study reported in 2006 [27].
There are some limitations in this study. First, the subjects’
weight and height were self-reported and not measured.
According to a previous study, self-reported heights and weight tended to be higher in underweight and normal weight, while higher height and lower weight in overweight group. Also, the percent ideal weight which was used to divide subjects into subgroups could misclassify people who carry more weight as fat-free mass. Given its cross-sectional design, we cannot reach causal conclusions that the overestimation of body weight is responsible for the undesirable lifestyles, weight dissatisfaction and psychological disturbances.
Conclusively, the results showed that weight overestimation may be more associated with unhealthy lifestyles, weight control behaviors and mental conditions, compared with being overweight. Preventive interventions should focus not only on obesity, but also on body weight misperception.
Acknowledgment
We thank Ms. Wanda Jin for her assistance in preparing the manuscript.
References
1. Wardle J, Cooke L. The impact of obesity on psychological well-being. Best Pract Res Clin Endocrinol Metab 2005;19:421-40.
2. French SA, Story M, Perry CL. Self-esteem and obesity in children and adolescents: A literature review. Obes Res 1995;3:479-90.
3. Lowry R, Galuska DA, Fulton JE, Wechsler H, Kann L, Collins JL. Physical activity, food choice, and weight management goals and practices among US college students. Am J Prev Med 2000;18:18-27.
4. French SA, Jeffery RW. Consequences of dieting to lose weight:
effects on physical and mental health. Health Psychol 1994;13:
195-212.
5. Lowry R, Galuska DA, Fulton JE, Wechsler H, Kann L. Weight management goals and practices among US high school students:
associations with physical activity, diet, and smoking. J Adolesc Health 2002;31:133-44.
6. Chosun Ilbo [Internet]. Seoul: c2010 [cited 2006 May 16].
Available from: http://health.chosun.com/site/data/html_dir/2006/
05/16/2006051656007.html.
7. Oh MY, Yu HH. Relation of body weight control and eating disorder of university students in the Gunsan area. Korean Journal of Community Nutrition 2007;12:724-41.
8. Jansen W, van de Looij-Jansen PM, de Wilde EJ, Brug J. Feeling fat rather than being fat may be associated with psychological well-being in young dutch adolescents. J Adolesc Health 2008;42:128-36.
9. Kim JH, Jung IK. A study on body image pereption and eating disorders by gender in junior high school students in Seoul.
Journal of the Korean Home Economics Association 2007;45:
101-9.
10. Lee HJ, Choi MR, Koo JO. A study of body image, weight control and dietary habits with different BMI in female high school students. Korean Journal of Community Nurition 2005;
10:805-13.
11. Fukuoka H. Maternal nutrition including fetal imprinting for future health and disease. Spring symposium. The Korean Nutrition Society; 2006. p.19-20.
12. Choi HM, Kim JH, Kim CI, Chang KJ, Min HS, Yim KS, Byun KW, Lee HM, Kim KW, Kim HS, Kim HA. Essentials of nutrition. 2nd edition. Paju: Kyomoonsa; 2006. p.392.
13. Smolak L, Levine MP. Psychometric properties of the children’s eating attitudes test. Int J Eat Disord 1994;16:275-82.
14. Won HR. A study of the relationship between the eating attitude influenced by eating disorder and body shape, nutritional knowledge among female college students in Won Ju province.
Korean Journal of Community Nutrition 1998;3:308-16.
15. Ben-Tovim DI, Walker MK. The influence of age and weight on women’s body attitudes as measured by the Body Attitudes Questionnaire (BAQ). J Psychosom Res 1994;38:477-81.
16. Cho SJ, Kim CK. The effect of female students’ obese level and weight control behavior and attitudes on stress. Journal of Korean Society for Health Education 1997;14:1-16.
17. Beck AT. Depression: Clinical, experimental and theoretical aspects. New York: Harper & Row; 1967.
18. Lee YH, Song JY. A study of the reliability and the validity of BDI, SDS, and MMPI-D scales. Korean Journal of Clinical Psychology 1991;10:98-113.
19. Ahn BRM, Park ES. Perception of body weight control, life
styles, and dietary habits according to the Obesity Index(OI) of female college students. Korean Journal of Human Ecology 2009;18:167-79.
20. Choi JG, Shin MK, Seo ES. A study on self-evaluated obesity and food habits by residence type of college students in Ik-san area. Korean Journal of Human Ecology 2004;13:97-110.
21. Jwa HJ, Chae IS. Body shape satisfaction, nutrition knowledge, dietary habits and weight control attitude of Korean high school students. Korean Journal of Food Culture 2008;23: 820-33.
22. Kim IS, Yu HH, Han HS. Effects of nutrition kowledge, dietary attitude, dietary habits and life style on the health of college students in the Chungnam area. Korean Journal of Community Nutrition 2002;7:45-57.
23. Ahn Y, Kim H, Kim K. A study of weight control and associated factors among high school female students. Korean Journal of
Community Nutrition 2005;10:814-24.
24. Kim BR, Han YB, Chang UJ. A study on the attitude toward weight control, diet behavior and food habits of college students.
Korean Journal of Community Nutrition 1997;2:530-8.
25. Hong YK, Park SB, Shin YS, Park H. Body image perception and self-reported weight control activities in adolescent girls.
Korean Journal of Family Medicine 1997;18:714-21.
26. Park JE, Kim SJ, Choue R. Study on stress, depression, binge eating, and food behavior of high school girls based on their BMI. Korean Journal of Community Nutrition 2009;14:175-81.
27. Jeon YS, Ahn HS. Influence of subjective perception of body image and weight management of obesity stress in college women.
Journal of the Korean Society of Esthetics & Cosmeceutics.
2006;1:13-26.