Cephalometric predictors of treatment outcome with mandibular advancement devices in adult patients with obstructive sleep apnea:
a systematic review
Objective: The efficacy of mandibular advancement devices (MADs) in the treatment of obstructive sleep apnea (OSA) ranges between 42% and 65%.
However, it is still unclear which predictive factors can be used to select suitable patients for MAD treatment. This study aimed to systematically review the literature on the predictive value of cephalometric analysis for MAD treatment outcomes in adult OSA patients. Methods: The MEDLINE, Google Scholar, Scopus, and Cochrane Library databases were searched through December 2014.
Reference lists from the retrieved publications were also examined. English language studies published in international peer-reviewed journals concerning the predictive value of cephalometric analysis for MAD treatment outcome were considered for inclusion. Two review authors independently assessed eli- gibility, extracted data, and ascertained the quality of the studies. Results:
Fifteen eligible studies were identified. Most of the skeletal, dental, and soft ti ssue cephalometric measurements examined were widely recognized as not prognostic for MAD treatment outcome; however, controversial and limited data were found on the predictive role of certain cephalometric measurements in- cluding cranial base angle, mandibular plane angle, hyoid to mandibular plane distance, posterior nasal spine to soft-palate tip distance, anterior nasal spine to epiglottis base distance, and tongue/oral cross sectional area ratio thus justifying additional studies on these parameters. Conclusions: Currently available evi dence is inadequate for identification of cephalometric parameters capable of reliably discriminating between poor and good responders to MAD treatment. To guide further research, methodological weaknesses of the currently available stu dies were highlighted and possible reasons for their discordant results were analyzed.
[Korean J Orthod 2015;45(6):308-321]
Key words: Obstructive sleep apnea, Cephalometry; Mandibular advancement Giulio Alessandri - Bonetti
aDaniela Rita Ippolito
bMaria Lavinia Bartolucci
cVincenzo D’Antò
c,dSerena Incerti-Parenti
aa
Unit of Orthodontics, Department of Biomedical and Neuromotor Sciences, University of Bologna, Bologna, Italy
b
Department of Orthodontics, University of Brescia, Brescia, Italy
c
Department of Neuroscience, Reproductive Science and Oral Science, University of Naples “Federico II”, Naples, Italy
d
Department of Pediatric Surgery, Bambino Gesù Children’s Hospital, Rome, Italy
Received February 25, 2015; Revised April 15, 2015; Accepted May 6, 2015.
Corresponding author: Giulio Alessandri-Bonetti.
Aggregate Professor, Unit of Orthodontics, Department of Biomedical and Neuromotor Sciences (DIBINEM), University of Bologna, Via San Vitale 59, Bologna 40125, Italy.
Tel +39-0512088133 e-mail [email protected]
© 2015 The Korean Association of Orthodontists.
The authors report no commercial, proprietary, or financial interest in the products or companies described in this article.
This is an Open Access article distributed under the terms of the Creative Commons Attribution Non-Commercial License (http://creativecommons.org/licenses/by-nc/4.0) which permits unrestricted non-commercial use, distribution, and reproduction in any medium, provided the original work is properly cited.
pISSN 2234-7518 • eISSN 2005-372X
http://dx.doi.org/10.4041/kjod.2015.45.6.308
INTRODUCTION
Obstructive sleep apnea (OSA) is characterized by repe- titive episodes of complete or partial closure of the upper airway during sleep that lead to sleep fragmentation and oxygen desaturation.
1This sleep-related breathing disorder is associated with daytime sleepiness, impaired quality of life, poor work performance, neurocognitive decline, increased risk of motor vehicle accidents and, in the long term, an increased risk of cardio-vascular disease and mortality.
2Nasal continuous positive airway pressure (nCPAP) maintains a positive pressure in the upper airway through a nose mask worn during sleep and is currently the most effective treatment option for OSA patients.
3Nevertheless, adherence to this therapy is low, with rates between 60% and 80%. The availability of alternative treatment options is therefore of the ut- most importance.
4Mandibular advancement devices (MADs), which hold the mandible forward with the aim of preventing collapse of the upper airway during sleep provide a less invasive, more comfortable, and less costly treatment alternative for patients with mild to moderate OSA who do not tolerate, do not respond to, or are not appropriate candidates for treatment with nCPAP, or those who fail behavioral measures such as weight loss or sleep position change. MADs can also be used in pa- tients with severe OSA who fail treatment attempts with nCPAP or who are not appropriate candidates for upper airway surgery.
5,6Patients undergo a repeat sleep study with MAD in situ to determine its effectiveness, which usually ran- ges between 42% and 65%.
7Clinical prediction of MAD treatment outcome would allow advanced selection of suitable candidates for this treatment before manu- facturing the device, thus avoiding inappropriate delays in therapy and waste of resources. Accordingly, this topic has been defined by the American Academy of Sleep Medicine as an important area for future research.
5,6Previous studies have suggested that lateral cepha- lometry can identify craniofacial characteristics that could have an impact on treatment response.
5,8-10Cepha- lometry is a low-cost, simple, and widely available radio graphic technique, and it is therefore suitable as a screen ing procedure. Nevertheless, the clinical utility of cephalometric measurements in the prediction of MAD treatment outcomes in OSA remains controversial.
A recently published review by Saffer et al.
11found no clear predictors of MAD treatment success. However, cephalometric and anatomical factors were not inves- tigated because no randomized controlled trials add- ressing this issue were included in the review. The aim of this study was to fill this gap by conducting a systematic review of published studies examining the ability of cephalometric parameters to predict MAD treatment
response in adult patients with OSA.
MATERIALS AND METHODS
Search strategy
An electronic literature search was carried out on the following databases: MEDLINE, Google Scholar, Scopus, and the Cochrane Library. To identify the rele- vant studies the following search terms were used:
“obstructive sleep" AND (apnea OR apnoea) AND (predict* OR outcome OR effect OR efficacy) AND (“oral appliance" OR “mandibular advancement device" OR
“mandibular repositioning appliance") AND (craniofacial OR skeletal OR cephalometr*). The reference lists of all relevant publications were checked for additional studies. Searches were updated to December 2014.
Screening and study selection
In the first phase of selection, duplicates were removed and irrelevant articles were excluded by reviewing the titles and abstracts from the search results. In the next phase, the full texts of potentially relevant papers were evaluated to determine if they met the eligibility criteria.
The inclusion criteria were:
• Type of study: Randomized or non-randomized controlled trials, cohort or case-control studies (with a minimum sample size of 10 patients in each group) addressing the research question of the predictive value of cephalometric analysis in oral appliance treatment outcomes in adult OSA patients. Studies had to be published in English in an international peer-reviewed literature
• Population: Male or female adult patients (≥ 18 years old) with a polysomnographic diagnosis of OSA (i.e., 5 or more respiratory events [apneas or hypopneas] per hour of sleep)
• Intervention: Treatment with any MAD for OSA The exclusion criteria were:
• Lack of a clear description of inclusion/exclusion criteria
• Previous and/or current surgical or pharmacological interventions
• Limitation to severe OSA patients
Two reviewers (DRI, SIP) independently screened paper titles and abstracts, with access to full texts where necessary to select studies into the review. Disagreements were resolved by discussion. Where resolution was not possible, a third reviewer (GAB) was consulted. The selected studies underwent data extraction and quality assessment.
Data extraction and quality assessment of selected studies
Two review authors (DRI, SIP) independently performed
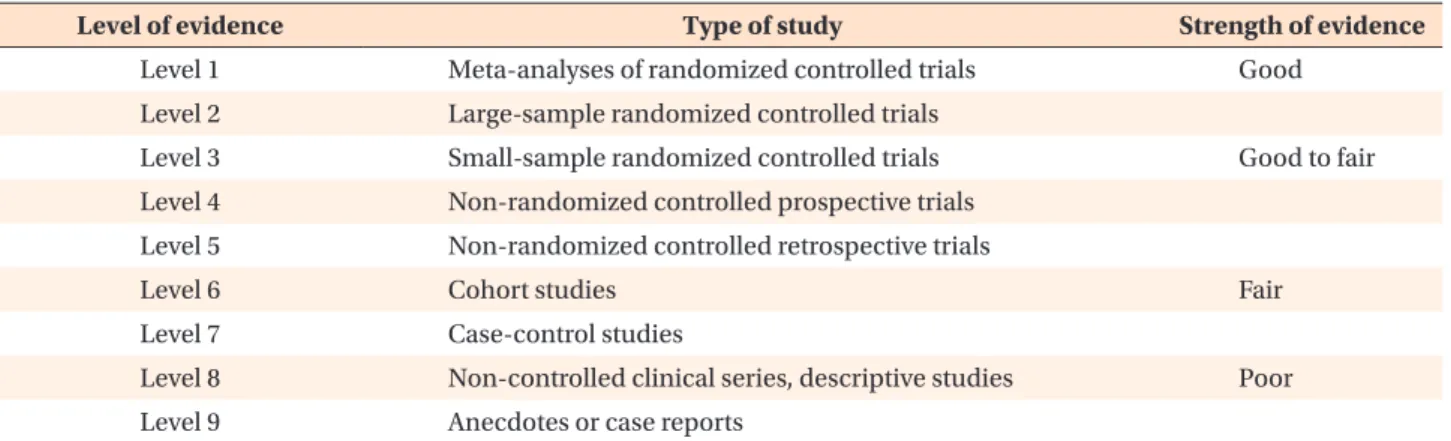
the data extraction. Extracted data included: first author, year of publication, study design, sample size, patient demographic and clinical characteristics, MAD type, degree of protrusion and vertical opening, time interval between polysomnographic evaluations, outcome (i.e., cephalometric parameters that differed significantly between good and poor responders). Selected studies were assigned to a class of evidence according to the cla ssification of study designs by Jovell and Navarro- Rubio (Table 1).
12Data synthesis
A narrative synthesis was carried out. Data were sorted according to MAD type (1-piece or 2-piece appliances).
Given the lack of homogeneity in the study settings, a quantitative synthesis seemed inappropriate. Therefore no meta-analysis was performed.
RESULTS
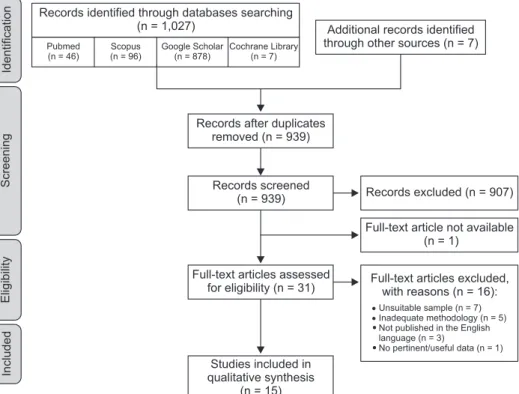
The electronic database search and the review of the relevant publication reference lists yielded 939 po- tentially relevant titles and abstracts after duplicates were removed from a total of 1,034 records. Following the first phase of evaluation, 907 publications were re- jected based on the title and the abstract. One further study was excluded because full text was not obtained by searching paper and digital format sources, nor after attempting to contact the authors by e-mail corres- pondence.
13In the second phase, analysis of the full text of the remaining 31 studies led to the exclusion of 16 additional publications. Fifteen studies were there- fore selected for the systematic review.
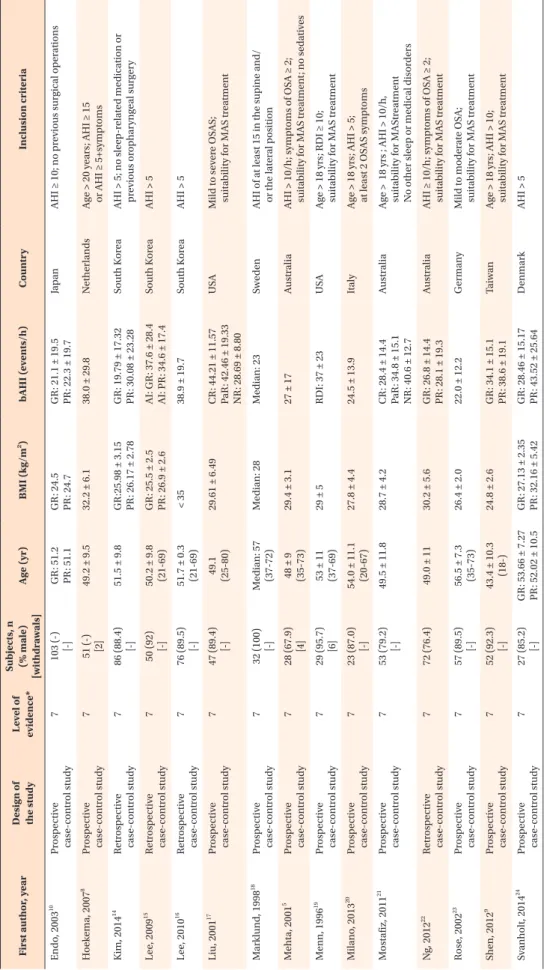
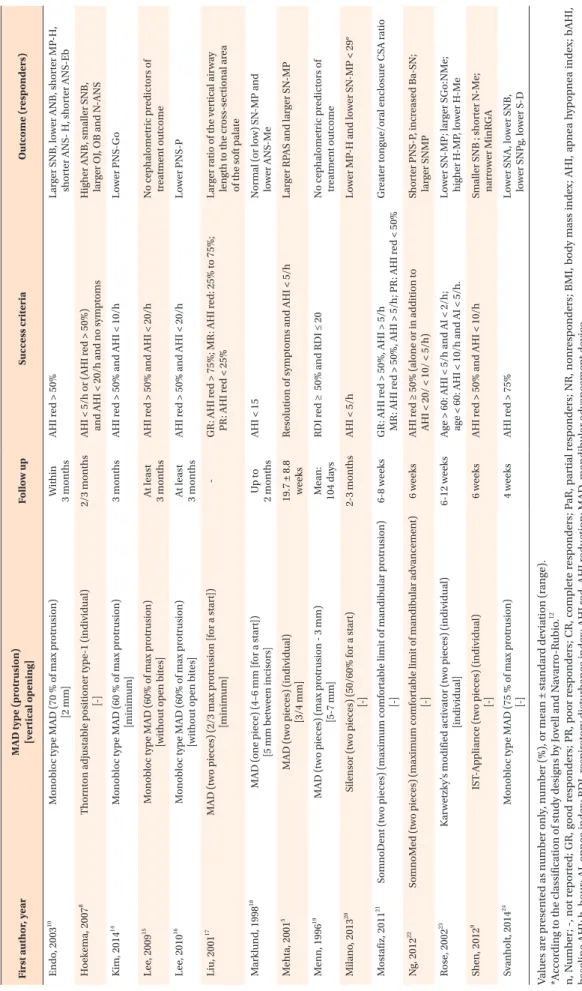
5,8-10,14-24The relevant data from each study are reported in Table 2.
The PRISMA flow diagram (Figure 1) shows the number of articles reviewed in each phase of this systematic review.
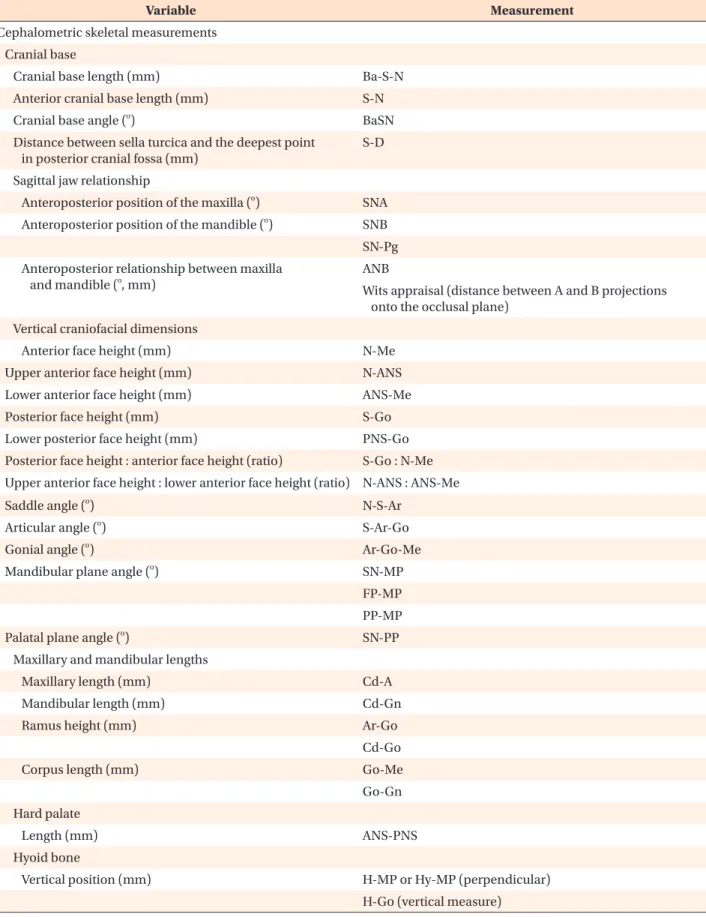
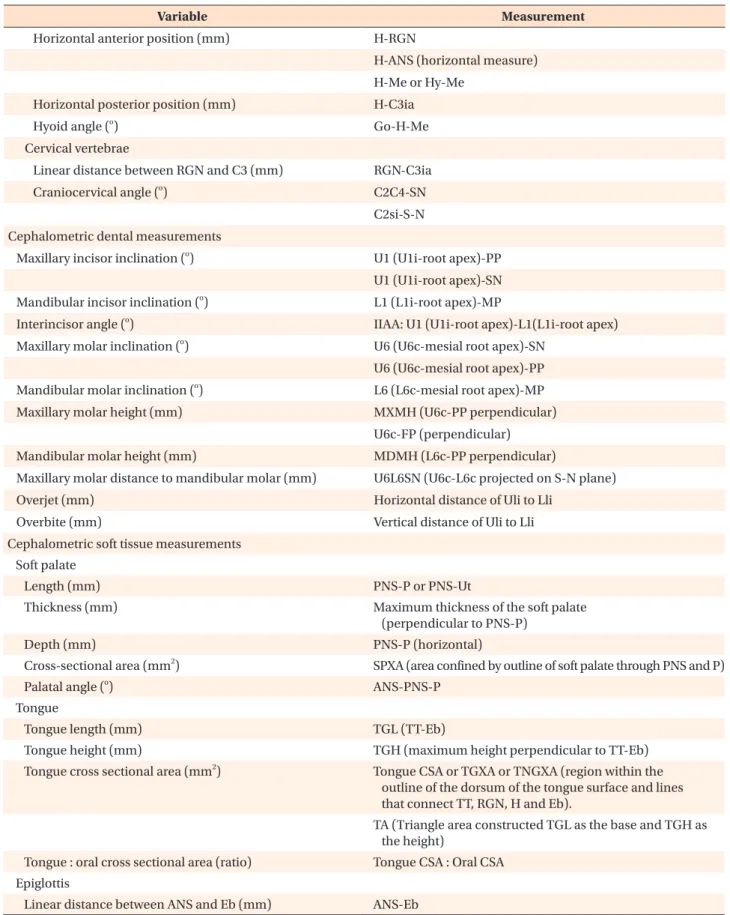
25Cephalometric variables that were analyzed in the
selected studies are listed in Table 3. The landmarks and reference lines necessary to define these parameters are shown in Figure 2.
Cephalometric skeletal measurements Cranial base
• 1-piece MAD: Svanholt et al.
24found that the distance between the sella turcica and the deepest point in the posterior cranial fossa was lower in the group that responded positively to MAD therapy.
• 2-piece MAD: Both cranial base and anterior cranial base lengths were reported to be non-predictive of MAD treatment outcome.
5,8,22Two studies addressed the predictive value of cranial base angle with con- trasting results; one found an increased cranial base angulation to be predictive of MAD treatment su- ccess
22and the other did not.
5Sagittal jaw relationship
• 1-piece MAD: Data concerning sagittal jaw rela- tionship were controversial. SNA and ANB were recognized either as predictive of treatment success when decreased
10,24or as non-predictive
10,14,18of treatment outcome. SNB was found to be non-pre- dictive
14,18or predictive of treatment success when increased10 or decreased.
24• 2-piece MAD: The majority of papers indicated that sagittal jaw relationship cephalometric parameters were not suitable for predicting treatment outcome (SNA,
5,8,9,19-22SNB,
5,19-22ANB,
5,17,20-22Wits appraisal
20).
However, a decreased SNB value
8,9or an increased ANB value
8were occasionally reported as predictive of treatment success.
Vertical craniofacial dimensions
• 1-piece MAD: Vertical craniofacial dimension para- meters were usually recognized as non-predictive of
Table 1. Levels of scientific evidence
Level of evidence Type of study Strength of evidence
Level 1 Meta-analyses of randomized controlled trials Good
Level 2 Large-sample randomized controlled trials
Level 3 Small-sample randomized controlled trials Good to fair
Level 4 Non-randomized controlled prospective trials Level 5 Non-randomized controlled retrospective trials
Level 6 Cohort studies Fair
Level 7 Case-control studies
Level 8 Non-controlled clinical series, descriptive studies Poor
Level 9 Anecdotes or case reports
Derived from Jovell and Navarro-Rubio.
12Svanholt, 201424
Shen, 20129
Rose, 200223
Ng, 201222
Mostafiz, 201121
Milano, 201320
Menn, 199619
Mehta, 20015
Marklund, 199818
Liu, 200117
Lee, 201016
Lee, 200915
Kim, 201414
Hoekema, 20078
Endo, 200310
First author, year Prospective case-control study
Prospective case-control study Prospective case-control study Retrospective case-control study Prospective case-control study Prospective case-control study Prospective case-control study Prospective case-control study Prospective case-control study Prospective case-control study Retrospective case-control study Retrospective case-control study Retrospective case-control study Prospective case-control study Prospective case-control study
Design of the study 777777777777777
Level of evidence* 27 (85.2) [-]
52 (92.3) [-]
57 (89.5) [-]
72 (76.4)
53 (79.2) [-]
23 (87.0) [-]
29 (95.7) [6]
28 (67.9) [4]
32 (100) [-]
47 (89.4) [-]
76 (89.5) [-]
50 (92) [-]
86 (88.4) [-]
51 (-) [2]
103 (-) [-]
Subjects, n (% male) [withdrawals] GR: 53.66 ± 7.27 PR: 52.02 ± 10.543.4 ± 10.3 (18-)
56.5 ± 7.3 (35-73)
49.0 ± 11
49.5 ± 11.8
54.0 ± 11.1 (20-67) 53 ± 11 (37-69) 48 ± 9 (35-73) Median: 57 (37-72) 49.1 (25-80) 51.7 ± 0.3 (21-69) 50.2 ± 9.8 (21-69)
51.5 ± 9.8
49.2 ± 9.5
GR: 51.2 PR: 51.1
Age (yr) GR: 27.13 ± 2.35 PR: 32.16 ± 5.42
24.8 ± 2.6
26.4 ± 2.0
30.2 ± 5.6
28.7 ± 4.2
27.8 ± 4.4
29 ± 5
29.4 ± 3.1
Median: 28
29.61 ± 6.49
< 35
GR: 25.5 ± 2.5 PR: 26.9 ± 2.6 GR:25.98 ± 3.15 PR: 26.17 ± 2.78
32.2 ± 6.1
GR: 24.5 PR: 24.7
BMI (kg/m2) GR: 28.46 ± 15.17 PR: 43.52 ± 25.64
GR: 34.1 ± 15.1 PR: 38.6 ± 19.1
22.0 ± 12.2
GR: 26.8 ± 14.4 PR: 28.1 ± 19.3 CR: 28.4 ± 14.4 PaR: 34.8 ± 15.1 NR: 40.6 ± 12.7
24.5 ± 13.9
RDI: 37 ± 23
27 ± 17
Median: 23
CR: 44.21 ± 11.57 PaR: 42.46 ± 19.33 NR: 28.69 ± 8.80
38.9 ± 19.7
AI: GR: 37.6 ± 28.4 AI: PR: 34.6 ± 17.4 GR: 19.79 ± 17.32 PR: 30.08 ± 23.28
38.0 ± 29.8
GR: 21.1 ± 19.5 PR: 22.3 ± 19.7
bAHI (events/h) Denmark
Taiwan
Germany
Australia
Australia
Italy
USA
Australia
Sweden
USA
South Korea
South Korea
South Korea
Netherlands
Japan
Country AHI > 5Age > 18 yrs; AHI > 10; suitability for MAS treatment
Mild to moderate OSA; suitability for MAS treatment AHI ≥ 10/h; symptoms of OSA ≥ 2; suitability for MAS treatment Age > 18 yrs ; AHI > 10/h, suitability for MAStreatment No other sleep or medical disorders Age > 18 yrs; AHI > 5; at least 2 OSAS symptoms Age > 18 yrs; RDI ≥ 10; suitability for MAS treatment AHI > 10/h; symptoms of OSA ≥ 2; suitability for MAS treatment; no sedatives AHI of at least 15 in the supine and/ or the lateral position Mild to severe OSAS; suitability for MAS treatment
AHI > 5
AHI > 5
AHI > 5; no sleep-related medication or previous oropharyngeal surgery Age > 20 years; AHI ≥ 15 or AHI ≥ 5+symptoms
AHI ≥ 10; no previous surgical operations
Inclusion criteria
Table 2. Summary of the main char acteristics of the 15 studies selected for the systematic r eview
Svanholt, 201424
Shen, 20129
Rose, 200223
Ng, 201222
Mostafiz, 201121
Milano, 201320
Menn, 199619
Mehta, 20015
Marklund, 199818
Liu, 200117
Lee, 201016
Lee, 200915
Kim, 201414
Hoekema, 20078
Endo, 200310
First author, year Monobloc type MAD (75 % of max protrusion) [-]
IST-Appliance (two pieces) (individual) [-]
Karwetzky’s modified activator (two pieces) (individual) [individual]
SomnoMed (two pieces) (maximum comfortable limit of mandibular advancement) [-]
SomnoDent (two pieces) (maximum comfortable limit of mandibular protrusion) [-]
Silensor (two pieces) (50/60% for a start) [-]
MAD (two pieces) (max protrusion - 3 mm) [5-7 mm]
MAD (two pieces) (individual) [3/4 mm]
MAD (one piece) (4–6 mm [for a start]) [5 mm between incisors]
MAD (two pieces) (2/3 max protrusion [for a start]) [minimum]
Monobloc type MAD (60% of max protrusion) [without open bites]
Monobloc type MAD (60% of max protrusion) [without open bites]
Monobloc type MAD (60 % of max protrusion) [minimum]
Thornton adjustable positioner type-1 (individual) [-]
Monobloc type MAD (70 % of max protrusion) [2 mm]
MAD type (protrusion) [vertical opening] 4 weeks
6 weeks
6-12 weeks
6 weeks
6-8 weeks
2-3 months
Mean: 104 days 19.7 ± 8.8 weeks Up to 2 months
-
At least 3 months At least 3 months
3 months
2/3 months
Within 3 months
Follow up AHI red > 75%
AHI red > 50% and AHI < 10/h
Age > 60: AHI < 5/h and AI < 2/h; age < 60: AHI < 10/h and AI < 5/h.
AHI red ≥ 50% (alone or in addition to AHI < 20/ < 10/ < 5/h) GR: AHI red > 50%, AHI > 5/h MR: AHI red > 50%, AHI > 5/h; PR: AHI red < 50%
AHI < 5/h
RDI red ≥ 50% and RDI ≤ 20
Resolution of symptoms and AHI < 5/h
AHI < 15
GR: AHI red > 75%; MR: AHI red: 25% to 75%; PR: AHI red < 25%
AHI red > 50% and AHI < 20/h
AHI red > 50% and AHI < 20/h
AHI red > 50% and AHI < 10/h
AHI < 5/h or (AHI red > 50%) and AHI < 20/h and no symptoms
AHI red > 50%
Success criteria Lower SNA, lower SNB, lower SNPg, lower S-D
Smaller SNB ; shorter N-Me; narrower MinRGA Lower SN-MP; larger SGo:NMe; higher H-MP, lower H-Me Shorter PNS-P, increased Ba-SN; larger SNMP
Greater tongue/oral enclosure CSA ratio
Lower MP-H and lower SN-MP < 29°
No cephalometric predictors of treatment outcome
Larger RPAS and larger SN-MP
Normal (or low) SN-MP and lower ANS-Me Larger ratio of the vertical airway length to the cross-sectional area of the soft palate
Lower PNS-P
No cephalometric predictors of treatment outcome
Lower PNS-Go
Higher ANB, smaller SNB, larger OJ, OB and N-ANS Larger SNB, lower ANB, shorter MP-H, shorter ANS- H, shorter ANS-Eb
Outcome (responders)
V alues ar e pr es en te d as n um b er onl y, n um b er (%), or me an ± s tand ar d de vi ation (r an ge). *A ccor din g t o the c las sific ation of s tud y des ig ns b y J ov ell and N av ar ro-R ubio .
12n, N um b er ; -, not r ep or te d; GR , g oo d r es p onder s; P R , p oor r es p onder s; CR , com plet e r es p onder s; P aR , p ar ti al r es p onder s; NR , nonr es p onder s; B MI, b od y m as s index ; AHI, a pne a h yp opne a index ; bAHI, b as eline AHI; h , ho ur ; AI, a pne a index ; RDI, r es pir at or y dis tur b ance index ; AHI r ed, AHI r eduction; MAD , m andib ul ar adv ancemen t de vice . Suita bilit y for MAD tr ea tmen t, g oo d den tal he alth , > 10 t eeth/den tal ar ch , no p er io don tal dis eas e, TM J d ysfunction or exa gg er at ed g ag r eflex . Se e T able 3 for the definition of ceph alometr ic v ar ia bles .
Table 2. Continued
treatment outcome,
14,24with the exception of lower anterior face height,
18lower posterior face height,
14and mandibular plane angle,
18which were occasionally identified as predictive of treatment success when decreased.
• 2-piece MAD: Saddle angle, articular angle, gonial angle, palatal plane angle, posterior face height, and the ratio between upper anterior face height and lower anterior face height were not useful for predicting MAD treatment outcomes.
9,20-23The majority of the papers ascribed a non-predictive role to anterior face height, upper anterior face height, lower anterior face height, and the ratio between posterior face height and anterior face height, but a lower anterior face height value
9as well as higher values of upper anterior face hei- ght
8and of the ratio of posterior face height to anterior face height
23were also occasionally found in good responders. Data on the predictive role of mandibular plane angle were conflicting: 3 out of 7 studies found it to be non-predictive of treatment outcomes,
8,9,212 studies indicated an increased value as a predictor of treatment success,
5,22and 2 studies reported a decreased value as a predictor of treatment success.
20,23Maxillary and mandibular lengths
• 1-piece MAD: Endo et al.
10found that maxillary and mandibular lengths were not predictive of MAD
treatment outcome.
• 2-piece MAD: There was general agreement that maxillary and mandibular lengths, ramus height, and corpus length were not suitable for prediction of MAD treatment outcome.
5,17,20-22Hard palate
• 1-piece MAD: Hard palate length did not appear to be predictive of MAD treatment outcome.
10,16• 2-piece MAD: Ng et al.
22claimed that hard palate length was not predictive of MAD treatment out- come.
Hyoid bone
• 1-piece MAD: Endo et al.
10found decreased values of MP-H, H-Me, and ANS-H to be predictive of MAD treatment success, whereas Kim et al.
14supported a non-predictive role of H-Me and ANS-H.
• 2-piece MAD: There was general agreement that H-RGN, C3ia-H, H-Go, Go-H-Me were not suitable for predicting MAD treatment outcomes.
9,17,20,21Rose et al.
23found that decreases in H-Me and ANS-H were predictive of treatment success, while Hoekema et al.
8did not. Data on MP-H were conflicting. Five out of 7 studies found it to be non-predictive,
5,8,9,19,21while the two others reported that decreased MP-H
20and increased MP-H
23were predictive of treatment success.
Figure 1. Flow chart of lite- rature search and study selec- tion.
Identification Screening Eligibility Included
Records identified through databases searching (n = 1,027)
Pubmed (n = 46)
Scopus (n = 96)
Google Scholar (n = 878)
Cochrane Library (n = 7)
Additional records identified through other sources (n = 7)
Records after duplicates removed (n = 939)
Records screened (n = 939)
Full-text articles assessed for eligibility (n = 31)
Studies included in qualitative synthesis
(n = 15)
Records excluded (n = 907)
Full-text article not available (n = 1)
Full-text articles excluded, with reasons (n = 16):
Unsuitable sample (n = 7) Inadequate methodology (n = 5) Not published in the English language (n = 3)
No pertinent/useful data (n = 1)
Table 3. Summary of cephalometric variables
Variable Measurement
Cephalometric skeletal measurements Cranial base
Cranial base length (mm) Ba-S-N
Anterior cranial base length (mm) S-N
Cranial base angle (
o) BaSN
Distance between sella turcica and the deepest point in posterior cranial fossa (mm)
S-D
Sagittal jaw relationship
Anteroposterior position of the maxilla (
o) SNA Anteroposterior position of the mandible (
o) SNB SN-Pg Anteroposterior relationship between maxilla
and mandible (
o, mm)
ANB
Wits appraisal (distance between A and B projections onto the occlusal plane)
Vertical craniofacial dimensions
Anterior face height (mm) N-Me
Upper anterior face height (mm) N-ANS
Lower anterior face height (mm) ANS-Me
Posterior face height (mm) S-Go
Lower posterior face height (mm) PNS-Go
Posterior face height : anterior face height (ratio) S-Go : N-Me Upper anterior face height : lower anterior face height (ratio) N-ANS : ANS-Me
Saddle angle (
o) N-S-Ar
Articular angle (
o) S-Ar-Go
Gonial angle (
o) Ar-Go-Me
Mandibular plane angle (
o) SN-MP
FP-MP PP-MP
Palatal plane angle (
o) SN-PP
Maxillary and mandibular lengths
Maxillary length (mm) Cd-A
Mandibular length (mm) Cd-Gn
Ramus height (mm) Ar-Go
Cd-Go
Corpus length (mm) Go-Me
Go-Gn Hard palate
Length (mm) ANS-PNS
Hyoid bone
Vertical position (mm) H-MP or Hy-MP (perpendicular)
H-Go (vertical measure)
Table 3. Continued
Variable Measurement
Horizontal anterior position (mm) H-RGN
H-ANS (horizontal measure) H-Me or Hy-Me
Horizontal posterior position (mm) H-C3ia
Hyoid angle (
o) Go-H-Me
Cervical vertebrae
Linear distance between RGN and C3 (mm) RGN-C3ia
Craniocervical angle (
o) C2C4-SN
C2si-S-N Cephalometric dental measurements
Maxillary incisor inclination (
o) U1 (U1i-root apex)-PP U1 (U1i-root apex)-SN Mandibular incisor inclination (
o) L1 (L1i-root apex)-MP
Interincisor angle (
o) IIAA: U1 (U1i-root apex)-L1(L1i-root apex) Maxillary molar inclination (
o) U6 (U6c-mesial root apex)-SN
U6 (U6c-mesial root apex)-PP Mandibular molar inclination (
o) L6 (L6c-mesial root apex)-MP
Maxillary molar height (mm) MXMH (U6c-PP perpendicular)
U6c-FP (perpendicular)
Mandibular molar height (mm) MDMH (L6c-PP perpendicular)
Maxillary molar distance to mandibular molar (mm) U6L6SN (U6c-L6c projected on S-N plane)
Overjet (mm) Horizontal distance of Uli to Lli
Overbite (mm) Vertical distance of Uli to Lli
Cephalometric soft tissue measurements Soft palate
Length (mm) PNS-P or PNS-Ut
Thickness (mm) Maximum thickness of the soft palate
(perpendicular to PNS-P)
Depth (mm) PNS-P (horizontal)
Cross-sectional area (mm
2) SPXA (area confined by outline of soft palate through PNS and P)
Palatal angle (
o) ANS-PNS-P
Tongue
Tongue length (mm) TGL (TT-Eb)
Tongue height (mm) TGH (maximum height perpendicular to TT-Eb)
Tongue cross sectional area (mm
2) Tongue CSA or TGXA or TNGXA (region within the outline of the dorsum of the tongue surface and lines that connect TT, RGN, H and Eb).
TA (Triangle area constructed TGL as the base and TGH as the height)
Tongue : oral cross sectional area (ratio) Tongue CSA : Oral CSA Epiglottis
Linear distance between ANS and Eb (mm) ANS-Eb
Cervical vertebrae
• 1-piece MAD: Svanholt et al.
24found that the pre- valence of and severity of morphological deviations of the upper spine were greater in the group of patients that failed MAD.
• 2-piece MAD: Neither the linear distance between RGN and C3ia
21nor the craniocervical angle
21,22seemed to be predictive of MAD treatment outcome.
Cephalometric dental measurements
• 1-piece MAD: Studies investigating dental para- meters agreed on the lack of predictive value of these measurements for treatment outcome.
14,24• 2-piece MAD: Overjet and overbite were widely Table 3. Continued
Variable Measurement
Upper Airway Width (mm)
At the level of soft palate SPAS or SP-PAS or Superior Posterior (along parallel line to Go-B line)
MAS or middle airway (along parallel line to Go-B line through P)
MinRPA or narrowest palatal airway (minimal width perpendicular to posterior pharyngeal wall) RPAS (Phw-Spt)
At the level of tongue base PAS or IAS or IAS1 (distance between posterior pharyngeal wall and the dorsal base of tongue surface, measured on a line intersecting Go and B Point)
Posterior Inferior (distance between base of tongue and posterior pharyngeal wall)
MinRGA or narrowest lingual airway (minimal width perpendicular to posterior pharyngeal wall) TB-PAS (at the level of the tongue base) PPW’-BT’
Through C3 IAS2 (along parallel line to Go-B line)
Vertical length (mm) VAL (PNS-Eb)
Cross-sectional area (mm
2)
Nasopharynx cross-sectional area NASOXA (area outlined by line between R and PNS, extension of palatal plane to posterior pharyngeal wall and posterior pharyngeal wall)
Oropharynx cross-sectional area OROXA (area outlined by inferior border of nasopharynx, posterior surface of soft palate, line parallel to palatal plane from point P to dorsal surface of tongue, posterior inferior surface of tongue, line parallel to palate plane through point Et, and posterior pharyngeal wall) Cross-sectional area (mm
2)
Hypopharynx cross-sectional area HYPOXA (area outlined by inferior border of oropharynx, posterior surface of epiglottis, line parallel to palatal plane through point C4, and posterior pharyngeal wall)
Pharinx cross-sectional area PHYNXA (sum of NASOXA, OROXA and HYPOXA) Facial contours
Facial convexity (
o) N’-Prn-Pog’
Prominence of the nose (mm) Prn-S (vertical)
Upper lip position (mm) Distance UL-E line
Lower lip position (mm) Distance LL-E line
See Figure 2 for definitions of landmarks and reference lines used in this table.
re cognized as non-predictive of treatment success.
9,17,20,22,23However, Hoekema et al.
8fo und that increased overjet and overbite were progno- stically favorable. Increased maxillary molar height also seemed to be associated with a better chance of successful treatment.
17None of the other cepha- lometric dental measurements exhibited predictive value.
21,23Cephalometric soft tissue measurements Soft palate
• 1-piece MAD: Soft palate depth and thickness and palatal angle were identified as non-predictive of treatment outcomes,
10,14whereas data concerning soft palate length, which, when decreased,
16was recognized both as non-predictive of treatment
outcome
14,15and predictive of treatment success, were controversial.
• 2-piece MAD: Shen recognized soft palate thickness as non-predictive of treatment outcome.
9The role of soft palate length was controversial. Two out of 6 studies found that decreased soft palate length was predictive of treatment success
9,22while 4 did not.
8,19-21Tongue
• 1-piece MAD: There was general agreement that the cephalometric variables of tongue length, height, and cross-sectional area were not useful for predicting MAD treatment outcomes.
10,14,15• 2-piece MAD: Tongue-related cephalometric variables were widely recognized as non-predictive of MAD treatment outcome
9,17,22,23with the sole exception of tongue/oral enclosure cross-sectional ratio, which Mostafiz et al.
21found was increased in complete responders.
Epiglottis
• 1-piece MAD: Only 1 study examined the predictive role of the distance between ANS and Eb in treatment outcomes, finding that the greater this distance, the less effective the treatment.
10• 2-piece MAD: No study investigated the predictive role of epiglottis parameters.
Upper airway
• 1-piece MAD: Upper airway parameters were unani- mously recognized as non-predictive of MAD treat- ment outcome.
10,14,16• 2-piece MAD: Neither vertical length nor cross- sectional area were found to be predictive of out- come.
9,17,20Concerning the upper airway widths, only 1 study (Shen et al.
9) found significantly decreased retroglossal width in good responders. The majority showed a non-predictive role for retropalatal width, although Mehta et al.
5and Liu et al.
17found an increased retropalatal space in good and poor res- ponders, respectively.
Facial contours
• 1-piece MAD: Kim et al.
14found no differences in profile measurements between good and poor res- ponders.
• 2-piece MAD: No profile measurements were found to be predictors for treatment outcome with 2-piece MAD.
20DISCUSSION
MADs are increasingly used for treatment of mild to
FP
PP
OP
MP Me
Pog' LL Uli LL B
Pog Pog Gn Gn RGN
H (Hy) Eb
C3ia C3ia
C4 Iop
D
Po S
N N' SN
E line
Prn Or
Cd R
Ba C2
Ar
Phw Spt
PNS
PNS ANS
A UL UL
PPW' PPW' P (Ut)P (Ut)
Et Et Go Go
BT' BT'
L6c L6c U6c U6c
TT TT Lli