Veterinary Science Echocardiographic indices in normal German shepherd dogs
Ruthnéa Aparecida Lázaro Muzzi
1,*, Leonardo Augusto Lopes Muzzi
1, Roberto Baracat de Araújo
2, Marcos Cherem
31
Department of Veterinary Medicine, Federal University of Lavras, Postal Code 3037, Zip-code 37200-000, Lavras, Minas Gerais state, Brazil
2
Veterinary School – Federal University of Minas Gerais, Postal Code 567, Zip-code 30123-970, Belo Horizonte, Minas Gerais State, Brazil
3
Ecomed - Zip-code 37200-000, Lavras city, Minas Gerais State, Brazil
Sixty clinically normal German shepherd dogs, 31 males and 29 females, ranging in age from 1 and 5 years and with a body weight ranging from 22 to 37.2 kg, were examined by the two-dimensional mode, M-mode, and Doppler echocardiography. In Doppler mode, the mitral valve flows were obtained, where the aim was to determine the velocity peaks and ratios of the E and A waves and the mitral E wave deceleration time. The velocity peaks were obtained for the tricuspid, pulmonary and aortic valves. On the left ventricular outflow tract flow, the time velocity integral and aortic cross-sectional area was used to calculate the cardiac output. A statistically significant correlation with the body weight was found for the systolic left atrial and diastolic aortic diameter on two- dimensional mode. On M-mode, there was a significant correlation between the body weight and the systolic left atrium and diastolic aortic dimension, systolic and diastolic left ventricular, septal and posterior wall dimensions. Doppler echocardiography showed that there was no significant correlation between the body weight and the mitral, tricuspid, pulmonary and aortic valves flows. These results demonstrate that it is important to know the normal echocardiographic values for German shepherd dogs because there are some characteristics peculiar to this particular breed. The data obtained is expected to be helpful for studies on small animal cardiology.
Key words: Doppler echocardiography, echocardiography, M- mode, two-dimensional mode
Introduction
Echocardiography is an ultrasound technique that is an important diagnostic tool in cardiology [21], which has
recently been introduced to veterinary medicine as a non- invasive method for evaluating the anatomy and function of the heart [12].
Conventional echocardiographic modalities include two- dimensional, M-mode, and Doppler modes [12]. An ultrasound examination of the heart and large vessels represents a significant technological advance in veterinary medicine.
Echocardiography allows an evaluation of the space relationship between structures, cardiac movement and the blood flow features, the precise and non-invasive diagnostic of cardiac alterations, as well as a follow-up of therapy and to determine the prognosis through direct vision of the cardiac chambers. It is important that an echocardiographic examination be considered as part of a thorough cardiovascular evaluation including other examinations, such as clinical, radiographic, and electrocardiographic examinations [13].
The echocardiographic indices show significant breed variations and it is important to know the normal echocardio- graphic values for each dog breed considering the influence of body weight on the established echocardiographic values [3,6,23,26].
The aim of this study was to determine the echocardio- graphic indices of clinically healthy German shepherd dogs, and correlate them with the body weight, gender and age. It is expected that the data obtained will be valuable for the progress of studies on small animal cardiology.
Materials and Methods
This study examined 60 clinically health German shepherd dogs, 31 males and 29 females, ranging in age from 1 and 5 years. The animals were selected through a physical and electrocardiographic examination, those showing any clinical sign of cardiopathy were excluded. The dogs were examined by two-dimensional, M-mode, and Doppler echocardiography, and all data was recorded in the proper files containing the name, number, gender, age, body weight and echocardiographic measurements.
*Corresponding author
Tel: +55-35-3829-1148; Fax:+55-35-3829-1148
E-mail: [email protected]
An ultrasound unit (UF5800; Fukuda Denshi, Brazil), 3.5 MHz transducer was used for the echocardiographic examination. The animals were positioned on the right and left lateral recumbency using a manual restraint. A U-shape table was used at the thoracic region. A thick acoustic gel layer was placed between the transducer and the site of examination with no hair removal. Three individual measurements of each variable were performed and the average data was obtained. All examinations were printed on thermosensitive paper and recorded on videotape for further evaluations.
For the two-dimensional mode images, the right and left parasternal positions, from the third to the fifth intercostal spaces, were used according to Thomas et al . [26]. In this mode, the left atrial apex-base and mediolateral diameters, area and volume were measured. The aorta diameter was also measured at the level of the aortic valve annulus.
For M-mode, the following measurements were made at the end-diastole according Lombard and Ackerman [19]:
aorta (AO), right ventricular internal dimension (RVIDD), septal thickness (ST), left ventricular internal dimension (LVIDD) and left ventricular wall thickness (LVWT). The same measurements were made at the end-systole, including the left atrium (LA).
The following calculations were made: the left atrial to aortic root ratio (LA/AO), left ventricular fractional shortening (%FS), left ventricular mass (LVM) and the mitral valve E- point to the ventricular septal separation (EPSS) (the distance between the ventricular septum and the maximal initial opening of the mitral valve E point). The LVM was calculated according to the formula reported by Devereux and Reichek [10]: [1.04 × (LVIDD + STD + LVWTD)
3− LVIDD
3− 13.6].
Doppler mode transducer positioning was performed according to the recommendations by Darke et al . [7]. With each examination site using pulsed-waved Doppler, the transducer angle was guided by audio and by the waveforms with a greater velocity. The mitral valve flows were obtained in order to determine the velocity peaks, the ratios of the E and A waves and the mitral E wave deceleration time.
Regarding the tricuspid valve, the velocity peaks and ratios of the E and A waves were examined. The velocity peaks for pulmonary and aortic valves were also obtained. On the left ventricular outflow tract flow, the time velocity integral (TVI) and aortic cross-sectional area were used to calculate the stroke volume. The stroke volume across the aortic valve was calculated by multiplying the cross-sectional area at the level of the aortic annulus by the time-velocity integral of flow across that valve. The area was calculated from the peak diameter at the insertion of the aortic leaflets in the parasternal long-axis view, assuming a circular configuration.
The outflow velocities were obtained by pulsed Doppler echocardiography from the apex with the sample volume at the level of the measured diameter and scanned radially for
optimal alignment with flow. The time-velocity integral was calculated by tracing the modal velocity (the darkest portion of the velocity spectrum representing the largest scatter) and averaging over three to five beats. The stroke volume was determined from the product of area and time-velocity integral . The cardiac output (CO) was then calculated by multiplying the stroke volume by the heart rate [28].
Statistical analysis involved correlating all the studied variables with the body weight and age. In relationship to gender, the Student t test was used to compare the mean values between males and females, and to set the significance level (%). The sample distribution was normal (Gaussian). Hence, the data is described as the average and standard deviation.
Results
The mean age of the dogs was 2.9 ± 1.21 years ranging from 1 to 5 years. The mean body weight was 30.2 ± 3.98 kg ranging from 22 to 37.2 kg. 48.3% were females and 51.7% were males.
Two-dimensional mode
The left atrial apex-base and mediolateral diameter was 3.73 ± 0.238 cm and 3.32 ± 0.186 cm, respectively. The volume and area of the left atrium was 10.00 ± 1.235 cm
2and 25.12 ± 4.210 ml, respectively. The diameter of the aorta at the level of the aortic valve annulus was 2.52 ± 0.16 cm. All these variables correlated with the body weight (correlation coefficient r = 0.38 to 0.58, p < 0.05), with no association with age or gender ( p < 0.001).
M-mode
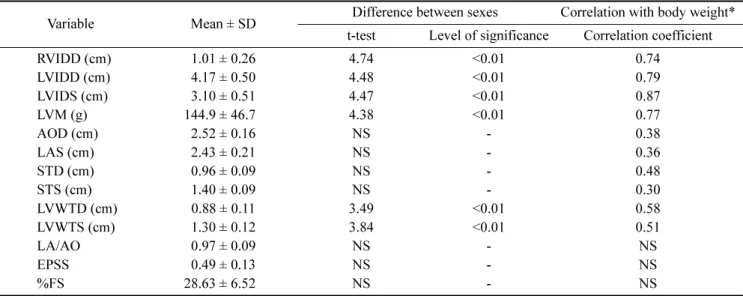
Table 1 shows the average and standard deviation of all the variables examined in this mode. A statistically significant correlation with body weight was observed for the left atrial, aortic diameter, left ventricular, septal and posterior wall dimensions (correlation coefficient r = 0.30 to 0.87, p < 0.05), with no age correlation ( p < 0.001). A statistically significant gender difference was found for the right and left ventricular and posterior wall dimensions ( p < 0.01).
Doppler mode
Mitral valve: During the diastole, the mitral valve flow was positive (over baseline), laminar, and divided in two main phases of a triangle aspect, E and A waves. The E wave peak of the velocity was 0.74 ± 0.084 m/s. The A wave, which is generally lower than the E value, was the result of atrium contraction, with velocity peaks of 0.44
± 0.074 m/s. The relationship between the E and A waves
(E/A) was always greater than 1.0. The E and A wave peaks
were not associated with age or gender. The mitral E wave
deceleration time was 132.6 ± 16.44 ms.
Tricuspid valve: a similar diastolic flow to the mitral valve was observed. The E wave velocity peak was 0.67 ± 0.117 m/s and the A wave velocity peak was 0.41 ± 0.094 m/s. The E and A velocity peaks showed no correlation with the body weight, age or gender.
Pulmonary valve: The pulmonary valve flow was observed as a negative, laminar and during systole. The velocity peak was 0.92 ± 0.129 m/s.
Aortic valve: Negative and laminar flows were observed during the systole, with velocity peaks of 1.02 ± 0.143 m/s.
Left ventricular outflow tract: This flow was observed during the systole, was negative and quite similar to the aortic flow, but with lower velocity peaks (0.92 ± 0.164 m/
s). After its measurement, the stroke volume was calculated using the time velocity integral (average: 17.93 ± 2.277 cm) and the aortic valve annulus (2.52 ± 0.16 cm). The cardiac output was calculated by multiplying the stroke volume (average: 52.93 ± 7.843 ml) by the heart rate (average 63.45
± 8.45 beats/min). The CO value was 3.28 ± 0.797 l/min.
the pulmonary and aortic flows showed no significant correlation with the body weight, age or gender.
Discussion
Good two-dimensional echocardiographic images of 60 studied dogs were obtained, which were qualitatively similar to those described in other breeds [8,12,20,22,23,29]. On
two-dimensional mode, the left atrium apex-base and mediolateral diameters, area and volume were examined.
All these results were similar to those described by O’Grady
et al . [22]. The left atrial size in the dog demonstrated a strong correlation between the changes in the left ventricular end-diastolic pressure and the left atrial pressure, with the left atrial size being a good indicator of left ventricle abnormalities, particularly cardiac failure. The same authors have also observed a significant correlation between the variables and the body weight but with higher correlation coefficients (r > 0.77). This might be explained by the breed, age and body weight homogeneity of our study sample.
Crippa et al . [6] observed similar results in Beagles.
Morceff [21] and O’Leary et al . [23] examined the aortic diameter at the level of the aortic valve annulus and reported similar results to this study. They reported that the main preference for the measure in this place was its possible reproducibility, which is better than in other sites. O’Leary
et al . [23] demonstrated that the high correlation for the aortic diameter measurement at the level of the aortic valve annulus was the result of the greater ease in defining the region of the sinuses, as opposed to the more difficult definition of the aortic annulus.
For M-mode, the left ventricular and septal wall thickness or left ventricular internal cavity dimensions measurements fall within the range of values considered to be normal for dogs of this body size, as reported elsewhere [8,19,26].
Echocardiography can help evaluate many cardiac diseases such as mitral regurgitation, cardiomyopathy, congenital defects or hypertrophic patterns. Knowledge of the normal
Table 1.