Feasibility of Estimating Rut Resistance of SMA Mixture by Static Loading Test Using Confined Specimen
공시체 구속 상태에서 정하중 시험에 의한 SMA 혼합물의 소성변형 저항성평가 가능성
Kim, Sungun
a⋅Choi, Chang-jeong
b⋅Kim, Kwang W.
c,✝김성운⋅최창정⋅김광우
ABSTRACT
It is well-known fact that the stone-mastic asphalt (SMA) mixture has shown superior rut resistance, compared with the dense-graded asphalt (DGA) mixture in highway pavements. However, the SMA is measured to be inferior to DGA mixes when tested by well-known high-temperature test methods, such as the wheel tracking (WT), asphalt pavement analyzer, the Marshall Stability and Kim Test. Therefore, this study examined the reasons why it was measured to be inferior, and devised a potential procedure by which the superiority of SMA could be measured at 60℃. The strength against deformation (SD), which was known to show very high correlation with WT results for DGA mixes, was measured by the Kim Test on the specimen confined in the compacted mold. In standard Kim Test, which used the specimen without confinement, the DGA was measured to show higher SD than the SMA. But by confining specimen, it was found that the SD of SMA was measured to be higher than that of DGA. Therefore, the confined static test protocol devised in this study was found to be feasible for evaluating rut resistance of SMA mix.
Keywords: Stone mastic asphalt (SMA); deformation strength (SD); rut; vertical deformation; wheel tracking; confined specimen; Kim test
Ⅰ. Introduction
Since vehicle wheels directly depress asphalt pavement from the surface, wheel tracking (WT) tests are the most widely used techniques for estimating the rut resistance of asphalt mixtures (Brown and Brodrick, 1981; Gabet et al., 2007, Gabet et al.
2011). The stone mastic asphalt (SMA) mixture shows superior performance in expressway, national highway and local road pavement under heavy traffic with much stronger rut resistance than the dense-graded asphalt (DGA) mixture. Even though some studies showed reasonable performance of SMA (Buttler et al. 2016, Liu et al. 2017), however, its superiority is not properly measured by WT type tests, as well as by other high-temperature (50∼60℃) tests in many studies (Kim et al.,
2008; 2009a; 2009b; 2014; Lee et al., 2013). These test methods include the WT test, APA test, Kim test, and the Marshall Stability tests, which are widely-used and convenient tools for estimating rut resistance or strength of conventional DGA mixes at a high temperature (Buttlar et al., 2017).
When the SMA mixes were measured by these test methods, the SMA appeared to be weaker than the DGA, which actually demonstrates poorer performance in the field in contrast (Park et al., 2008). The SMA, which is particularly known for its superior resistance against rutting in the field, cannot be properly evaluated by these conventional test methods.
Kim Test was developed as a method for estimating the strength against deformation (S
D) or deformation resistance of DGA mix at 60℃ (Doh et al., 2007; Kim et al., 2004b; 2011).
Since S
Dvalues show very high correlation with WT and APA test results, it was introduced as a mix design criterion for DGA mix by using gyratory-compacted specimens in place of Marshall stability and flow in Korea (Kim, Lee & Kim, 2006;
2007, MLIT, 2017). However, when this test was applied to SMA, the result was less effective than DGA for some reasons.
The most likely reason is that the specimen is unconfined laterally, allowing the interlocked aggregate skeletons buckled off easily (Lee et al., 2013).
a
Lecturer, Department of Regional Infrastructure Engineering, Kangwona National University
b
PhD Student, Department of Regional Infrastructure Engineering, Kangwona National University
c
Professor, Department of Regional Infrastructure Engineering, Kangwona National University
† Corresponding author
Tel.: +82-33-250-6467 Fax: +81-33-259-5590 E-mail: [email protected]
Received: March 29, 2019
Revised: April 4, 2019
Accepted: April 22, 2019
The SMA is constructed of a high content of coarse aggregates, together with fibers to form stone skeletons in order that strong resistance can be provided against the vertical loading wheel pressure. Therefore, the differences between SMA and DGA are the inclusion of cellulose fiber with a higher content of binder and larger-size aggregate. However, there has been no evidence that those differences are a source of inferior performance in those tests.
The stress applied on SMA in the field pavement is much lower than the stress level which induces mechanical failure of the specimen in the laboratory. When a truck tire is standing on the pavement, the service stress applied to the pavement surface by the tire will be no higher than 0.7∼1.0 MPa (100∼142 psi).
In that level of stress in a confined pavement body, the aggregate skeleton of SMA mixture will not be buckled off.
However, most laboratory tests apply the stress over the field service level until reaching a mechanical failure without considering the initial-stage behavior. If the load is above a certain level, the SMA specimen will be failed easily due to buckling of aggregate skeleton.
Therefore, the idea behind this study is that since SMA is expected to support loading until maintaining an aggregate skeleton, the conventional test technique, which was designed to measure the ultimate strength, will have to be modified for SMA. Instead, the behavior of SMA should be evaluated under a much lower (service) stress level of the specimen confined in a mold. Consequently, the behavior of SMA needs to be evaluated at a shallow rut depth, which is not large enough to induce skeleton buckling.
Since rutting is the failure mechanism that induces lateral
moving of aggregates, aggregate particles will be ejected off the skeleton in the SMA mixture if the rut depth is over a certain level. Therefore, to induce a vertical compression and a lateral shear force, a static load should be applied to the SMA specimen confined laterally using a round-edge loading head used for Kim test. This is an effort to develop a methodology that could judge the strong nature of SMA mixtures against rutting at high service temperatures.
The objective of this study is therefore to develop a static test procedure utilizing Kim test on the confined SMA specimen, and to suggest a new test protocol that could possibly measure the higher resistance of SMA against vertical deformation at a high temperature (60℃).
Ⅱ. Materials and Methods 1. Materials
Two binders were used: normal PG64-22 asphalt, and a polymer modified asphalt (PMA) PG76-22 binder. Two coarse aggregates, gneiss and granite with a maximum size of 13㎜, were used for the mix-design of normal (unmodified) hot-mix dense-graded asphalt (DGA) mixtures and stone mastic asphalt (SMA) mixtures. Screenings and limestone powder were used as fine aggregate and mineral filler, respectively.
2. Wheel Tracking (WT) Test
It is a widely held hypothesis that WT results on laboratory asphalt mixtures produce a reasonable prediction of rutting in the field pavement (Brown and Brodrick, 1981; Gabet et al.,
(a)
0 2 4 6 8 10 12
0 500 1,000 1,500 2,000 2,500 3,000 3,500 4,000 No. of cycle
Rut depth (mm)
(b)
Fig. 1 Illustration of (a) WT equipment and (b) a curve from a WT test
2011). Therefore, the rut resistance of normal DGA and SMA mixtures was evaluated by the WT test in the laboratory. The wheel tracker consisted of a steel wheel (200㎜ in diameter and 50㎜ in width) rolling on top of a slab specimen on the base plate, moving with a 200㎜ back-and-forth stroke (Fig. 1(a)).
The slab specimen (305 x 305 x 50㎜) was prepared at 3%
and 4% air voids for SMA and DGA mixes, respectively, using a roller press compactor. The slab was cut into two pieces and kept at an ambient temperature for 24 hours, and then 6 hours in the WT temperature (60℃) before starting the test. The WT test was performed on a half size slab (150㎜ width), on which 687 N of wheel load was applied. A total 3,600 cycles (7,200 passes) was applied for 90 minutes (40 cycles per minute), during which the depth of deformation was recorded by the number of cycles, as shown in Fig. 1 (b) (Kim and Doh 2006).
3. Kim Test
The Kim Test is a type of test measuring bearing strength, referred to as strength against deformation (S
D), of the asphalt mixture by applying a static load through a round-edged loading head on top center of a cylindrical specimen at 60
oC (Doh et al., 2007; Kim et al., 2004b; 2009a; 2011). The diameter (D) of the loading head is 40㎜ with a 10㎜ radius (r) of round cut at the bottom edge, making a flat bottom center face with
20 ㎜ diameter, as shown in Fig. 2. The specimen was placed in the test holder immediately after soaking in 60
oC water for 30min, and then a static load was applied vertically at the speed of 30㎜/min through the loading head. Since the S
Dwas found to have a very high correlation with rut characteristics of DGA mixtures (Kim et al., 2003; 2004a, 2011), it was adopted as a criterion in the Korean mix-design guide (Kim et al., 2006; MLIT, 2017).
A load - deformation curve in Fig. 2(4) was obtained from each test, and the peak load (P
max) and vertical deformation (v) at P
maxwere read from each curve. The S
Dwas computed by using normal stress equation, S
D=P/A, in which A is the projected circle area of the loading head contact to the surface of specimen. It is given by A=
, increasing by the v increase, when the loading head is press down into specimen body. By adopting D=40 and r=10, the
“S
D=P/{
}” was rearranged as Eq. (1). The average S
Dof three replicates was used for evaluation.
2 2
max
) 20 10 (
32 . 0
v v S
DP
(1)
where, S
D= deformation strength (MPa), P
max= maximum load (N), v = vertical deformation (㎜) at P
max.
60oC Water
Load (N)
Deformation (mm) P
v
1. Prepared specimens by SGC
2. Submerging for 30 min.
Loading (diameterhead
=40㎜)
3. Applying a load through the loading head at 30mm/min.
R=10㎜
4. Obtained P-y curve from a Kim Test
Fig. 2 Kim Test procedure on 100㎜ specimen without lateral confinement
According to Eq. (1), the S
Dwas computed to be larger for the mixture which has a smaller v under the same load level and vice versa (Kim et al., 2003; 2004a; 2004b). Details regarding S
Dare given elsewhere (Doh et al., 2007, Kim et al., 2004b, 2011, MLIT, 2017).
4. Confined Kim Test
The Kim Test loading head was applied to the confined specimen to obtain the load and deformation information in the confined state at 60℃. Since the mix design of SMA is still performed by Marshall method in Korea and many other countries, the Marshall mold was used for confinement. The design mixture was compacted in the Marshall mold by 75 blows per side by the Marshall compactor. The compacted specimen with out extrusion from the mold as shown in Fig.
3 was submerged in to 60℃ water for 30 min for Kim Test after air cooling for one day in the laboratory.
A static load was applied through the loading head on the
top center of the confined specimen. All procedures were exactly the same as the standard Kim Test steps, as shown in Fig. 2, except for the use of the confined specimen. The loading head was continuously pressed down into the specimen body.
Fig. 4 illustrates load-deformation (P-v) curves of two types of the Kim test. The curve from an unconfined specimen in Fig.
4 is basically the same as the curve in Fig. 3. However, the curve from a confined test shows no peak, but a much higher load level at the same deformation.
Ⅲ. Results and Discussions 1. Wheel Tracking Rut Depth
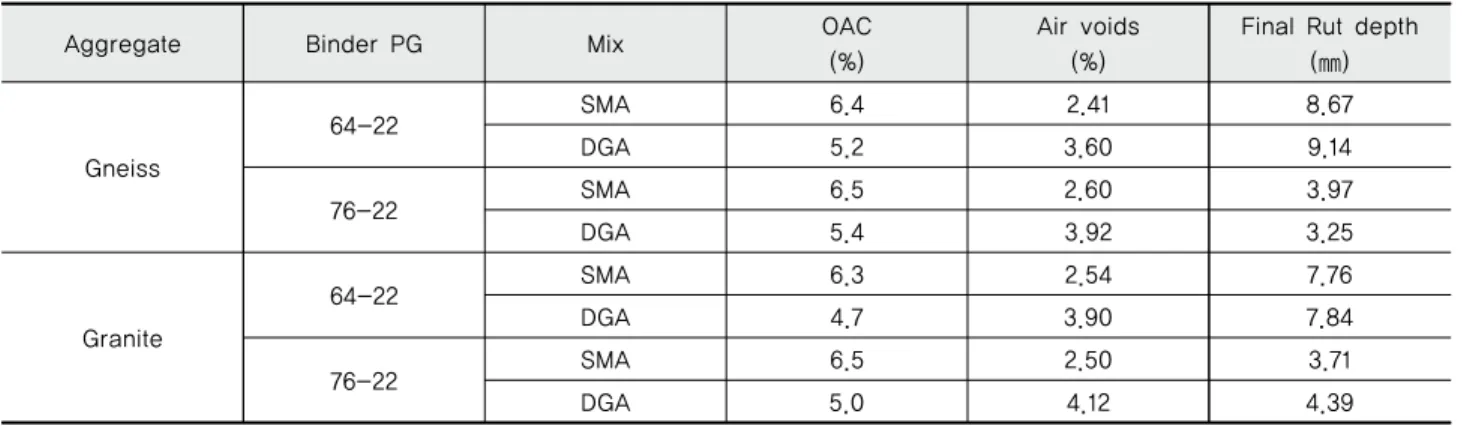
Table 1 illustrates the comparison of the final rut depths resulting from a wheel tracking (WT) test on dense-graded asphalt (DGA) and stone mastic asphalt (SMA) mixes. In general in the field, little rutting is observed on the surface of
Aggregate Binder PG Mix OAC
(%)
Air voids (%)
Final Rut depth (㎜)
Gneiss
64-22 SMA 6.4 2.41 8.67
DGA 5.2 3.60 9.14
76-22 SMA 6.5 2.60 3.97
DGA 5.4 3.92 3.25
Granite
64-22 SMA 6.3 2.54 7.76
DGA 4.7 3.90 7.84
76-22 SMA 6.5 2.50 3.71
DGA 5.0 4.12 4.39
Table 1 WT test results for SMA and DGA mixtures with 13㎜ aggregate Fig. 3 Kim Test on 100㎜ specimen confined Marshall
Mold
0 4 8 12 16 20 24 28
0 1 2 3 4 5 6 7 8
v (mm)
P (kN)
unconfined confined
Fig. 4 Comparison of P-
vcurves of an unconfined Kim in test
and a confined Kim test
SMA pavement. Therefore, in WT test, the SMA is expected to be better than the DGA which showed approximately 8㎜
of rut depth for 64-22 in Table 1. The final rut depth of 64-22 SMA was not much better than that of 64-22 DGA, which is normally prone to rut in the field pavement. The final rut depths of 76-22 SMA were even slightly deeper than those of 76-22 DGA. Since these types of test results were typical for laboratory SMA mixes (Kim et al., 2008; 2009a; 2009b; Lee et al., 2013), the rut resistance of SMA could not be properly estimated from the WT test.
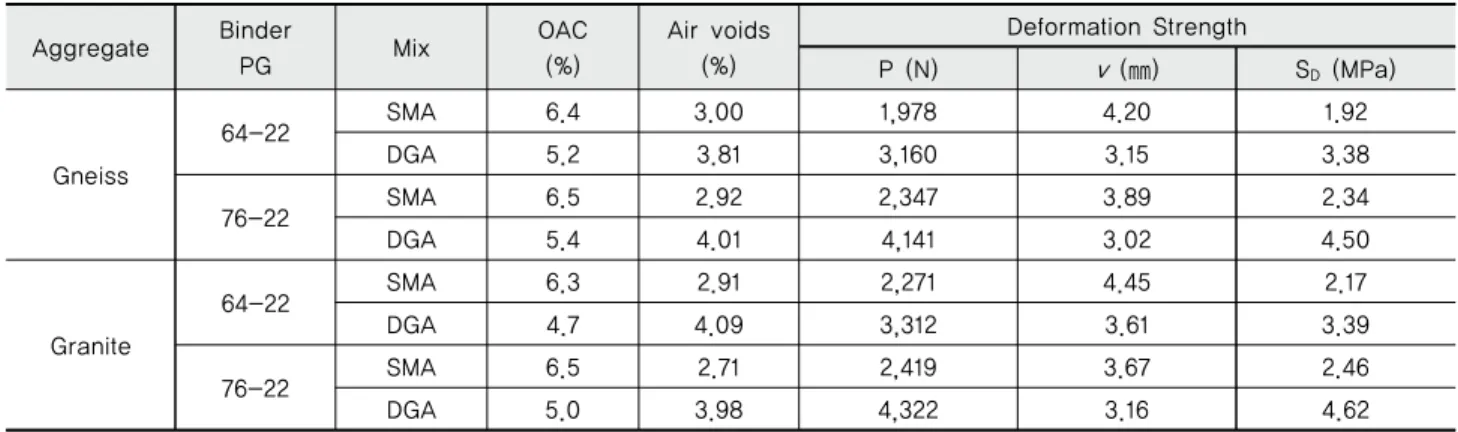
2. Strength against Deformation (S
D)
For the 64-22 binder in Table 2, S
Dvalues of SMA were lower than those of DGA. For the 76-22 binder, S
Dvalues of SMA were nearly 1/2 of DGA on average. The polymer modification effect did not appear in SMA mixes. S
Dis a strength representing the ability (resistance) to withstand the applied pressure, and is measured by the peak load divided by the projected contact area of depression. The poor S
Dvalues of SMA are due to the lower P and larger v values (Table 2), as a result of early buckling of the aggregate skeleton during depression of the unconfined SMA specimen. It seems that once the aggregate skeleton is buckled off, the SMA strength by using normal specimen cannot be as high as DGA if the load is applied up to the level inducing mechanical failure. Therefore, measuring strength of SMA by classical strength test method seemed to be inappropriate.
As previously mentioned, both S
Dand WT test results from SMA were less effective than those from DGA; however, the correlation of both properties was found to be good. Fig. 5 shows the relation of the WT rut depth and S
D,revealing avery
high correlation (R
2>0.87). However, the regression curves of the two mixes were clearly separated, forming SMA in the lower side location of the x(S
D) axis. It is important to note that the high R
2indicates that the S
Dis a property highly related to the rut resistance of asphalt mixes, even though it is simply measured by a static loading.
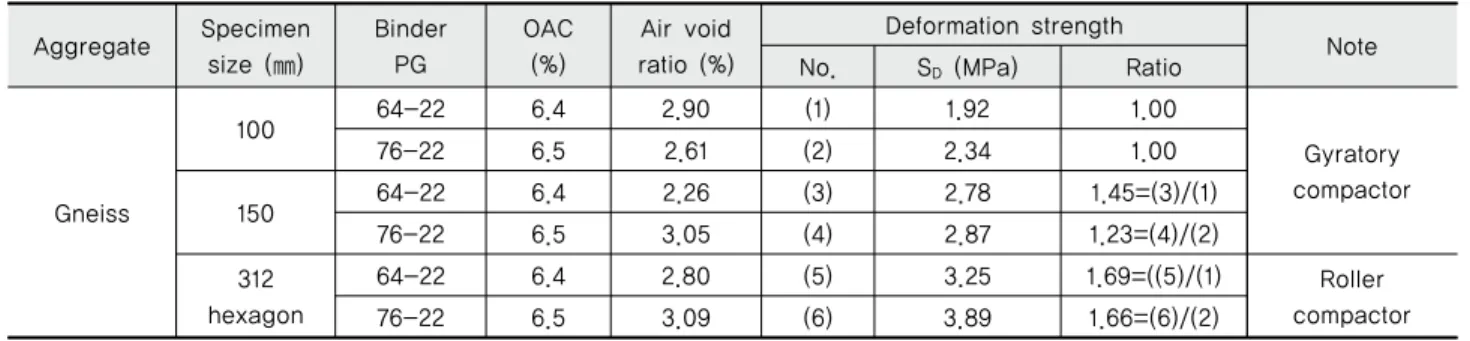
Another reason why the S
Dmeasured on SMA was so low might be due to the use of small-size specimens, which are unable to provide a strong enough body resistance against shear stress, as shown in Fig. 6. It is assumed that if a larger bodied specimen is used, the higher level of loading can be sustained without buckling off the aggregate skeleton due to the strong lateral confinement. Therefore, the larger-size specimen was used to examine if the higher S
Dcould be obtained due to the larger-confining-body out side the projected failure line, which is similar to punching failure line diagonal to the bottom from load application spot, as shown in Fig. 6.
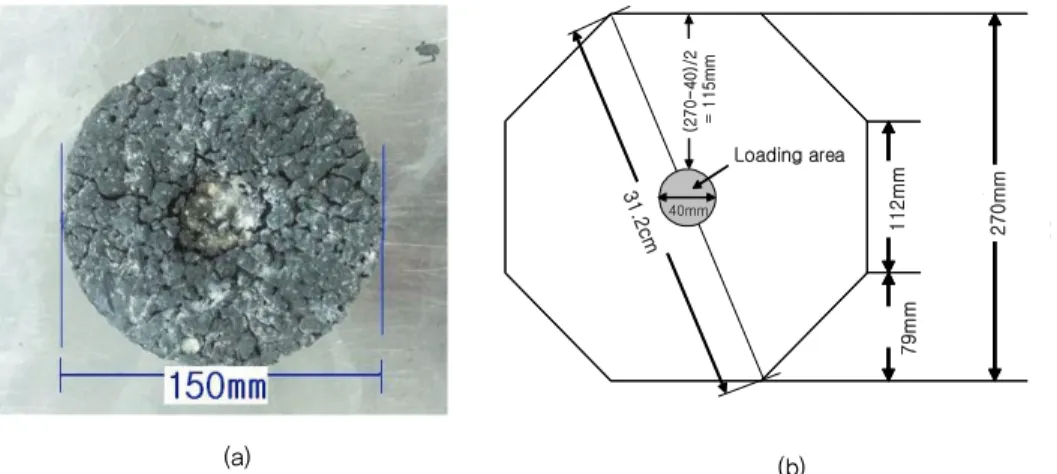
Therefore, two specimens larger than 100㎜ diameter were used (a 150㎜ diameter and a 312㎜ diagonal-size hexagon) (Fig. 7) to investigate size effect of specimens on S
D, (Table 3). It was clear that the size increase was effective in increasing S
D, demonstrating that a larger size is more effective. However, the 150㎜ specimen was not much effective than hexagon specimen. The S
Dwas increased by 69% on the hexagon specimen from a 100㎜ specimen, resulting in an S
D(3.25 MPa) of a normal size (64-22). The SMA surpassed the minimum value (S
D≥ 3.2MPa) for normal DGA mixes set forth in the Korean mix-design guide (MLIT, 2017). However, the S
Dof modified (76-22) SMA was 3.89 MPa, which is still lower than the minimum value (S
D≥ 4.25MPa) of the first class highway pavement mix.
Aggregate Binder
PG Mix OAC
(%)
Air voids (%)
Deformation Strength
P (N)
v(㎜) S
D(MPa)
Gneiss
64-22 SMA 6.4 3.00 1,978 4.20 1.92
DGA 5.2 3.81 3,160 3.15 3.38
76-22 SMA 6.5 2.92 2,347 3.89 2.34
DGA 5.4 4.01 4,141 3.02 4.50
Granite
64-22 SMA 6.3 2.91 2,271 4.45 2.17
DGA 4.7 4.09 3,312 3.61 3.39
76-22 SMA 6.5 2.71 2,419 3.67 2.46
DGA 5.0 3.98 4,322 3.16 4.62
Table 2 S
Dof SMA and DGA mixtures with 13㎜ aggregate (100㎜ diamet er spe cimen )
R2 = 0.9745 R2 = 0.8786
0 2 4 6 8 10 12
1.5 2.0 2.5 3.0 3.5 4.0 4.5 5.0
SD (MPa)
WT rut depth (mm)
SMA DGA
Fig. 5 Relation of WT rut depth and S
DED: Effective depth of specimen v: Vertical deformation
45o
ED
45o
Depth of specimen 40
v
100mm diameter specimen 45o
ED
45o 40
v Failure line
(a) (b) Larger
confining body
smaller confining body
150mm diameter specimen
mm Loading head mm
P P
Fig. 6 Illustration of body confinements for specimen diameter of (a) 150㎜ and (b) 100㎜
(a)
11.2 cm
7.9 cm 27.0 11.2 cm
7.9 cm 27.0 31
.2cm 270mm
112mm 79mm Loading area 40mm
(270-40)/2 = 115mm
(b)
Fig. 7 Two larger-size specimens; (a) 150㎜ diameter and (b) 312 hexagon specimen
(Kim
et al., 2008; Lee
et al., 2013)
Since the SMA was not measured to be better in WT and SD than the DGA, the superiority of the SMA in the field (namely a rutting free asphalt pavement) cannot be observed by any lab test used in this study. Since test results were insufficient after preparing the hexagon specimen in a series of time-consuming works using a roller compactor, it would be advantageous to find another way. The load applied by a vehicle wheel on the field pavement is mainly sustained by the aggregate skeleton in the SMA mixture, which is naturally confined by the surrounding body. Therefore, further study of the confined SMA specimen needs to be evaluated.
3. Confined Kim test
The compacted specimen confined laterally in a Marshall mold was used without extrusion for Kim Test, as shown in Fig. 3. As mentioned earlier, when a tire is loading on the pavement, the stress applied to the pavement surface is no more than 0.7∼1.0MPa (100∼142psi). In this level of stress in a confined pavement body, the SMA shall sustain its aggregate skeleton without buckling.
Since the SMA is expected to sustain the load under a small vertical deformation (v), the load and v relation needed to be evaluated. Therefore, the static load was vertically applied using a Kim Test loading head on the specimen confined laterally by mold at 60
oC. The round-edged loading head was pressed down into the specimen continuously without showing peak point. Since the peak point was not shown, ultimately S
Dcannot be obtained. It was not easy to see the difference of SMA and DGA mixes from the whole curves. However, some differences were detected when initial stages were observed, as shown in Fig. 8. Since SMA and DGA mixes demonstrated different behaviors in the early stage of curves of the specimens in Marshall mold, further examination was performed. At v of 2.5∼3.0㎜,
a sign of buckling was also detected in SMA-gneiss line.
However, the buckling was not detected in granite SMA probably because of the aggregate shape; gneiss showed less angular shape than granite used in this study.
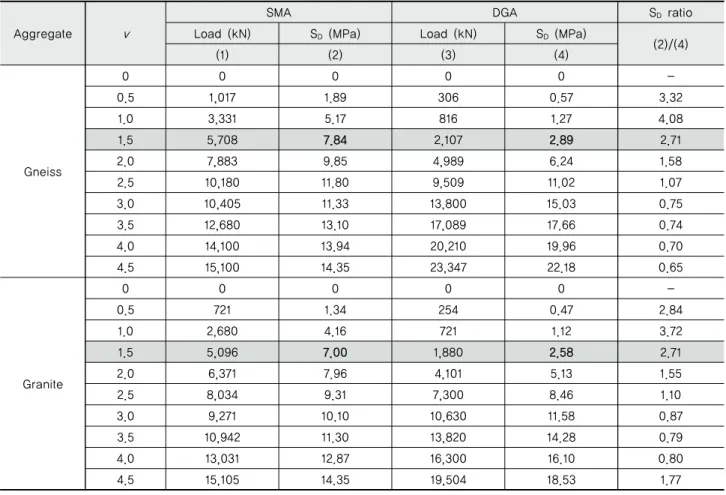
From Marshall-mold confined specimen, the S
Dby vertical deformation (v) down to 4.5㎜ was calculated for gneiss and granite mixes, and the average value of three curves was recorded for SMA and DGA in Table 4. The S
Dvalues computed by Eq. (1) using load (P) and v are shown in Table 4. The S
Dratio of SMA was calculated based on S
Dof DGA mix. The best-fit regression curves were drawn in Fig. 9 using the data in Table 4. According to regression lines, the S
Dof SMA was higher than that of DGA until v of 2.6∼2.7㎜ for both gneiss and granite mixes. However, after cross-over at those depths, SMA mixes showed lower S
Dvalues than DGA, indicating the deformation resistance of SMA became weaker than that of DGA at a larger deformation level. These cross-overs may be indications of the buckling of the aggregate skeleton of SMA, probably due to too much wedging down of the loading head, as noticed in the curve of SMA in Fig. 8.
The S
Dratio (SMA/DGA) for two aggregates were evaluated using the data in Table 4, as shown in Fig. 10. The highest S
Dratio was observed at v of 0.7∼0.8㎜. The S
Dratio was approximately 4.1 and 3.7 at v of 1㎜ for gneiss and granite, respectively, and became 1.0 at approximately 2.6㎜ for both aggregates. Passing the point where the S
Dratio is equal to 1.0, S
Dof DGA became greater than that of SMA. Therefore, if the S
Dis measured at the peak point at approximately v of 0.75
㎜, the largest difference will be observed in S
Dbetween SMA and DGA. However, the too early stage of curve is highly dependent upon the consolidation of mix. Therefore, the v value over 1.0㎜ up to 2.0㎜ will be an appropriate point for estimating S
Dof SMA, where the SMA should show the higher S
Dthan DGA.
Aggregate Specimen size (㎜)
Binder PG
OAC (%)
Air void ratio (%)
Deformation strength No. S
D(MPa) Ratio Note
Gneiss
100 64-22 6.4 2.90 (1) 1.92 1.00
Gyratory compactor
76-22 6.5 2.61 (2) 2.34 1.00
150 64-22 6.4 2.26 (3) 2.78 1.45=(3)/(1)
76-22 6.5 3.05 (4) 2.87 1.23=(4)/(2)
312 hexagon
64-22 6.4 2.80 (5) 3.25 1.69=((5)/(1) Roller
compactor
76-22 6.5 3.09 (6) 3.89 1.66=(6)/(2)
Table 3 S
Dfor SMA measured from larger-size specimens (Lee
et al., 2013)
Therefore, 1.5㎜ can be selected as a fixed v for both
aggregates for S
Devaluation. At v of 1.5㎜, the average S
Dof 7.42 MPa (7.84MPa for gneiss and 7.0MPa for granite in Table 4) was obtained for SMA, but the average S
Dof 2.74 MPa (2.89 MPa and 2.58 MPa in Table 4) was observed for DGA. The corresponding average S
Dratio of SMA over DGA was 2.71 for both aggregates.
Aggregate
vSMA DGA S
Dratio
Load (kN) S
D(MPa) Load (kN) S
D(MPa)
(2)/(4)
(1) (2) (3) (4)
Gneiss
0 0 0 0 0 -
0.5 1,017 1.89 306 0.57 3.32
1.0 3,331 5.17 816 1.27 4.08
1.5 5,708 7.84 2,107 2.89 2.71
2.0 7,883 9.85 4,989 6.24 1.58
2.5 10,180 11.80 9,509 11.02 1.07
3.0 10,405 11.33 13,800 15.03 0.75
3.5 12,680 13.10 17,089 17.66 0.74
4.0 14,100 13.94 20,210 19.96 0.70
4.5 15,100 14.35 23,347 22.18 0.65
Granite
0 0 0 0 0 -
0.5 721 1.34 254 0.47 2.84
1.0 2,680 4.16 721 1.12 3.72
1.5 5,096 7.00 1,880 2.58 2.71
2.0 6,371 7.96 4,101 5.13 1.55
2.5 8,034 9.31 7,300 8.46 1.10
3.0 9,271 10.10 10,630 11.58 0.87
3.5 10,942 11.30 13,820 14.28 0.79
4.0 13,031 12.87 16,300 16.10 0.80
4.5 15,105 14.35 19,504 18.53 1.77
Table 4 Required load to induce each vertical deformation (
v), S
Dand S
Dratio
0 3 6 9 12 15 18 21 24
0.0 0.5 1.0 1.5 2.0 2.5 3.0 3.5 4.0 4.5 5.0
v (mm) SD (MPa) .
SMA-gneiss SMA-granite DGA-gneiss DGA-granite
Fig. 9 SD trends by v from confined Kim Test for SMA and DGA
0 2 4 6 8 10 12 14 16 18 20 22 24
0.0 0.5 1.0 1.5 2.0 2.5 3.0 3.5 4.0 4.5 Vertical deformation (mm)
Load (kN)
SMA-gneiss SMA-graite DGA-gneiss DGA-granite
Fig. 8 Load and deformation curves from Kim Test on
specimens confined in Marshall mold
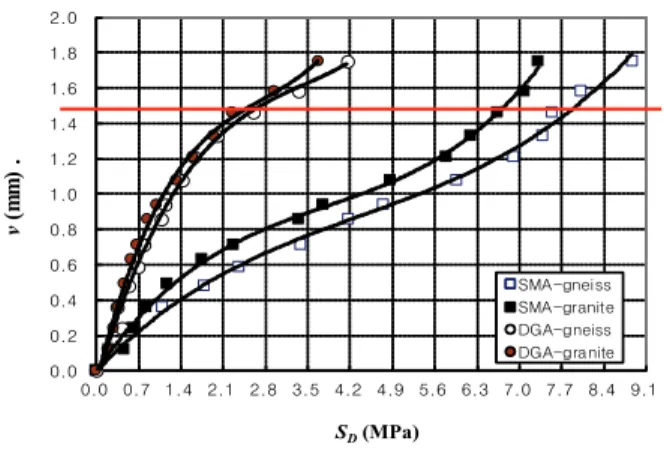
Fig. 11 shows regression analysis of deformation (v) by pressure (S
D) of front portion data. At 0.7 and 1.4 MPa (100 and 200 psi), the v of SMA was 0.3 and 0.5㎜, respectively.
But at the same pressures, the v of DGA was 0.7 and 1.1㎜, which are more than twice those of SMA. In general, the limit of truck tire pressure is 100 psi, and even for an over-loaded truck, the pressure will not be over 200 psi. If the pressure is less than 2 or 3 times the limit, the SMA still shows stronger deformation resistance than DGA. This is reasonable because at those pressure levels, DGA will show much greater v (rut depth) than SMA in the field. As previously explained, therefore, if the S
Dis measured at the fixed value of lower v level, such as 1.5㎜, the S
Dof SMA will have to be higher than that of DGA.
Based on this analysis, it was demonstrated that there is a possibility to apply this concept for establishing a certain value of S
Das a criterion. As an example, if the S
Dof 5.0 MPa at v of 1.5㎜ is established as minimum criterion for a certain highway pavement by further studies, the DGA mix shown in Table 4 will be fail to pass the limit.
Once the S
Dlimit is established, the test protocol should enumerate the confined Kim test procedure. From confined Kim test data, the P at a fixed v (㎜) will be used to compute the S
Dusing Eq. 1. The average of three S
Dtest data will be judged based on the established acceptance limit of S
D. For the same test, the S
Dof DGA mix is expected to be lower than that of SMA at the same v.
The hypothesis of this study was that the SMA would be stronger than DGA as long as the aggregate skeleton is intact.
This reasoning was proved in this study result that SMA was stronger than DGA at a lower level of deformation when the
specimen was confined. Specifically, it should be note that this was novel attempt to distinguish the strong characteristics of SMA against rutting by using a static loading test on the confined specimen. Considering changing trend of compaction, other confining method using gyratory compactor needs to be investigated in further study.
Ⅳ. Summary and Conclusions
It was known that an inferior test value was observed from the stone mastic asphalt (SMA) mix, which shows excellent rut resistance in the field pavement, by many high-temperature (60℃) test methods. Those methods include wheel tracking (WT), APA, Marshall stability, and Kim test. Therefore, a new test concept was devised for measuring the property that represents the strong nature of SMA mixtures against rutting at high temperatures in the laboratory. The Kim test technique measuring the deformation strength (S
D) was utilized for the confined specimen in the mold at 60℃.
According to the load and deformation analysis of the confined specimen in this study, it was found that the required load to create vertical deformation (v) of SMA mixes down to a certain depth was higher than that of dense-graded asphalt (DGA) mixture. In a ceratin deformation, it was found that the S
Dvalues of SMA were higher than those of DGA. This is a reasonable result, considering the principle that the aggregate skeleton was intact until v was less than a certain depth. The reason for this positive result is that the shear stress under this v level induced by the round-edge rod, which is pushed down into the mixture, is not strong enough to induce buckling of
0.0 0.2 0.4 0.6 0.8 1.0 1.2 1.4 1.6 1.8 2.0
0.0 0.7 1.4 2.1 2.8 3.5 4.2 4.9 5.6 6.3 7.0 7.7 8.4 9.1
v(mm) .
SD(MPa)
SMA-gneiss SMA-granite DGA-gneiss DGA-granite
Fig. 11 Vertical deformation (
v) by pressure (S
D) of SMA and DGA
0.0 0.5 1.0 1.5 2.0 2.5 3.0 3.5 4.0 4.5
0.0 0.5 1.0 1.5 2.0 2.5 3.0 3.5 4.0 4.5 5.0 v (mm)
SD ratio of SMA/DGA .
Gneiss Grnite