논문 2011-48SP-3-10
벼 병충해분할을 위한 색채공간의 비교연구
( A Comparative Study of Different Color Space for Paddy Disease Segmentation )
앨롬엠디 자한기르*, 이 효 종***
( Alom MD Zahangir and Hyo Jong Lee )
Abstract
The recognition and classification of paddy rice disease are of major importance to the technical and economical aspect of agricultural industry over the world. Computer vision techniques are used to diagnose rice diseases and to efficiently manage crops. Segmentation of lesions is the most important technique to detect paddy rice disease early and accurately.
A new Gaussian Mean (GM) method was proposed to segment paddy rice diseases in various color spaces. Different color spaces produced different results in segmenting paddy diseases. Thus, this empirical study was conducted with the motivation to determine which color space is best for segmentation of rice disease. It included five color spaces; NTSC, CIE, YCbCr, HSV and the normalized RGB(NRGB). The results showed that YCbCr was the best color space for optimal segmentation of the disease lesions with 98.0% of accuracy. Furthermore, the proposed method demonstrated that diseases lesions of paddy rice can be segmented automatically and robustly.
요 약
전 세계적으로 벼 병충해의 인식과 분류는 농업현장에서 기술적 경제적으로 중요한 요소이다. 컴퓨터 비젼 기술은 벼 병충 해를 진단하고 곡물의 효율적인 관리에 유용하다. 영역 분할은 벼 병충해를 조기에 정확하게 탐지하는데 매우 중요한 기술이 다. 가우시안 평균기법을 이용한 새로운 벼 병충해 분할 방식을 다양한 색체공간에서 제안하였다. 사용 색체공간에 따라 벼 병 충해의 분할에 따른 성능은 달라질 것이다. 따라서, 이 수치연구는 어느 색체공간이 벼 병충해를 분할하는데 최적한지를 결정 할 목적으로 수행되었다. 본 연구는 NTSC, CIE, YCbCr, HSV, 그리고 정규화 RGB의 5개의 색체공간을 다루었다. 연구 결과 는 YCbCr 색체공간이 98%의 정확도로 벼 병충해 영역을 최적으로 분할하는 것을 보여주었다. 또한 제안하는 방법은 벼 병충 해의 영역을 자동화에 의하여 강건하게 분할할 수 있다는 것을 증명하였다.
Keywords : Polar mean, circular features, Gaussian mean, rice disease
Ⅰ. Introduction
Paddy rice diseases may cause agricultural industry millions of dollar in damage. Ever since humans started farming, diseases have been one of
* 학생회원, 전북대학교 전기전자컴퓨터공학부 (Dept. of Electric, Electronic and Computer Engineering)
** 평생회원-교신저자, 전북대학교 컴퓨터공학부, 영상정보신기술연구센터
(Div. of Computer Science and Engineering, Chonbuk National University, CAIIT)
접수일자: 2010년12월27일, 수정완료일: 2011년3월2일
the major obstacles in maximizing production. There are numerous disease of paddy such as fungi, bacteria, viruses and nematode. Some diseases occur whenever paddy is grown. Some diseases reach epidemic proportion and cause serious crop losses where others cause only negligible crop losses. These diseases result in great economic losses to farmers every year[1]. It is important to note that disease symptoms of paddy rice diseases, such as paddy bacterial leaf blight, paddy sheath blight and paddy blast, appear initially as spots around the infected area. Hence, the detection of these diseases mainly
relies on their spots. At present, farmers or technicians mainly rely on their experiences, guide books and experts to identify these diseases. It is suitable for detecting some familiar and typical diseases. However, some different diseases can cause similar spots and the same disease can cause different spots because of different paddy varieties and local conditions. It increases the complexity of identifying paddy diseases. Misidentification usually leads to some inappropriate control measurements, such as indiscriminate and untimely use of pesticides In agricultural areas, numerous image-processing based computerized tools have been developed to help farmers to monitor the proper growth of their crops.
Some computer tools are used to discriminate between plants and other objects present in the field.
However, most researches have been focused on the treatment and control of weeds the area of disease control. For detecting paddy diseases early and accurately, some researches have used image processing and classification techniques for detecting diseases of agricultural or economic crops[2~12]. Nawala and Moratuwa[2] applied an image processing technique to detect crop diseases, but was weak in handling noise and difficult to find a proper threshold.
General approaches of these researches had similar steps. First, disease images are acquired using cameras or scanners. Second, lesions are segmented from non lesions part of the leaf. Finally, performance analysis is conducted where different color space with respect to the various kinds of paddy disease shape or texture features are segmented. There are two major difficulties in rice disease detection researches. One is that there are not many researches actively progressed in this area due to the complexity of the task. The other is the performance of those methods are not acceptable.
In this study, an accurate and optimal threshold-based segmentation method was developed to segment the five types of paddy rice diseases including brown spot (BS), cold damage (CD), paddy leaf blast (PLB), paddy bacterial leaf blight (PBLB),
and paddy sheath blight (PSB). The rest of this paper is organized as follows. Related researches with the proposed work are described in Section II.
Section III represents the proposed method for paddy disease segmentation for different color spaces. The proposed system results and discussion are discussed in Section IV. The conclusions of this work and about the future works are described in Section V.
Ⅱ. Related Works
The automatic paddy diseases analysis and recognition system is a developing task in the field of computer vision and machine learning. Agriculture is sometimes referenced as a weak theory domain, in which a large part of the reasoning knowledge is vague and described differently by various experts.
Though the entry points in reviewing a case among different experts could not be the same, the conclusion should be similar. The precedence factors related to outcome from different researcher's viewpoint also varies. During that time some expert system already developed by researcher. But all the existing system requires different input parameters manually that is related to color, texture, shape and others environment related informations. We are presenting some expert system for tomato[13], wheat[14], lime[15], cucumber[16], and orange[17] have been built using the developed methodology related to the machine learning.
Nawala and Moratuwa proposed CIE color model based system for crop disease[2]. Finding a proper threshold value was the most difficult part in their method. If the threshold value is too high, it could not classify pixels having small gray level difference.
In opposite cases the method became vulnerable to noise. Yao and Yang presented a system, which deployed shapes, colors and textures to detect paddy disease[3]. Otsu applied two threshold values to segment disease spots from the rice leaf[10]. RGB and HSV color models were used in Zhoo and Yao[4]. RGB color space is used for segmenting the rice
blast spots. In their method 2G-R-B images and spots were segmented from leaves base on R-G channels. CIELAB color spaces was also used to detect brown spot[5]. Various color spaces were used by the several proposed system.
Our goal is to develope a new method which dose not depend on complicate input parameters. The concepts of such kind of system discussed in [2-6].
In this paper the best color space is found for developing an accurate and robust system for paddy diseases. We have considered five color space including YCbCr and YIQ/NTSC. A Gaussian mean based segmentation method using a single threshold is proposed. A procedure to calculate the automatic threshold value is described in next section.
Ⅲ. Proposed Method
1. Different Color Spaces and their Relationship
As the segmentation of paddy rice diseases depends on color representation, it is important to understand the relationship among the different kinds of color space. Color spaces are different bases for representing intensity and color information in color images. Color spaces have multiple components or channels for representing all possible color and intensity information. For example RGB is a commonly used three dimensional color space with color channels of red, green, and blue. Different combinations of these three channels are capable to represent millions possible colors. In this experiments following five color spaces were considered including NTSC, CIE, YCbCr, HSV and NRGB (normalized RGB). The mathematical relationship of each of these color space was presented using RGB. Using the relationship of different color spaces to RGB, we can compute their relationship amongst each other such as tried in [13]. HSV describes colors in terms of the three quantities-hue, saturation, and value (HSV).The NTSC color space system consists of three components: luminance(Y), hue(I), and saturation(Q), where the choice of the letters YIQ is conventional.
The relationship with the RGB color space is given Equation (1):
(1)
The fundamental color space of the Commission internationale de I’Eclairage(CIE) and is the standard based on color matching experiments on human observers. It has a linear conversion from the RGB color.
(2)
YCbCr color space used by most image compression standards like JPEG, H.261 and MPEG has the following relation with the RGB color space.
(3)
The mathematical relation between HSV and RGB is given by Equation (4)
≤(4)
where cos
min
(5)
(6)
Relationship between HSV and RGB is non-linear demonstrated in [14].
Normalized RGB used by [13] to detect foreground objects and remove shadows is obtained as follows.
(7)
2. Gaussian Mixture Model
An image is a matrix which each element is a pixel. The value of the pixel is a number that shows intensity or color of the image. Gaussian Mixture Model (GMM) was applied to calculated the mean and deviation of paddy rice images in those five color spaces. For a probability model determination, we can suppose to have mixture of Gaussian distribution as the following form
(8)
where
k
is the number of regions and are weights such that
.
(9)
where and are mean and standard deviation.
For a given image X, the lattice data are the values of pixels and GMM is applied to the pixel-based model. The proposed system calculated the mean and deviation in linearly except for HSV color space. We have calculated polar mean for converting the non linear hue pixels elements to linear form.
3. Polar calculation of HSV color space
The polar mean has been calculated to convert the non-linear to linear system to the hue pixels of HSV images. The algebraic structure of the line and the circle are different and therefore adequate methods of circular data analysis and discussed in [22]. Contrast to the linear domain, only one operation of addition modulo is available in the circular domain. Due to the fact that the circle is a closed curve, its natural periodicity must be taken into account. As described in [21] a set ofN
angular estimates can be represented byN
unit phases with arguments equal to the corresponding angular estimates. The mean angle is then given by the argument of the phasor sum and this value is independent of thechoice of an origin. The general definitions of the circular mean and variance based on this phasor sum are of the following from.
Definition: Circular sample mean and sample variance: Let
→
be a set onN
observation of a random variable in the circular domain
. Then the circular sample mean and circular sample variance are defined by
arg
(10)
and
(11)
where denotes reduction modulo onto
. The circular variance , ∈
cannot be compared directly with its linear equivalent
which lies in the domain ∞. However, by using the relationship between the normal distribution on the circle and the normal distribution on the line a circular standard deviation in the range ∞ can be defined as
log
(12)
Therefore, when using statistical definition in the context of hue values, we always refer to the above definitions from polar statistics. The calculation procedure of polar mean for hue of the propose system given below:
i) Take the pixel values for hue of
and calculate the
, (13)
where cos and sin .
ii) are calculated from . iii) If data is dimensionless then
tan
(14)
Otherwise,
tan
(15)
where refers data dimension. We have calculated
and from , , and for saturation and value pixels of the respective images. The polar mean for hue color pixels of the respective input image is calculated according the Equation (13)∼(15).
Now take image to generate the new image
only for hue pixel as following:
(16)
Calculation of and was carried in a range to fit Gaussian from .
(17)
(18)
The values of and are in linear format.
Thus, the mean and deviation of hue are useful to calculate non-lesion and lesion means and their deviations using GMM for HSV color space.
Algorithm:
A Gaussian model calculates non-lesion, lesion means and their deviations from all the sample pixels of the input image. The model sets a lower bound and an upper bound that will eliminate pixels that are outside of the norm.
1)
To calculate Gaussian mean in of all color space for pixels we have used smaller data range to achieve faster calculation. Gaussian non-lesion and lesion means and their deviations were calculated for specific portion of data by using Gaussian Model for NTSC, CIE, YCbCr, and NRGB color spaces. We have used mean and deviation from Equation (17)∼(18) to calculate for hue and calculated Gaussian non-lesion and lesion means and their deviations
for specific portion of data by using
Gaussian Model for HSV color space.
2)
We compared with optimal threshold
to generate label of the lesions of the paddy leaf for all of the above mentioned color space. Calculation of an optimal threshold
is discussed in next section.4. Optimal threshold based on Gaussian model
Pixel deviation values that are higher than the threshold value considered as lesions, otherwise non-lesions. The input image contains some principle region and the distribution of pixel values in each region follows a Gaussian distribution.The proposed system uses the following algorithm for selecting the optimal threshold for this system:
1)
Find the histogram of the normalized image to be segmented.2)
Calculate the probability of a pixel value by the following mixture.
(19)
where
and
are probability distributions of non-lesions and lesions pixels.
and
are priori or a posteriori probabilities of non-lesions and lesions pixels.3)
Calculate overall probability of error:
(20)
where
∝
and
∝
4)
FindT
to minimize
, such as
, or
or (21)
TheT
found is the optimal threshold value to segment a lesion.Ⅳ. RESULTS AND DISCUSSIONS
1. Disease types
We have considered common paddy disease of the different areas over the world as experimental images. We have collected our experimental images from the Louisiana State University Auricular Center (www.lsuagcenter.com). We have considered paddy disease images with the environmental parts. The proposed system consists GM for segmentation of paddy diseases like BS, CD, PLB PBLB and PSB.
The brief descriptions are given below respectively.
BS (Cochliobolus miyabeanus) : called as brown spot. Round to oval, dark-brown lesions with yellow or gold halo.
CD (Cold temperature) : called as cold damage.
White band on leaf blade.
PLB (Pyricularia oryzae) : called as leaf blast.
Round dark spots to oval spots.
PBLB (Xanthomonas oryzae pv. Oryzae) : called as bacterial leaf blight. Elongated lesions near the leaf tip or margin.
PSB (Rhizoctonia solani) : called as sheath blight.
Wide bands of white, greenish-gray to tan with narrow bands.
2. Segmentation results
To examine the performance of the proposed method, 40 images were cropped from various kinds of diseases. We have considered lesions and real part of leaf which contains normal condition. During the experimental analysis of cropped images we focused lesions rather than normal part of the paddy leaf.
The experimental study and the performance analysis of our proposed method as follows:
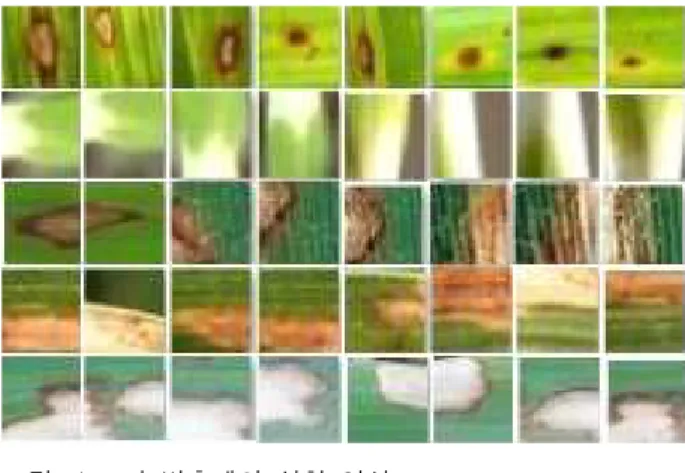
(1) Images database: Database has been constructed with cropped images for our experimental study. Using this database we analyzed the performance of our propose system. The size of the image was 30x30 and five images for the individual disease. Fig. 1 shows samples of database images.
그림 1. 벼 병충해의 실험 영상
Fig. 1. Sample images of paddy disease.
(2) Accuracy calculation: Segmentation results from different color spaces were compared to each other for diseases in database. To measure the performance of various color spaces for paddy disease detection test, the concepts of sensitivity and specificity are employed. These concepts are readily usable for the evaluation of any binary classifier. The accuracy of segmentation can be defined with true positive (TP), true negative (TN), false positive (FP) and false negative (FN) as Equation (22).
(22)
We have calculated accuracy using average pixels of
,
,
and
for five individual disease images in terms of percentage. Table I represents the average pixels and accuracy of our proposed method with respect to different color spaces and diseases.The proposed segmentation algorithm was able to segment the disease part of the paddy robustly and accurately. The performance of each color space for NTSC, CIE, YCbCr, HSV and NRGB are 88.2%, 91.1%, 98.0%, 94.3%, and 86.7%, respectively. The average performance of our proposed method with respect to color spaces is 91.7%. We have seen that the performance of YCbCr color space-based method accuracy was up to 98% for some specific cases, which is the highest performance among the all above mentioned color spaces.
Color
space DiseaseName TP (pixel) TN
(pixel) FP (pixel) FN
(pixel) Accuracy (%)
NTSC
BS 25 713 132 30 82.0
CD 126 531 230 13 73.0
PLB 217 661 16 6 97.6
PBLB 450 404 36 10 94.9
PSB 280 562 45 13 93.6
Average = 88.1
CIE
BS 32 747 94 27 86.5
CD 105 688 62 35 88.1
PLB 183 638 42 37 91.2
PBLB 450 403 35 12 94.7
PSB 256 599 37 8 95.0
Average = 91.1
YCrCb
BS 42 837 12 9 97.6
CD 120 770 5 5 98.8
PLB 211 677 7 5 98.6
PBLB 470 404 15 11 97.1
PSB 270 609 12 9 97.6
Average = 98.0
HSV
BS 43 803 42 12 94.0
CD 132 750 12 6 98.0
PLB 206 609 57 28 90.5
PBLB 428 411 48 13 93.2
PSB 250 612 23 15 95.7
Average = 94.3
NRGB
BS 28 684 155 33 79.1
CD 143 729 21 7 96.8
PLB 84 623 78 115 78.5
PBLB 226 540 92 42 85.1
PSB 263 583 36 18 94.0
Average = 86.7
표 1. 5종의 병충해 분할에 대한 각 컬러공간의 성능
Table 1. Segmentation performance of different color spaces for five types of diseases.
3. Comparison with other works
Due to the complexity of paddy disease images, the segmentation of disease lesions was not a trivial task. Furthermore, rice diseases are always mixed with even more complicated environmental images.
Other researchers applied a linear function to segment the disease spot. Their main target was also limited to a fewer number of diseases. Although various methods were presented, their performance was not efficient. The recognition accuracy of previous systems was around 70% that is depending
on their segmentation method and disease types, such as RRLB or RSB. However, a rice blast disease considered in Zhou and Yao was an exceptional case, which accuracy was 99.8%[4]. Our proposed method shows 91.64% average accuracy for five different types of paddy diseases. High accuracies of 98% and 95.7% were demonstrated for YCrCb and HSV color spaces, respectively. A proposed method may help other researchers to provide more accurate automatic disease analysis system in the sector of agriculture.
V. CONCLUSIONS
We have investigated five different color spaces of NTSC, CIE, YCbCr, HSV, and NRGB for their suitability in segmenting paddy rice diseases. A noble method of paddy disease segmentation method was presented. This work has empirically compared the suitability of different color spaces for segmentation of paddy disease. Every color space showed reasonably good performance from 86∼98%. Among those five color spaces, the YCbCr color space demonstrated the best result and proved itself as a suitable solution for paddy disease segmentation robustly and accurately. The Gaussian mixture model was proved to be a reliable method to find automatic threshold values for segmentation of paddy diseases.
The proposed method not only identified the different types of paddy diseases, but it could also be suitable for finding other diseases. In the future by using this segmentation results we will be able to provide a paddy disease diagnosis system, which will be robust and accurate. The next step for this research is to design an effective algorithm to find out the lesions of paddy rice disease as well as analyze the performance with existing segmentation algorithms like Otsu[10].
REFERENCES
[1] M.L.Gullino, and J.P. Stack, Crop Biosecurity Netherlands: pp. 25-36,Springer 2008.
[2] Nawala, and Moratuwa, “An Image Recognition System for Crop Disease Identification of Paddy fields in Sri Lanka,” Fourth International Conference on Industrial and Information Systems, ICIIS 2009, Sri Lanka, 28-31 Dec. 2009.
[3] Qing Yao, and Baojun Yang,“Application of support vector machine for detecting paddy disease using shape and color texture features,”
International Conference on Engineering Computation 2009. ICEC 2009.
[4] Yingfeng Zhou, and Qing Yao, “Segmentation of Paddy Disease Spots Based on Improved BPNN,” IASP10, pp.575-578, 2010.
[5] Libo Liu, and Guomin Zhou,“Extraction of the Rice Leaf Disease Image Based on BP Neural Networks,” International conference on. Issue ,pp.
1 – 3, China, 11-13 Dec. 2009.
[6] Santanu Phadikar and Jaya Sil, “Rice Disease Identification using Pattern Recognition Techniques,”Proceedings of 11 International Conference on Computer and Information Technology (ICCIT 2008),Khulna, Bangladesh., 25-27 Dec, 2008.
[7] D.Moshou, and H. Ramon, “Automatic detection of ‘yellow rust’ in wheat using reflectance measurements and neural networks,” Comput.
Electron. Agric., vol 44, no.3,pp.173-188, Sept.
2004.
[8] P.M. Granitto, and H.A. Ceccatto, “Large-scale investigation of weed seed identification by machine vision,” Comput. Etectron. Agric., vol.
47no.1, pp.15-24, Apr.2005.
[9] R. Pydipati, and W.S. Lee,“Identification of citrus disease using color texture features and discriminant analysis,” Comput. Electron. Agric, vol52,no.1, pp.49-59,June 2006.
[10] N. Otsu, “A threshold selection method from gray-level histogram,” IEEE Trans. CSAE, vol.23, no. 6, pp. 62-66, Jan. 1979.
[11] R.M. Haralick, and I. Dinstein, “Texture features for image classification,” IEEE Trans. Syst. Man Bybern., vol.3, no.6,pp.610-621, Nov. 1973.
[12] K.Y. Huang, “Application of artificial neural network for detecting phalaenopsis seedling disease using color and texture features,”
Comput. Electron. Agric., vol.57, no.1, pp.3-11, May 2007.
[13] EI-Shshtawy T.,A. and El-Az. E, “From Deperdence Networks to KADS: Implementation Issue,” in Proceedings of the 2nd Workshop on AI in Agriculture, Netherlands, 1995.
[14] Kamel A., and Sticklen J. “An Integrated Wheat Crop Management System Based on Generic Task Knowledge Based Systems and CERES Numerical Simulation,” AI Applications, vol. 9, no. 1, 1995.
[15] Refea M. and Rafea A.,“LIMEX: An Integrated Multimedia Expert System,” In Proceedings of the International Conference on Multimedia Modeling, Singapore, 1997.
[16] Rafea A.,and Mahmoud M.,“Experience with the Development and Deployment of Expert Systems in Agriculture,” in Proceeding of IAAI-95 Conference, Montreal-Canada, 1995.
[17] Salah A., and Farahat H., “CITEX: An Expert System for Citrus Crop Management,” in Proceedings of ESADW 93, MOALR, Cairo, Egypt,1993.
[18] Pankaj Kumar, and Surendra Ranganath “A Comparative Study of Different Color space for Foreground and Shadow Detection for Traffic Monitoring System,” IEEE 5th International Conference on Intelligent Transportation System, Singapore, September 2002.
[19] A. Camargo and J.S. Smith, “An image-processing based algorithm to automatically identify plant disease visual symptoms,” Biosystems Engineering, vol.102, pp.9-21, 2009.
[20] Gonzales and R. E. Woods.“Digital Image Processing,” Prentice Hall, 2002.
[21] K.V. Mardia, “Statistics of directional data.,”
Academic Press, London, 1972.
[22] B.C. Lovell, and R.C Williamson. “The circular nature of discrete-time frequency estimates,” In IEEE International Conference on ASSP, pp.
3369-3372, Toronto, May 1991.
[23] J. N. Kapur, and A.K.C. Wong,“A new method for gray-level picture threshodling using the entropy of the histogram,” Computer Vision Graphics Image Process. Vol 29, pp.273-285, 1985.
저 자 소 개
앨롬엠디 자한기르
(학생회원)2008년 방글라데쉬 University of Rajshahi 컴퓨터공학과 학사졸업.
2010년~현재 전북대학교 컴퓨터 공학과 석사과정 재학중.
<주관심분야 : Image processing, computer vision, communications>
이 효 종
(평생회원)-교신저자 1986년 미국 유타대학교 컴퓨터과학과 학사 졸업.
1988년 미국 유타대학교 컴퓨터 과학과 석사 졸업.
1991년 미국 유타대학교 컴퓨터 공학과 박사 졸업.
<주관심분야 : Image processing, computer vision, medical imaging, parallel processing>