• 검색 결과가 없습니다.

Survival of the Insulator under the electrical stress condition at cryogenic temperature

N/A
N/A
Protected

Academic year: 2021

Share "Survival of the Insulator under the electrical stress condition at cryogenic temperature"

Copied!
5
0
0

로드 중.... (전체 텍스트 보기)

전체 글

(1)

Progress in Superconductivity and Cryogenics

Vol.15, No.4, (2013), pp.10~14 http://dx.doi.org/10.9714/psac.2013.15.4.010

```

1. INTRODUCTION

High temperature superconducting (HTS) transformers are being developed in many countries because of their lighter weight, smaller volume, and higher efficiency than that of the conventional transformers as well as the ability to be overloaded without loss of insulation life, decreased environmental impact, and ease of siting [1, 2]. Recently, research for development and application of HTS transformers has been motivated and supported by the Applied Superconductivity Technology of 21st Century Frontier R&D Program in Korea [3].

HTS transformers designs consider various insulation factors, such as turn-to-turn, layer-to-layer, section-to-section, coil-to-tank and so on. Many researchers have investigated the dielectric characteristics of the insulation factors that are driven under high voltage and cryogenic temperature conditions[4, 5]. However, although the basis of winding insulation design is turn-to-turn insulation, sufficient useful data for practical insulation design has not been obtained. The turn-to-turn voltage is very low in the normal conducting state, but it is very high in the superconducting state. Thus, to achieve the most suitable insulation design for the HTS transformer operating at cryogenic temperature, it is important to evaluate the dielectric strength for insulation factors such as turn-to-turn. Also, for designing electrical insulation of HTS power apparatus, it is very important to know the voltage-time characteristics and breakdown characteristics of insulation materials as well as the degradation after breakdown [6-8]. Moreover, the voltage-time characteristic is one of the most important factors; being used, to establish

the testing level and estimate the lifetime of electrical insulation materials in electrical power devices.

Unfortunately, most research focuses on construction design, benefits, and testing of HTS transformer [9-11] and breakdown mechanism in gaseous and liquid nitrogen [12, 13]. There is a lack of research on breakdown characteristics and voltage-time characteristics of solid insulation in liquid nitrogen (LN 2 ) as well as the degradation of these composite insulations after breakdown.

Therefore, we investigated breakdown and voltage-time characteristics of point and surface contact geometry under AC and impulse high voltage in LN2 for turn-to-turn insulation design for HTS transformers immersed in LN2.

We also analyzed the electric field of the point contact geometry with the Maxwell program. The breakdown voltage is dependent on the number of layers as well as voltage configuration. Furthermore, we discussed lifetime indices n of the number of layers and different applied voltages. Moreover, the breakdown holes of the point contact geometry were not at the contact point at which the electric field is maximum value between turns.

TABLE I

P ARAMETERS OF E LECTRODE . Electrode Virgin

Cu tape

Insulated Cu tape Parameter 1 layer 2 layers 3 layers

t (mm) 0.3 0.36 0.42 0.49

w (mm) 4 4.23 4.29 4.39

Survival of the Insulator under the electrical stress condition at cryogenic temperature

Seung-Myeong Baek *, a and Sang-Hyun Kim b

a Department of Fire Protection Engineering, Changwon Moonsung University, Changwon 641-771, Korea

b Department of Electrical Engineering, Gyeongsang National University, Jinju660-701, Korea (Received 4 December 2013; revised 20 December 2013; accepted 21 December 2013)

Abstract

We have clearly investigated with respect to the survival of the insulator at cryogenic temperature under the electrical stress. The breakdown and voltage-time characteristics of turn-to-turn models for point contact geometry and surface contact geometry using copper multi wrapped with polyimide film for an HTS transformer were investigated under AC and impulse voltage at 77 K.

Polyimide film (Kapton) 0.025 mm thick is used for multi wrapping of the electrode. As expected, the breakdown voltages for the surface contact geometry are lower than that of the point contact geometry, because the contact area of the surface contact geometry is lager than that of the point contact geometry. The time to breakdown t 50 decreases as the applied voltage is increased, and the lifetime indices increase slightly as the number of layers is increased. The electric field amplitude at the position where breakdown occurs is about 80 % of the maximum electric field value. The relationship between survival probability and the electrical stress at cryogenic temperature was evident.

Keywords : Survival, Insulator, Electrical Stress, Cryogenic Temperature, Voltage-time characteristics, survival probability

* Corresponding author: smbaek@cmu.ac.kr

(2)

Seung-Myeong Baek and Sang-Hyun Kim

(a)

(b)

Fig. 1. The winding insulation models. (a) Point contact model and surface contact model (all unit: mm).

2. ERIMENTAL SETUP AND PROCEDURE Many models for turn-to-turn insulation tests for traditional transformers have been suggested. Among many methods, two methods have been selected. One is the surface contact method, and the other is the point contact method. Fig. 1 (a) and (b) show the turn-to-turn models.

The turn-to-turn insulation models use impregnated film insulation. In this experiment, the turn-to-turn insulation models were made by a square-section copper tape (0.3 mm×4 mm) which is wrapped with Kapton tape (0.025 mm×10 mm). In order to study the relation between the insulation strength of liquid-film and the film thickness, the number of tapes wrapping the copper tape is varied (1, 2 or 3). One end of each sample had the conductor insulation removed to make the electrical connection to the test voltage or to ground. The copper was wrapped by the Kapton film for a 30 % over-wrapping method. A range of total insulation thickness was chosen in the winding test to develop design information across the spectrum of thicknesses used in LN 2 -filled HTS transformers. As shown Table I, the three thicknesses of insulated Cu tape used in this series were 0.36 mm, 0.42 mm and 0.49 mm.

The model was set in a FRP cryostat of LN 2 in the innermost layer of the cryostat with a high voltage bushing.

The outer layer is extracted by about 10 -6 torr to prevent the temperature ride of the LN 2 . In this experiment, an ac power source (KYONAN ELECTRIC CO., LTD, MODEL: YPAS-01100, 0-100 kV) was used and impulse voltage tester system, which made of Dae Yang Electric CO., LTD (1.2×1.5 ㎲, 400 kV, 15 kJ). The high voltage lead was connected to the one copper electrode, and the other copper electrode was connected to ground. The AC voltage is raised at 1 kV rms /sec until breakdown occurred.

In case of impulse breakdown test, we used the step-up

method for insulation test. A voltage that is estimated to be 70 % of the breakdown value was applied to the test object.

The impulse voltage was then increased in steps of 4 kV until a breakdown occurred. The AC and impulse breakdown voltage (BDV) plotted in the figures is determined as the mean value of at least ten breakdown voltages and the range of measured maximum and minimum breakdown voltages is denoted by a vertical solid lines.

3. RESULTS AND DISCUSSION 3.1. Breakdown and voltage-time characteristics

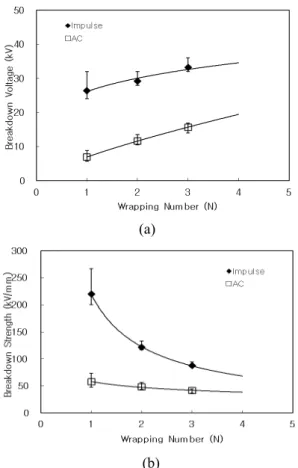
Fig. 2. (a) and (b) present the breakdown voltage and strength under AC and impulse voltage at 77 K. The lines were obtained by averaging the data for each wrapping number and then applying those averages to a linear progression equation to get an average failure line.

As shown in Fig. 2, the breakdown voltage increases nonlinearly versus the wrapping number and the standard deviation of the breakdown voltage is nearly the same as the number of layer increases. However, the breakdown strength was decreased versus the wrapping number. Fig. 2 and 3 also show that the breakdown voltage of the point contact model is higher than that of the surface contact

(a)

(b)

Fig. 2. (a) AC and impulse breakdown voltage and (b)

strength of the point contact model at 77 K.

(3)

Survival of the Insulator under the electrical stress condition at cryogenic temperature

(a)

(b)

Fig. 3. (a) AC and impulse breakdown voltage and (b) strength of the surface contact model.

model under impulse as well as AC voltage. These results can be explained as follows. If the contact area in the model is increased, the number of weak spots also increases. Thus, in the surface contact model it is considered that the breakdown voltages are lower than these of the point contact model because the contact area of the surface contact model is larger than that of point contact model.

Fig. 4 and Fig. 5 show voltage-time characteristics of the models for 2 and 3 wrapping layers under AC voltage. It is seen that the time to breakdown t 50 decreases as the applied voltage increases, and the lifetime indices slightly increase as the number of layers increase. Thus, the slope of the voltage-time characteristics is slightly dependent on applied voltage as well as the number of layers.

In Fig. 4, n=27.54 and n=30.58 were obtained in LN 2 on 2 and 3 layers, respectively. Also in Fig. 5, n=14.47 and n=27.10 were obtained in LN 2 on 2 and 3 layers, respectively. In the case of the point contact model, the n value is similar. However, in the case of the surface contact model, the n value is different. As referred to above, this result is considered that an electrode effect of the breakdown voltage increased according to the increase of the contact area. The relation between the breakdown voltage and the time to breakdown t 50 of the point contact model for 2 layers and 3 layers is shown by equations (1) and (2), respectively.

58 . 30 / 50 1

37 . 16

= t

BDV (1)

0 5 10 15 20

1.E+00 1.E+02 1.E+04 1.E+06

Time to Breakdown (sec)

B re a k d o w n V o lt a g e ( k V )

3 layers 2 layers

n=30.58 n=27.54

Fig. 4. Relationship of time to breakdown and breakdown voltage of the point contact model.

0 5 10 15 20

1.E+00 1.E+02 1.E+04 1.E+06

Time to Breakdow n (sec)

B re a kd o wn V o lt a g e ( kV )

3 layers 2 layers

n=27.10 n=14.47

Fig. 5. Relationship of time to breakdown and breakdown voltage of the surface contact model.

53 . 27 / 50 1

34 . 15

= t

BDV (2)

Similarly, the breakdown voltage of the surface contact model can be expressed by equations (3) and (4), respectively.

1 . 27 / 50 1

59 . 16

= t

BDV (3)

47 . 14 / 50 1

67 . 13

= t

BDV (4) In the case of the 15 kV applied voltage the micro cracks are longer and deeper compare to 13 kV applied voltage.

However for 13 kV applied voltage, the micro cracks are denser than those of the 15 kV applied voltage. This can be explained that when the applied voltage is higher, the electric stress is larger and the time to breakdown is smaller and vice versa. With the higher electric stress and smaller breakdown’s time, the micro cracks will be deeper and longer but less dense.

3.2. Survival and hazard analysis

Probability distributions are a fundamental concept in

statistics. They are used both on a theoretical level and a

practical level. Probability distributions are typically

(4)

Seung-Myeong Baek and Sang-Hyun Kim

defined in terms of the probability density function.

However, there is a number of probability functions used in applications. Especially, survival probability and hazard rate have been used an index of reliability.

For a continuous function, the probability density function is the probability that the variate has the value x.

Since for continuous distributions the probability at a single point is zero, this is often expressed by equation (5) in terms of an integral between two points.

b f ( x ) dx P T [ a X b ]

a = ≤ ≤

∫ (5) Survival functions are most often used in reliability and related fields. The survival function is the probability that the variate takes a value greater than x.

) ( 1 ] [ )

( x P X x F x

S = T  = − (6) The hazard function is the ratio of the probability density function to the survival function, S(x).

) ( 1

) ( ) (

) ) (

( F x

x f x S

x x f

h = = − (7) Fig. 6. (a) and (b) show survival probability under 3 layers of point contact and surface contact model. For

(a)

(b)

Fig. 6. The survival probability of (a) point contact model and (b) surface contact model for 3 layers.

example in Fig. 6. (a), survival probabilities are 51.8 % at 1000 seconds and 22.6 % at 2000 seconds under 13 kV, respectively. As the applied voltage is increased, the survival probability is decreased and as the applied voltage is increased, the hazard rate is increased at all times.

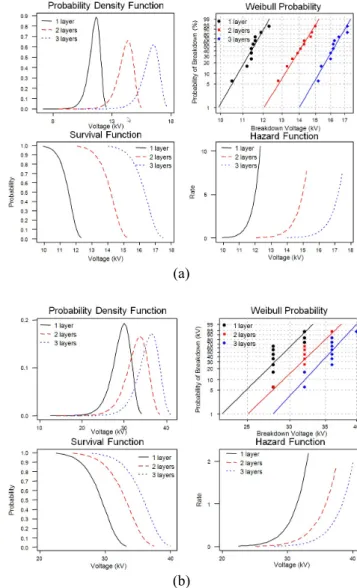
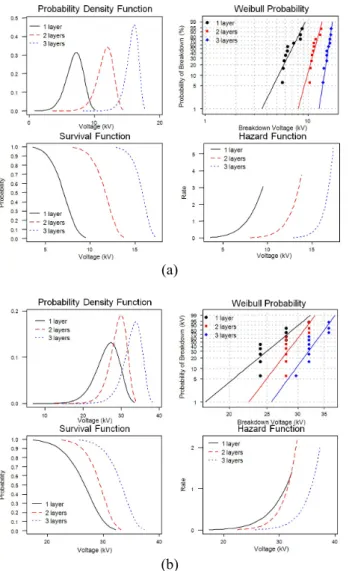
The overall survival estimates for the point contact and the surface contact model within the total observation are shown in Fig. 7 and Fig. 8, respectively. As the wrapping number is increased, the survival probability is increased.

For example, in Fig. 7. (a), the survival probability (84 %) under 11 kV at 1000 seconds is higher than the survival probability (17 %) under 12 kV at 1000 seconds. In Fig. 8.

(a) and (b), the survival probability (2 %) for 2 layers under 13 kV is lower than the survival probability (48 %) for 3 layers under 13 kV at 1000 seconds. Therefore, both electrical stress and wrapping number have a significant effect on the survival provability. It is also clear that the increasing electrical stress leads to the reduced breakdown initiation time.

(a)

(b)

Fig. 7. Overall survival analysis for the point contact

model under (a) AC and (b) impulse voltage.

(5)

Survival of the Insulator under the electrical stress condition at cryogenic temperature

(a)

(b)

4. CONCLUSION

Electrical breakdown, voltage-time and survival characteristics were investigated with the simulated electrode system for winding insulation. The main results are summarized as follow:

As the number of layer is increased, the breakdown voltage of the models is increased proportionally. Lifetime indices n of the point and surface contact model decreased from 30.58 for the 3 layers to 27.58 for 2 layers and from 27.1 for 3 layers to 14.47 for 2 layers, respectively. Thus, the slope of the V-t characteristics increases slightly as the number of layers is increased.

The breakdown holes and erosion areas of the point contact model do not occur at the contact line or contact point, which have the maximum value of electric field.

They occurred inside the erosion area or around the boundary between the erosion areas because of the partial discharge and the degradation of the erosion areas depend on the applied voltage.

The survival probability is increased as the increasing wrapping number and/or decreasing applied voltage. The

increasing electrical stress and decreasing number of layers lead to reduced breakdown initiation time. Therefore, both electrical stress and wrapping number have a significant effect on the survival probability.

REFERNCES

[1] B.W McConnell, “Transformers - A successful Application of High Temperature Superconductors,” IEEE Trans. Appl. Supercond., Vol. 10, No. 1, pp. 716-720, 2000.

[2] S.W.Schwenterly, et al, “Development of HTS power transformers for the 21st century: Waukesha Electric Systems/IGC-SuperPower/RG&E/ORNL SPI collaboration,”

Physica C 382, pp. 1-6, 2002.

[3] H.M Chang, et al, “Cryogenic cooling temperature of HTS transformers for compactness and efficiency,” IEEE Trans. Appl.

Supercond., Vol. 13, No. 2, pp. 2298-2301, June 2003.

[4] H. G. Cheon, S. M. Baek, D. S. Kwag, and S. H. Kim, “Comparison of insulation test of mini-models with different winding for a HTS transformer,” IEEE Trans. Appl. Supercond., vol. 16, no. 2, pp.

497–1500, 2006.

[5] E. Tuncer, G. Polizob, I. Sauers and D. R. James, “Electrical insulation paper and its physical properties at Cryogenic Temperatures,” IEEE Trans. Appl. Supercond., vol. 21, pp. 1438 –1440, 2011.

[6] M. Kosaki, M. Nagao, N. Shimizu, and Y. Mizuno, “Solid Insulation and Its Deterioration,” Cryogenics, vol.38, no. 11, pp.

1095-1104, 1998.

[7] T. Suzuki, K. Kishi, T. Uozumi, K. Yatsuka, N. Yashuda, T. Fukui,

“Study on V-t Characteristics for XLPE Cable,” Proceeding of the 1994 IEEE power Engineering Society, pp. 192-199, April 1994.

[8] H. Okubo, M. Hikita, H. Goshima, H. Sakakibara, N. Hayakawa,

“High Voltage Insulation Performance of Cryogenic Liquids for Superconducting Power Apparatus,” IEEE Trans. on Power Delivery, vol. 11, no. 3, pp. 1400-1406, July 1996.

[9] C. T. Reis, S. P. Mehta, B. W. Mc Connell, R. H. Tones,

“Development of High Temperature Superconducting Power Transformers,” IEEE power engineering society winter meeting, vol. 1, pp. 151-156, 2002.

[10] T.L. Baldwin, J.I. Ykema, C.L. Allen, J.L. Langston, “Design Optimization of High Temperature Superconducting Power Transformers,” IEEE Trans. Appl. Supercond., vol. 13, no. 2, pp.

2344-2347, 2003.

[11] H. J. Lee, G .S. Cha, J. K. Lee, K. D. Choi, K. W. Ryu, S. Y. Hahn,

“Test and characteristic analysis of an HTS power transformer,”

IEEE Trans. Appl. Supercond., vol. 11, no. 1, pp. 1486-1489, 2001.

[12] S. M. Baek, J. M. Joung, J. H. Lee, S. H. Kim, “Electrical Breakdown Properties of Liquid Nitrogen for Electrical Insulation Design of Pancake Coil Type HTS Transformer,” IEEE Trans. Appl.

Supercond., vol. 13, no. 2, pp. 2317-2320, 2003.

[13] J. M. Joung, S. M. Baek, C. S. Kim, S. H. Kim, “Electrical Insulation Characteristics in The Simulate Electrode System of HTS Double Pancake Coil,” IEEE Trans. Appl. Supercond., vol. 13, no.

2, pp. 2321-2324, 2003.

Fig. 8. Overall survival analysis for the surface contact

model under (a) AC and (b) impulse voltage.

수치

Fig. 2. (a) and (b) present the breakdown voltage and  strength under AC and impulse voltage at 77 K
Fig. 4 and Fig. 5 show voltage-time characteristics of the  models for 2 and 3 wrapping layers under AC voltage
Fig.  7. Overall survival analysis  for the point contact  model under (a) AC and (b) impulse voltage
Fig.  8. Overall survival analysis  for the surface  contact  model under (a) AC and (b) impulse voltage

참조

관련 문서

under the transient condition using the Lock-in infrared thermography and predict the stress value and the dynamic stress concentration factor based on the

And we introduce you to the terminal caracteristics, and linear and lumped constant characteristics about electric circuit elements, which are voltage source,

3.3 Measured current-voltage waveform and high-speed camera images during the constant voltage DC-AC pulse tandem GMAW welding · · · ·20 Fig.. 3.4 Comparison of

The rectifier is a circuit that acts as a dc voltage source by converting the ac voltage from a standard wall outlet to a dc voltage. This voltage is effectively applied

• Under the assumption of equilibrium conditions, and knowing the composition of the fluid stream coming into the separator and the working pressure and temperature

• Symmetric beams under the action of arbitrary loadings which are in the plane of symmetry and oriented normal to the center line of the beam. •

In this paper, the power line characteristics as the view point of communication channel are investigated and the technologies of PLC are proposed to

4.3 Simulation results of the proposed dual output converter for increasing of voltage command during operation (a) Boost Voltage (b) Buck Voltage (c)