pISSN 1229-3008 eISSN 2287-6251
Progress in Superconductivity and Cryogenics
Vol.17, No.4, (2015), pp.8~11 http://dx.doi.org/10.9714/psac.2015.17.4.008
```
1. INTRODUCTION
The doping of 3d transition-metal (TM) ions has been widely used to tune the electronic properties of semiconductors and oxide insulators [1]. In particular, TM ions have been frequently used as optically active dopants in commercial phosphors and in tunable solid state lasers.
The 3d states of TM ions are positioned as intermediate states within the fundamental bandgap of the host material and can result in the emergence of useful optical properties.
The 3d orbitals in TM ions have a relatively large radius and are unshielded by outer shells, and resultantly, strong ion–lattice coupling tends to occur in TM ions. Indeed, the spectra of TM ions present both broad and sharp bands, depending on host materials. This is in stark contrast to the spectra of rare earth ions with valency of +3, which only showed sharp bands solely irrespective of host materials [2].
The Cu ion has been widely used for its capability to induce a novel visible emission for the group II-VI semiconductors, ZnO, photonic crystal fiber, and so on, in addition to ferromagnetism [3-5]. In this research, we newly synthesized Cu-ion-doped SrHfO3 (SHO:Cu) compounds and investigated their electronic properties.
The 5d0 band insulator perovskite SrHfO3 has attracted much attention as novel electronic material with high temperature, high-K, and good electro-optical properties [6]. In the SHO:Cu compounds we found that the visible range of photoluminescence (PL) depends strongly on the photo-excitation energy, changing the emission color from
orange to violet. This intriguing behavior is in accord with the photoluminescence excitation (PLE) spectra which changes with the emission energy. We compare our findings with the case of similar materials, SrTiO3 and SrZrO3 with the Cu ion doping.
2. EXPERIMENT
We synthesized the SHO:Cu polycrystalline samples in the solid state reaction method. We mixed raw materials, SrCO3 and HfO2, in a 1:1 ratio and calcinated them at 900C for 12 hours. Then we mixed the calcinated SrHfO3 (1-x) with CuO (x), and sintered them at 1400C for 40 hours [7]. The nominal doping concentration, x, of the Cu ion in SrHfO3:Cu were 0,005, 0.01, 0.02, and 0.1.
For structural analysis, X-ray diffraction (XRD) patterns were measured using a Bruker-AXS Discover D8 system with a Cu target X-ray tube. The X-ray beam was focused to a parallel beam by using a Gobel mirror. In order to investigate the valence state of Cu ions in host material SrHfO3, we performed Cu 2p X-ray photoelectron spectroscopy (XPS) measurements.
The samples were scraped in situ by a diamond file under a pressure of ~5 x 10⁻¹⁰ Torr at room temperature. The photoelectrons excited with an Al K X-ray source (h = 1486.6 eV) were analyzed by a commercial electron spectrometer (SES 100) with 100 meV pass energy mode.
The ultraviolet–visible luminescence excitation and emission spectra were recorded with a JASCO FP-8500 spectrofluorometer equipped with xenon lamp as the excitation source at room temperature.
Study on visible emission of Cu-ion-doped perovskite hafnate in view of excitation energy dependence
D. J. Leea, Y. S. Lee*, a, and H. J. Nohb
a Soongnsil University, Seoul, Korea
b Chonnam National University, Gwangju, Korea
(Received 16 November 2015; revised or reviewed 22 December 2015; accepted 23 December 2015)
Abstract
We studied on the visible emission of Cu-ion-doped perovskite hafnate SrHfO3 (SHO:Cu) with the photo-excitation energy dependence. The polycrystalline SHO:Cu samples were newly synthesized in the solid state reaction method. From the X-ray diffraction measurement it was found that the crystalline structure of SHO:Cu is nearly identical to that of undoped SrHfO3. Interestingly, the photoluminescence excitation (PLE) spectra change significantly with the emission energy, which is linked to the strong dependence of the visible emission on the photo-excitation energy. This unusual emission behavior is likely to be associated with the mixed valence states of the doped Cu ions, which were revealed by X-ray photoelectron spectroscopy. We compared our finding of tunable visible emission in the SHO:Cu compounds with the cases of similar materials, SrTiO3 and SrZrO3 with Cu-ion-doping.
Keywords: Visible emission, Cu-ion doping, SrHfO3, Photoluminescence
* Corresponding author: [email protected]
D. J. Lee, Y. S. Lee, and H. J. Noh
Fig. 1. (Color online) X-ray diffraction -2 scans for the SrHfO3:Cu polycrystals for various x values. The JCPDS data are displayed for SrHfO3 (45-0211), CuO (44-0706), and Cu2O (05-0667) for the purpose of comparison.
3. RESULTS AND DISCUSSION
3.1 Structural Property
Figure 1 shows the XRD patterns of our SHO:Cu samples with x = 0.01 and 0.1. For comparison we displayed the XRD pattern of SrHfO3, CuO, and Cu2O from the JCPDS database. The observed XRD peaks of SHO:Cu correspond well to those of the undoped SrHfO3 with the orthorhombic perovskite structure [8, 9]. This indicates that the Cu ion doping does not change the overall crystal symmetry from the undoped compound. On the other hand, we do not see the existence of Cu-oxide phases. We could not find any peak of the CuO phase. While the Cu2O (111) peak may be overlapped with the SrHfO3 (211) peak at 2 = 36.5, the second major peak, Cu2O (200) was not identified near 2 = 42.3 in the SHO:Cu data.
3.2 X-ray Photoelectron Spectroscopy Analysis
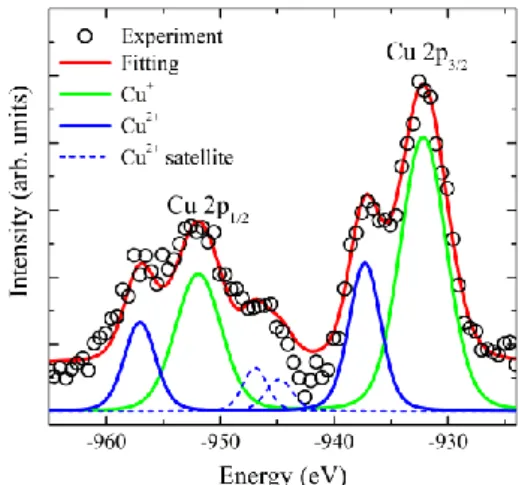
To figure out the valence state of the doped Cu ions, we performed the x-ray photoelectron spectroscopy on SHO:Cu at x = 0.1. Figure 2 shows the spin-orbit-split Cu 2p3/2,1/2 XPS spectrum (open circles) with a curve fitting result. Each spin-orbit-split structure is decomposed into two components, monovalent peak and divalent peak. The main component (green line) of the spectrum in the 2p3/2 region corresponds to the monovalent (Cu+) state at ~ 932 eV [10]. The photo-emitted final state of the monovalent Cu ions has no hole in the 3d orbitals (2p3d10), so their photoemission spectra do not show a multiplet structure. In contrast, the divalent peak (blue line) at ~ 937 eV appears with a satellite structure (dotted line) located at ~ 8 eV higher binding energy, since the core hole (J=3/2) in the
Fig. 2. (Color online) X-ray photoelectron spectroscopic data of Cu 2p3/2 (~ 933 eV) peak of SHO:Cu at x = 0.1. The open circle symbol represents the experimental data. The red lines are the sum of two peaks modeled as a Voight profile according to the +1 (Cu+) (green) and +2 (Cu2+) (blue) charge states. The dotted lines represent the satellite peaks for Cu2+.
2p3/2 level interacts with the one hole in the 3d orbitals (3d9, J = 5/2 or 3/2) to form a multiplet structure with eight final states corresponding to total angular momentum J = 4 ~ 0 in J-J coupling with neglecting the crystal electric field [11].
In general, the spectral shape of the multiplet structure looks like double peaks, so in our curve fitting we used double Voight profiles with a peak width of 2.5 eV in FWHM to simulate the satellite structure. The weight ratio of the divalent peak to the monovalent one is ~ 0.38, which means one out of four doped copper ions in SrHfO3 exists in the divalent form. This value is quite similar to the case of SrZrO3:Cu [12].
3.3 Photoluminescence Excitation Spectra
To examine the change in the electronic structure due to Cu-ion doping, we performed photoluminescence excitation spectroscopy (PLE) on our samples. Figure 3 displays the PLE spectra of SHO:Cu obtained by monitoring the Eem = 2.07 eV and 3.1 eV emission at room temperature. As shown in Fig. 3(a), the spectra for the emission at Eem = 2.07 eV are composed of two peaks located near 3.5 eV and 4.2 eV, in addition to the abrupt increase above 5 eV. The strong absorption above 5 eV is attributed to the charge transfer excitation from the O 2p to the Hf 5d band, which has been reported to be centered at 7.5 eV [13]. As shown in Fig. 3(b), on the other hand, the PLE spectra for the emission at Eem = 3.1 eV exhibit a distinct peak near 5 eV, which is distinguished from the lower energy peaks near 3.5 eV and 4.2 eV in Fig. 3(a).
While it is strange for the PLE spectra to show the strong dependence on the emission energy, evidently, the three structures near 3.5 eV, 4.2 eV and 5 eV are attributed to intermediate Cu 3d states formed within the bandgap.
9
Study on visible emission of Cu-ion-doped perovskite hafnate in view of excitation energy dependence
Fig. 3. Photoluminescence excitation spectra of SHO:Cu by monitoring at Eem = 2.07 eV (a) and 3.01 eV (b) at room temperature.
Another notable point is that the Cu ion doping dependence of the PLE spectra is rather anomalous.
Regarding the excitation peaks below 5 eV, their intensities at x = 0.005 is smallest. In contrast, the peaks near 5 eV showed a reverse doping dependence: their intensities decreased with the increased x. This different Cu-ion doping dependence indicates that the 3.5/4.2 eV and 5 eV excitations should involve a different emission mechanism.
It is noted that as confirmed by the XPS data in Fig. 2, the Cu ions have the mixed valence states of +1 and +2. It has been known that the 3d state for the Cu+ (d10) ion is formed just above the valence band, while that of the Cu2+
(d9) ion is located at a higher energy level [3]. More interestingly, for the Cu2+ (d9) ions the Cu 3d-orbitals should be divided into two levels, T2 and E in the octahedral site by the energy (CF) of the crystal field splitting caused by neighboring anions [14]. In this case, the E level is at a higher energy than the T2 level. According to this idea, we attribute the features near 3.5 eV and 4.2 eV to the Cu2+ 3d state (Figs. 3(a)). The distinct peak near 5 eV can be assigned as a transition from the Cu+ acceptor state to the conduction band in Figs. 3(b) [5].
3.4. Photoluminescence spectra
Motivated by the anomalous PLE spectra of SHO:Cu, we performed the PL spectroscopy on our samples with the excitation energy (Eex) dependence. The PL emission spectra for the SHO:Cu samples were obtained with three different excitations, Eex = 3.40 eV (ex = 365 nm), 3.82 eV ( 325 nm), and 4.96 eV ( 250 nm). The results are displayed in Fig. 4. As shown in Fig. 4(a), with the Eex = 3.4 eV photoexcitation, our doped samples show distinct a visible emission near 2.1 eV (orange). With the increased
Fig. 4. (Color online) Room temperature PL spectra of SHO:Cu with the photo-excitation of (a) Eex = 3.4 eV, (b) Eex = 3.82 eV, and (c) Eex = 4.96 eV.
Eex to 3.82 eV, an additional peak at 2.61 eV (green) develops. At a higher Eex (Eex = 4.96 eV), the violet emission centered at 3.1 eV is predominant over the two orange and the green emissions. These results mean that the multicolor emission can be obtained from orange to violet with respect to Eex.
It is interesting to see the doping dependence of PL. As shown in Figs. 4(a) and 4(b), the orange/green emission at the low energy photoexcitation (Eex < 4 eV) develops with the increased x up to 0.02, but at higher x, their intensities decreases. This implies that the concentration of the luminescence quenching is between 0.02 and 0.1. In contrast, the violet emission intensity is strongest at the lowest x value, x = 0.005 (Fig. 4(c)). An extremely small quenching concentration has been observed in other TM doped systems [15].
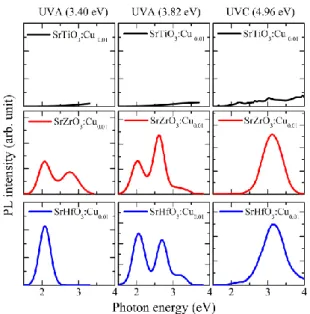
3.5 Comparison with SrTiO3
We compare the emission behavior of SHO:Cu with the case of the similar materials, SrTiO3 and SrZrO3 with the Cu ion doping. We synthesized the Cu-ion-doped SrTiO3 in the same method for the current samples, and measured their PL spectra. The PL data of the doped SrZrO3 were quoted from our works [12]. Interestingly, the Cu-ion doped SrTiO3 does not show any significant visible emission. On the other hand, the Cu-ion doped SrZrO3 shows the PL spectra quite similar to the case of SHO:Cu. It appears that the visible emission by the Cu ion doping is in accord with a wide bandgap of oxides.
10
D. J. Lee, Y. S. Lee, and H. J. Noh
Fig. 5. PL spectra of (a) SrTiO3, (b) SrZrO3, and (c) SrHfO3 with the Cu ion doping (x = 0.01).
4. SUMMARY
We studied on the visible emission of SHO:Cu with the photo-excitation energy dependence. The visible emission was found to change from orange to violet with increased excitation energy from UVA to UVC, which might be applied to UV sensing with spectral resolution. The tunable emission appears to be common for a very wide bandgap of d0 transition metal oxides.
ACKNOWLEDGMENT
This research was supported by Basic Science Research Program through the National Research Foundation of Korea (NRF) funded by the Ministry of Science, ICT and Future Planning (NRF-2013R1A2A2A01068567 and NRF-2013R1A1A2058195).
REFERENCES
[1] P. A. Cox, Transition metal oxides: An introduction to their electronic structure and properties, Clarendon, Oxford, 1992.
[2] J. Garcia Sole, L. E. Bausa, and D. Jaque, An introduction to the optical spectroscopy of inorganic solids, John Wiley & Sons Ltd., 2005.
[3] Bhupendra B. Srivastava, Snatanu Jana, and Narayan Pradhan, J.
Am. Chem. Soc., vol. 133, pp. 1007, 2010.
[4] Zaheer Ahmed Khan, Abhishek Rai, Sudipta Roy Barman, and Subhasis Ghosh, Appl. Phys. Lett., vol. 102, pp. 022105, 2013.
[5] Hicham El Hamzaoui, Youcef Ouerdane, Laurent Bigot, Geraud Bouwmans, Bruno Capoen, Aziz Boukenter, Sylvain Girard, and Mohamed Bouazaoui, Opt. Express, vol. 20, pp. 29751, 2012.
[6] D. H. Kim and Y. S. Lee, J. Korean Phys. Soc., vol. 61, pp. 444, 2012.
[7] D. J. Lee, D. H. Kim, M. H. Cho, and Y. S. Lee, J. Korean Phys. Soc., vol. 63, pp. 2185, 2013.
[8] G. Fabricius, E. L. Peltzer y Blanca, C. O. Rodriguez, A. P. Ayala, P.
de la Presa, and A. Lopez Garcı´a, Phys. Rev. B, vol. 55, pp. 164, 1997.
[9] R. Vali, Solid State Commun., vol. 148, pp. 29, 2008.
[10] B. Balamurugan, B. R. Mehta, D. K. Avasthi, Fouran Singh, Akhilesh K. Arora, M. Rajalakshmi, G. Raghavan, A. K. Tyagi, and S. M. Shivaprasad, J. Appl. Phys., vol. 92, pp. 3304, 2002.
[11] G. van der Laan, C. Westra, C. Haas, and G. A Sawatzky, Phys. Rev.
B, vol. 23, pp. 4369, 1981.
[12] D. J. Lee et al., unpublished.
[13] D.J. Lee, Y.K. Seo, Y.S. Lee, and H.-J. Noh, Solid State Commun., vol. 150, pp. 301, 2010.
[14] Mark Fox, Optical properties of solids, Oxford University Press, 2011.
[15] M. Aoyama, Y. Amano, K. Inoue, S. Honda, and S. Hashimoto, J.
Lumin., vol. 136, pp. 411, 2013.
11