Numerical Analysis on Behaviors of Very Soft Ground Improved by Geotextile
토목섬유로 개량된 초연약지반의 거동에 관한 수치해석
안 동 한
1Ahn, Dong-Han 유 승 경
2* You, Seung-Kyong
ABSTRACT
In generally, ground surface strengthening such as using geotextile is needed to secure trafficability of construction equipment.
Several calculation methods for bearing capacity for very soft ground improved by geotextile have been proposed already but they are not established yet. In this paper, elastoplastic finite element analysis is carried out to estimate bearing capacity improvement for very soft ground reinforced by geotextile. In conclusion, by reinforcing with geotextile the bearing capacity improvement of very soft ground is increased with the increase of the settlement after yielding. And it is enough that the length of geotextile is about 3~4 times of the loaded width for the effect to the bearing capacity improvement. Finally, the biggest tensile force of geotextile occurs at an edge of the uniform load.
요 지
최근 우리나라에서 활발히 진행되고 있는 준설매립 공사에서는 일반적으로 시공 장비의 주행성을 확보하기 위한 표층처리공법
으로써 지오텍스타일을 부설하는 경우가 많다. 지오텍스타일이 부설된 초연약점토지반의 지지력의 계산은 기존에 몇 가지 제안
되어 있지만 아직 명확히 확립되어있지 않기 때문에 시공실적에 기초한 경험적인 방법이 사용되고 있는 실정이다. 본 논문에서
는 지오텍스타일이 부설된 초연약지반의 합리적인 지지력 산정방법 확립의 일환으로 일련의 수치해석을 실시하였다. 수치해석
결과 초연약지반의 표층을 지오텍스타일로 보강함으로써 초연약지반의 항복 후에도 개량된 지반의 지반응력은 증가함을 알
수 있었으며 지요텍스타일에서 발생되는 최대인장응력은 하중이 증가함에 따라 재하 끝단부에서 크게 발생됨을 알 수 있었다.
Keywords : Very soft ground, Geotextile, Surficial reinforcement, Bearing capacity, Numerical analysis 한국토목섬유학회논문집 제8권 3호 2009년 9월 pp. 9 ∼ 16
J. Korean Geosynthetics Society Vol.8 No.3 September. 2009 pp. 9 ~ 16
1 비회원, 오사카대학 토목공학과 대학원 박사과정 (Non-Member, Graduate Student, Department of Civil Engineering, Osaka University, Japan) 2* 정회원, 명지전문대학 토목공학과 부교수 (Member, Associate Professor, Department of Civil Engineering, Myongji College
E-mail: [email protected])
1. Introduction
Reclamation has been conducted actively in coastal regions to expand large scale ports, airports, new towns, industrial complexes and agricultural fields by spreading sand or clay on the very soft ground in recent years.
Reclamation was usually conducted using ground soil in adjacent areas of the construction sites in the past. How- ever, it is getting more and more difficult to use ground
soil for reclamation now because of environmental pollution caused by construction of borrow pits and increase in construction costs. Therefore, residue soil produced in dredging is used for reclamation. Because residue soil from dredging construction having very high water content usually consists of very soft clay, clay particles subside and accumulate in long period.
Therefore, it is necessary to make the strength to main-
tain the structures built on the very soft ground and to
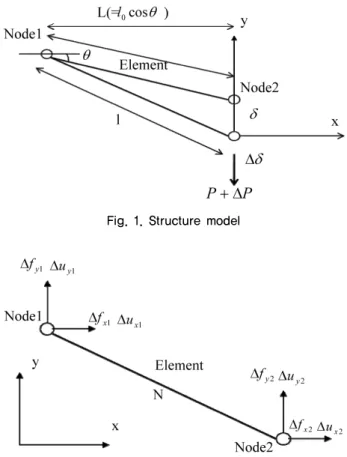
Fig. 1. Structure model
Fig. 2. Load and displacement increment
prevent consolidation settlement. And it is also necessary
to speed up consolidation to make the best use of structures early.
However, it is usually impossible that construction equip- ments used to develop the very soft ground enter the very soft ground area. Therefore, ground surface strengthening such as using geotextile is needed to secure trafficability of construction equipment.
Several calculation methods for bearing capacity on the very soft ground reinforced by geotextile have been pro- posed already (Japanese society of soil mechanics, 2002).
However there is still a lot of trouble in the construction fields because they are not established yet.
In this paper, elastoplastic finite element analysis pro- posed by authors is carried out to estimate bearing capacity improvement on the very soft ground reinforced by geo- textiles as the beginning to develop the design method of ground surface strengthening suitable for very soft ground in Korea.
2. OUTLINE OF NUMERICAL ANALYSIS
2.1 Analysis outline
In this paper, the ground model is the elastoplastic based on the von Mises criterion in the elastoplastic analysis. Plastic strain increment is calculated by normality.
In numerical analysis, return mapping algorithms (Oritz et al., 1986) and displacement controlled by Arc Length Method (Crisfield, 1981) are used to get a stable value until residual displacement state. Geotextile is modeled by membrane element which the bending rigidity is not considered because bending rigidity and compressive rigidity is very small. However, the element becomes linear because plane strain condition is assumed in this study. Because membrane element outcomes cable ele- ment, therefore, geotextile is modeled by cable element.
2.2 Finite displacement analysis of membrane
Fig. 1 shows the structure combined by pin. Fig. 2
shows equilibrium state when vertical load P is loaded.
N, Δp and Δ δ indicate axle force, load increment and displacement increment, respectively.
Nodal stiffness matrix of element is
(1)
Eq. (1) satisfies the following condition.
Δf = KΔu (2)
where Δf and Δu are load increment vector and dis-
placement increment vector, respectively.
Fig. 3. Analysis model
Table 1. Analysis parameters
Model ground Geotextile
c (kN/m2) E (kN/m2) ν φ ( °) EA (kN/m)
2 400 0.45 0 3000
Table 2. Analysis case
Analysis case L (m)
NR -
C095 9.5
C136 13.6
C156 15.6
C186 18.6
C200 20.0
C230 23.0
C500 50.0 Fig. 4. Load-settlement curve
3. ANALYSIS CONDITION
Analysis case is that uniform load is loaded on uniform model ground reinforced by geotextile. Fig. 3 shows an analysis model. Analysis model area is the half section where the center of the uniform load is a symmetric axis to consider symmetry. The width of the uniform load is 5.0 m. Length and depth of the model ground are 50.0 m and 25.0 m. The boundary condition is that right side and bottom of the model ground are fixed and left side is roller which is free in vertical direction. Further, the cable element which imitated geotextile is arranged on the model ground surface.
Table 1 shows analysis parameters. c, E, ν and φ indicates cohesion, modulus of elasticity, Poisson’s ratio and friction angle, respectively. And EA indicates tensile rigidity of geotextile. Table 2 shows analysis cases. Numerical
analyses are carried out on 8 cases which added NR which is not reinforced by geotextile. Further, C50 is the case reinforced by geotextile in the whole model ground surface.
4. ANALYSIS RESULT
Fig. 4 shows load-settlement curve in each case. When the uniform load reaches about 7.0 kN/m
2in case of NR which is not reinforced by geotextile, the relation between the uniform load and the settlement does not accord with other cases. And when the uniform load reaches 9.0 kN/m
2, a yield occurs. After yielding, the uniform load increases with increase of settlement. Even though settlement increases in residual state, almost of the uniform load does not increase. The value of the uniform load is 10.8 kN/m
2in the residual state. Because cohesion of the model ground is 2.0 kN/m
2, coefficient of bearing capacity is about 5.4. Even though the loading condition is different, the coefficient of bearing capacity is almost same as it given by so-called theory of bearing capacity.
On the other hand, the uniform load in the cases rein- forced by geotextile is bigger than in NR when yielding.
In contract to NR, the uniform load increases with in-
crease of the settlement. This is because geotextile is
modeled as an elastic body in this analysis. By the way
the relations between uniform load and settlement in
C230 and C500 are same in this analysis. The relation
between uniform load and settlement in C180 and C156
are also almost same as them until settlement reaches
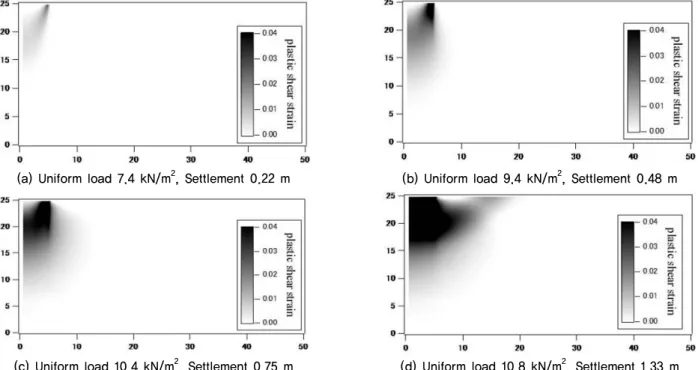
(a) Uniform load 7.4 kN/m2, Settlement 0.22 m (b) Uniform load 9.4 kN/m2, Settlement 0.48 m
(c) Uniform load 10.4 kN/m2, Settlement 0.75 m (d) Uniform load 10.8 kN/m2, Settlement 1.33 m Fig. 5. Distribution of plastic shear strain for NR
(a) Uniform load 8.0 kN/m2, Settlement 23.6 m (b) Uniform load 11.0 kN/m2, Settlement 0.50 m
(c) Uniform load 13.0 kN/m2, Settlement 0.80 m (d) Uniform load 16.0 kN/m2, Settlement 1.47 m Fig. 6. Distribution of plastic shear strain for C500
about 1.0 m. Therefore, when the length of geotextile is about three times of the loaded width, it could be enough.
And the effect to the bearing capacity improvement is very little even though it’s constructed lengthily any more.
Fig. 5 shows the distribution of plastic shear strain for NR. When the uniform load reaches about 7.5 kN/m
2, the
territory where plastic shear strain appears conspicuous
relatively forms from the right end to the left end of the
uniform load. Plastic shear strain becomes conspicuous
with the increase of the uniform load. And it reaches the
whole plastic condition in the residual state. Fig. 6 shows
the distribution of the plastic shear strain of for C500.
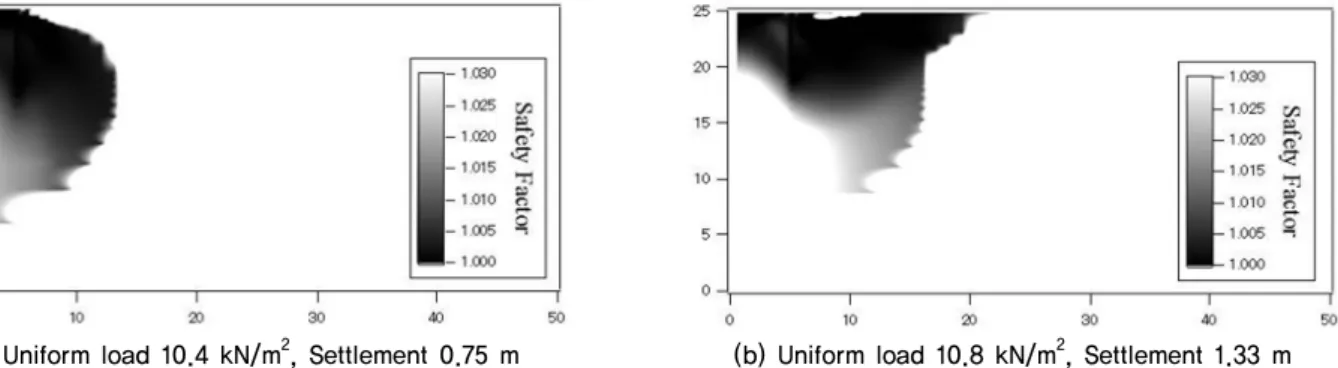
(a) Uniform load 10.4 kN/m2, Settlement 0.75 m (b) Uniform load 10.8 kN/m2, Settlement 1.33 m Fig. 7. Distribution of safety factor for NR
(a) Uniform load 13.0 kN/m2, Settlement 0.80 m (b) Uniform load 16.0 kN/m2, Settlement 1.47 m Fig. 8. Distribution of safety factor for C500
(a) Uniform load 10.4 kN/m2, Settlement 0.75 m (b) Uniform load 10.8 kN/m2, Settlement 1.33 m Fig. 9. Deformation for NR
(a) Uniform load 13.0 kN/m2, Settlement 0.80 m (b) Uniform load 16.0 kN/m2, Settlement 1.47 m Fig. 10. Deformation for C500
Plastic shear strain becomes conspicuous with increase of the uniform load, but its distribution is different from NR’s.
Fig. 7 and Fig. 8 show the distribution of safety factor
for NR and C500, respectively. It becomes clear that C500’s
distribution is different from NR’s. Fig. 9 and Fig. 10
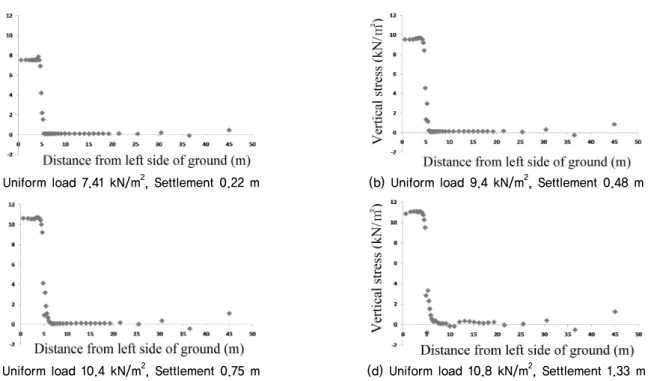
(a) Uniform load 7.41 kN/m2, Settlement 0.22 m (b) Uniform load 9.4 kN/m2, Settlement 0.48 m
(c) Uniform load 10.4 kN/m2, Settlement 0.75 m (d) Uniform load 10.8 kN/m2, Settlement 1.33 m Fig. 11. Distribution of vertical stress at the surface for NR
(a) Uniform load 8.02 kN/m2, Settlement 23.6 m (b) Uniform load 11.0 kN/m2, Settlement 0.50 m
(c) Uniform load 13.0 kN/m2, Settlement 0.80 m (d) Uniform load 16.0 kN/m2, Settlement 1.47 m Fig. 12. Distribution of vertical stress at the surface for C500
show the deformation in case of NR and C500, respectively.
Sudden deformation occurs around the edge of the uni- form load after the residual state in case of NR. On the other hand, gentle deformation occurs around the edge of the uniform load in case of C500 compared with NR’s.
Fig. 11 and Fig. 12 show the distribution of vertical
stress at the surface for NR and C500, respectively. After
the residual state, vertical stress changes suddenly around
the edge of the uniform load in case of NR. On the other
hand, it decreases linearly around the edge of the uniform
load in case of C500. And geotextile starts to take uni-
form load after yield occurs in the ground. This becomes
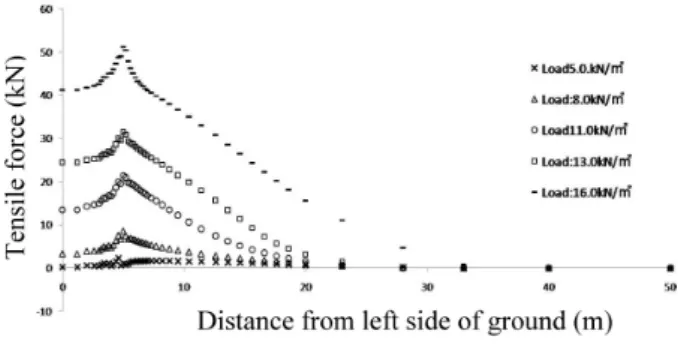
Fig. 13. Tensile force of Geotextlie
Fig. 14. Deformation model of geotextile
Fig. 15. Comparison of results
one of the reasons that the deformation around the edge
of the uniform load in case of NR is different from it in case of C500.
Fig. 13 shows the distribution of the tensile force of geotextile in C500. The biggest tensile force occurs in an edge of the uniform load. And when plastic shear strain becomes conspicuous, it increases sharply. This is because the bearing capacity of the model ground is mobilized.
5. CONTEMPLATION OF ANALYSIS RESULT
The calculation formula for bearing capacity of the soft ground reinforced by geotextile based on Terzaghi’s bearing capacity theory has been used in general. However, it’s very difficult to calculate r and θ which reflected the situation of transformed geotextile. Fig. 14 shows the con- cept on the deformation model of geotextile Eq. (3) is the formula based on Terzaghi’s bearing capacity theory.
This formula is constructed by four forces as follows;
1) Bearing capacity of original ground
2) Bearing capacity by tensile force of geotextile 3) Counterweight fill effect
4) Buoyancy effect by settlement of embankment
(3)
where q, c, N
c, N
qand γ
tare the bearing capacity of ground , cohesion, bearing capacity factor and unit weight of ground, respectively. θ which is deformation angle of geotextile are calculated by angle between two nodes at
a distance of 1.0 m from the uniform load. r which is the radius of the virtual circle in the ground is fixed as 2.0 m based on test data (Japanese society of soil me- chanics, 1990).
Fig. 15 shows the comparison between the analysis result and result calculated by formula. r and θ are assumed as 8.0m and 20 degree, respectively.
Calculated result (1) is the result that deducts the buoyancy effect by settlement of embankment from calculated result.
Calculated result (2) is the result that deducts counter- weight fill effect from calculated result (1). Compared Analysis result with calculated result (1), the great difference comes out. The error is more than about 50%. But compared it with calculated (2), the difference becomes small.
6. CONCLUSION
The authors developed the elastoplastic analysis based on the finite element method in which a cable element was included to estimate the bearing capacity of very soft ground reinforced by geotextile. Main conclusions in this paper can be summarized as follows:
1) By reinforcing with geotextile, the bearing capacity in
very soft ground is increased with increase of the settlement after yielding.
2) When the length of geotextile is about three times of the loaded width, the effect to the bearing capacity improvement is very little even though it’s constructed lengthily any more.
3) The biggest tensile force occurs in an edge of the uni- form load.
4) Analysis result is very similar to the result which deducts the buoyancy effect and counterweight fill effect from by embankment settlement and counter- weight effect from calculated result by Terzaghi’s bearing capacity formula,
A developed analysis method could express the charac- teristic of the bearing capacity and the effect of geotextile qualitatively. We would like to verify more detailed and estimate quantitatively from now.
REFERENCES
1. Crisfield, M. A. (1981), “A Fast Incremental/iterative Solution Procedure that Handles Snap Through”, Computer and Structure, pp.55-62.
2. Japanese society of soil mechanics (1990), Design of Reclamation ground and soft ground reinforced by geotextile, Symposium paper about application properties of geotextile, pp.23-36.
3. Japanese society of soil mechanics (2002), Symposium about Newest study and practical side for soft ground – From ob- servation of microscopic structure to countermeasure technique for very soft ground, pp.104-111.
4. Oritz, M. and Simo, J. C. (1986), “An Analysis of a New Class of Integration Algorithms for Elasoplasic Constitutive Relations”, International Journal for Numerical Method in Engineering, pp.353-366.
(논문접수일 2009. 8. 5, 심사완료일 2009. 9. 20)