211 https://doi.org/10.5720/kjcn.2021.26.3.211
ISSN 1226-0983 (print) / 2287-1624 (on-line)
채소 및 육류 섭취의 상대적인 선호도와 암 발생의 연관성:
국민건강보험공단 국민건강정보자료 활용
이가은1)·김안나1)·조현정1)·강민지2)·문성지3),4),5)·김인아6)·고광필7)·이정은8),9)†·박수경10),11),12)
1)서울대학교 생활과학대학 식품영양학과, 대학원생, 2)서울대학교 4단계 BK21 지속가능 식품영양 교육연구팀, BK 조교수, 3)서울대학교 의과대학 예방의학교실, 전공의, 4)서울대학교 암연구소, 대학원생, 5)서울대학교 의과대학 종양생물학 협동과정, 대학원생, 6)한양대학교 의과대학 직업환경
의학교실, 교수, 7)분당서울대학교병원 임상예방의학센터, 교수, 8)서울대학교 생활과학대학 식품영양학과, 교수, 9)서울대학교 생활과학연구소, 교수, 10)서울대학교 의과대학 예방의학교실, 교수, 11)서울대학교 암연구소, 교수, 12)서울대학교 의과대학 융합전공 혁신의과학, 교수
Association between Relative Preference for Vegetables and Meat and Cancer Incidence in Korean Adults: A Nationwide Population-based Retrospective Cohort Study
Ga-Eun Yie
1), An Na Kim
1), Hyun Jeong Cho
1), Minji Kang
2), Sungji Moon
3), 4), 5), Inah Kim
6), Kwang-Pil Ko
7), Jung Eun Lee
8), 9)†, Sue K. Park
10), 11), 12)1)Graduate student, Department of Food and Nutrition, College of Human Ecology, Seoul National University, Seoul, Korea
2)BK Assistant professor, BK21 FOUR Education and Research Team for Sustainable Food and Nutrition, Seoul National University
3)Resident, Department of Preventive Medicine, Seoul National University College of Medicine, Seoul, Korea
4)Graduate student, Cancer Research Institute, Seoul National University, Seoul, Korea
5)Graduate student, Interdisciplinary Program in Cancer Biology Major, Seoul National University College of Medicine, Seoul, Korea
6)Professor, Department of Occupational and Environmental Medicine, Hanyang University, Seoul, Korea
7)Professor, Clinical Preventive Medicine Center, Seoul National University Bundang Hospital, Seoul, Korea
8)Professor, Department of Food and Nutrition, College of Human Ecology, Seoul National University, Seoul, Korea
9)Professor, Research Institute of Human Ecology, Seoul National University, Seoul, Korea
10)Professor, Department of Preventive Medicine, Seoul National University, Seoul, Korea
11)Professor, Cancer Research Institute, Seoul National University, Seoul, Korea
12)Professor, Integrative Major in Innovative Medical Science, Seoul National University College of Medicine, Seoul, Korea
†
Corresponding author Jung Eun Lee
Department of Food and Nutrition, College of Human Ecology, Seoul National University, Gwanak-ro 1, Gwanak-gu, Seoul, Republic of Korea
Tel: +82-2- 880-6834 Fax: +82-2- 884-0305 E-mail: [email protected] Acknowledgments
This study was funded by the Korean Foundation for Cancer Research (CB-2017-A-2). This study used NHIS- NHID data (NHIS-2019-1-495) made by National Health Insurance Service (NHIS). The authors declare no conflict of interest with NHIS.
Received: May 3, 2021 Revised: June 23, 2021 Accepted: June 23, 2021
ABSTRACT
Objectives: We aimed to examine the association between the relative preference for vegetables and meat and cancer incidence, in a population-based retrospective cohort in Korea.
Methods: We included 10,148,131 participants (5,794,124 men; 4,354,007 women) who underwent national health screening between 2004 and 2005 from the National Health Information Database of the National Health Insurance Service (NHIS-NHID). Participants were asked whether they preferred consuming 1) vegetables more often, 2) both vegetables and meat or 3) meat more often. Participants were followed up to Dec. 31, 2017. All cancer and eighteen common cancer cases were identified through the code from the International Classification of Diseases, 10th revision. We estimated sex- specific relative risks and 95% confidence intervals, adjusting for age, body mass index, alcohol consumption, smoking, physical activity, and income level.
Results: During an average follow-up of 12.4 years, 714,170 cancer cases were documented. In men, consuming meat more often was associated with lower risk of esophageal, liver, and stomach cancers, but higher risk of lung and kidney cancers. Consuming both vegetables and meat was associated with higher risk of prostate cancer, but with lower risk of esophageal, liver, and stomach cancers in men. In women, consuming meat more often was associated with a higher risk of colorectal cancer and breast, endometrial, and cervical cancers diagnosed before the age of 50. Consuming both vegetables and meat was associated with lower risk of liver cancer in women.
Conclusions: Our study suggests a potential link between vegetable and meat intake and cancer incidence in the Korean population. Further investigation on the association between the intake of specific types of vegetables and meat and cancer risk in Korean prospective cohort studies is needed.
Korean J Community Nutr 26(3): 211~227, 2021
KEY WORDS cancer incidence, meat, vegetables, NHIS-NHID
This is an Open-Access article distributed under the terms of the Creative Commons Attribution Non-Commercial License (http://
creativecommons.org/licenses/by-nc/3.0) which permits unrestricted non-commercial use, distribution, and reproduction in any medium, provided the original work is properly cited.
RESEARCH ARTICLE
—————————————————————————
서 론
—————————————————————————
2017년 국가암등록통계에 따르면 국민들이 기대수명까 지 생존할 경우 암에 걸릴 확률은 35.5%였다[1]. 우리나라 모든 암의 연령표준화 발생률의 연간%변화율은 2011년 이 후부터 2.7% 감소하는 추세를 보였지만, 유방암, 전립선암, 췌장암, 신장암의 발생률은 1999년부터 계속 증가하는 추 세를 보였다[1]. 2017년 암종별 발생 현황은 위암, 대장암, 폐암, 갑상선암, 유방암, 간암, 전립선암 순으로 많이 발생하 는 것으로 나타났다. 전세계적으로도 암은 질병과 사망의 주 요 원인이며 2018년에는 폐암, 유방암, 대장암, 위암, 간암 이 가장 높은 암사망률을 나타내었다[2].
암 발생과 채소 또는 육류 섭취와의 연관성에 관한 선행연 구는 활발히 진행되었으며 세계암연구재단(World Cancer Research Fund, WCRF)과 미국암연구소(American Institute for Cancer Research, AICR)에서는 전세계적으 로 진행된 연구들에 대해 체계적 고찰과 메타분석을 수행하 였다[3]. 그에 따르면 대장암의 위험요인으로 가공육(strong evidence-convincing)과 적색육(strong evidence- probable)이 강한 근거가 있는 것으로 평가되었다. 반면, 가 공육과 적색육이 비인두암, 폐암, 췌장암, 위암, 식도암의 위 험요인이라는 근거는 제한된 수준(limited evidence)으로 제시되었으며, 비전분채소의 섭취는 대장암, 구강암, 인두암, 후두암, 비인두암, 식도암, 폐암, 유방암의 예방요인이라는 근거는 충분하지 않았다(limited evidence). 하지만 절인 채소를 포함한 절인식품은 위암의 위험요인으로 강한 근거 (strong evidence-probable)가 있다고 평가되었다.
국내 암검진자코호트 8,179명을 7년간 추적하여 육류 및 채소 섭취와 암 발생의 연관성을 분석한 연구 결과, 남성의 경우 적색육 섭취가 높으면(≥ 43 g/일) 모든 암의 발생위 험이 유의하게 증가하였고, 채소 섭취와 모든 암의 발생은 유 의한 연관성이 없었다[4]. 건강보험공단자료에서 30세 이 상의 1996년과 1997년 건강검진 참여자를 2003년까지 추 적한 연구에서는 채식을 주로 섭취하는 군에 비해 골고루 섭 취하거나 육식을 주로 섭취하는 군의 대장암 발생 위험의 차 이는 없었지만, 육류를 주 1회 미만 섭취하는 군에 비해 주 4회 이상 섭취하는 군의 대장암 발생위험이 23% 높게 나타 났다[5]. 건강보험공단자료를 이용하여 1996년과 1997년 의 건강검진 참여자를 8년간 추적하여 대장암 발생 예측모 형을 추정한 연구에서 남성의 경우 주간 육류 섭취빈도가 모 형에 포함되지 못했지만, 여성의 경우 대장암, 결장암, 직장 암 발생 예측 최종 모형의 변수로 선택되었다[6]. 같은 방법
으로 전립선암에 대하여 진행된 연구에서는 주간 육류섭취 빈도가 최종 예측 모형에 포함되었다[7]. 건강보험공단자료 에서 1996년에 건강검진을 실시한 성인남성을 2002년까 지 추적하여 채소 및 육류 섭취의 상대적인 선호도와 여러 암 의 연관성을 분석한 연구 결과, 육식을 주로 섭취하는 군에 비해 채식을 주로 섭취하거나 채식과 육식을 골고루 섭취하 는 군에서 모든 암의 발생위험이 4% 더 낮았으나 유의하지 는 않았다. 폐암의 발생위험은 19% 더 낮았고 그 외 10종 의 세부 암과는 유의한 연관성이 없는 것으로 나타났다[8].
2002년까지 추적한 선행연구 이후로는 국민건강보험공단 자료를 이용하여 모든 암 및 세부 암과 식이요인의 연관성을 통합적으로 확인한 연구는 없는 실정이다. 이에 본 연구는 2004년부터 2017년 국민건강보험공단 자료를 활용하여 채 소 및 육류 섭취의 상대적인 선호도와 모든 암 및 주요 암 발 생과의 연관성 분석을 하였고, 이를 통해 채소와 육류 섭취 가 여러 암에 미치는 영향에 대하여 통합적인 기초자료를 제 공하고자 하였다.
—————————————————————————
연구대상 및 방법
—————————————————————————
1. 연구자료
본 연구는 국민건강보험공단에서 제공한 국민건강정보자 료(NHIS-2019-1-495)를 활용하였다. 우리나라의 국 민건강보험공단은 전국민의 국민건강정보자료를 수집, 보유 관리하고 있다. 공단에서는 연구를 목적으로 해당 자료를 연 구자에게 제공하는데 그 중 본 연구에서 활용한 맞춤형DB 는 신청자의 연구목적에 따라 자료를 추출, 요약, 가공하여 정보주체를 식별할 수 없도록 조치한 자료이며, 자격 및 보 험료 자료, 사망 자료, 진료 자료, 건강검진 자료와 요양기관 자료로 구성되어 있다[9, 10].
2. 연구대상
본 연구에서는 2004년부터 2005년 사이에 적어도 한 번
일반검진을 받은 건강보험 가입자 중 2004년과 2005년의
최초 일반 건강검진일까지 한 번이라도 암 진단(주상병명 또
는 제1부상병명)을 받은 사람을 제외한 13,250,816명을 대
상자로 선정하였다. 2004년과 2005년에 만 20세 이상 성
인인 10,715,185명 중에서 검진 날짜까지 한 번이라도 암
으로 진단받은(제2~5부상병명) 대상자 385,756명, 처음
1년 안에 사망한 720명, 설문지에 암 과거력이 있다고 응답
한 57,236명, 영양섭취행태 항목에 응답하지 않은 123,342
명을 제외한 10,148,131명을 최종 연구대상으로 선정하였
다. 본 연구는 서울대학교의과대학/서울대학교병원 의학연
구윤리심의위원회(IRB No. C-1911-188-1084)의 승 인을 받아 진행되었다.
3. 영양섭취행태 및 일반사항 변수
영양섭취행태는 건강검진 자료에서 육류야채선호 항목을 사용하였다. 해당 항목은 ‘평소에 어느 것을 즐겨 드십니까?’
라는 질문의 답으로 ‘채식을 주로 먹는다’, ‘채식, 육식을 골 고루 먹는 편이다’, ‘육식을 주로 먹는다’로 조사되었다. 자 격 및 보험료 자료에서 성별, 연령, 보험료 20분위 변수와 건 강검진 자료에서 체질량지수, 과거병력, 음주빈도, 흡연여부, 신체활동빈도 변수를 사용하였다. 과거병력은 암 과거력이 있다고 응답한 대상자를 제외하기 위하여 사용하였다. 음주 빈도는 ‘거의 마시지 않는다’, ‘월 2~3회 정도 마신다’, ‘일 주일에 1 ~ 2회 마신다’, ‘일주일에 3 ~ 4회 마신다’, ‘거의 매일 마신다’로, 흡연여부는 비흡연자, 과거 흡연자, 현재 흡 연자로, 신체활동빈도는 ‘안 한다’, ‘주 1 ~ 2회’, ‘주 3 ~ 4 회’, ‘주 5 ~ 6회’, ‘거의 매일 한다’로 조사되었다.
4. 암 발생 추적
대상자는 암 발생일, 사망일 또는 2017년 12월 31일까지 추적되었다. 암 발생은 진료 자료에서 입원 환자들 중 주상병 의 'C' 코드가 발생한 경우로 정의되었고, 암 발생코드가 생 성된 최초 요양개시일자를 암 발생일자로 하였다. 주상병은 제10차 개정 국제질병분류(International Classifi- cation of Disease, 10th revision, ICD-10) 코드를 사 용하여 분류되었다. 본 연구에는 암은 모든 암(C00 ~ C97), 구강암(C00 ~ C09), 인두암(C10 ~ C14), 식도암(C15), 위암(C16), 대장암(C18 ~ C20), 결장암(C18), 직장암 (C19 ~ C20), 간암(C22), 담낭암(C23), 췌장암(C25), 후두암(C32), 폐암(C34), 유방암(C50), 자궁경부암(C53), 자궁내막암(C54), 난소암(C56), 전립선암(C61), 신장암 (C64), 요관암(C66), 방광암(C67)으로 분류되었다. 암 발 생 추적기간의 중앙값은 13.1년(사분위수범위: 12.3 ~ 13.4 년)이었으며, 이 기간 중 총 714,170건의 암이 발생하였다.
5. 통계분석
대상자의 인구사회학적 특성, 신체계측치와 건강습관을 성 별과 채소 및 육류 섭취의 상대적인 선호도에 따라 나타내었 다. 범주형 변수는 빈도와 백분율, 연속형 변수는 평균과 표 준편차로 나타내었다. 채소 및 육류 섭취의 상대적인 선호도 에 따른 대상자의 일반 특성의 비교를 위해 범주형 변수는 카 이제곱 검정, 연속형 변수는 일원분산분석을 실시하였다. 채 소 및 육류 섭취와 암 발생의 연관성을 확인하기 위하여 콕
스비례위험모형(Cox proportional hazards regression) 을 이용하여 위험비(relative risks, RRs)와 95% 신뢰구 간(95% confidence intervals, CIs)을 산출하였다[11].
연령은 세 그룹(20 ~ < 40, 40 ~ < 60, ≥ 60세)으로 층 화하여 콕스비례위험모형을 적용하였다. 이 때 연령(세; 연 속형 변수)을 보정하였고(Model 1), 추가로 체질량지수(kg/
m
2; 연속형 변수), 음주빈도(비음주, 월 2 ~ 3회, 주 1 ~ 2 회, 주 3 ~ 4회, 매일), 흡연상태(비흡연자, 과거 흡연자, 현 재 흡연자), 신체활동빈도(안 함, 주 1 ~ 2회, 주 3 ~ 4회, 주 5 ~ 6회, 매일), 소득수준(저소득, 중간소득, 고소득)을 보정하여(Model 2) 다변량분석을 실시하였다. 대상자의 소 득수준은 보험료 20분위에 따라 저소득(1 ~ 4분위), 중간 소득(5 ~ 16분위), 고소득 (17 ~ 20분위)으로 분류하였 다. 위험비를 산출할 때, 채식을 주로 섭취하는 군을 기준 (reference)으로 하였고, 추가 분석으로 골고루 섭취하는 군을 기준으로 한 위험비를 산출하였다. 콕스비례위험모형 에서 연령(< 50, ≥ 50세), 체질량지수(< 25, ≥ 25 kg/
m
2), 음주상태(비음주자, 음주자), 흡연상태(비흡연자, 과거 및 현재 흡연자)에 따라 나눠서 층화분석을 수행하였다. 콕 스비례위험모형 다변량분석에서 연령(세; 연속형 변수), 체 질량지수(kg/m
2; 연속형 변수), 음주빈도(남성: 비음주, 월 2 ~ 3회, 주 1회 이상; 여성: 비음주자, 음주자), 흡연상태 (비흡연자, 과거 및 현재 흡연자), 신체활동빈도(안 함, 함), 소득수준(중간소득 이하, 고소득)을 보정하였다. 분석에 포 함된 변수의 결측 비율은 모두 3% 미만이었다(체질량지수:
0.03%, 음주빈도: 0.81%, 흡연상태: 1.37%, 신체활동빈 도: 1.26%, 소득수준: 2.91%). 암 발생 분석과 층화분석은 모두 성별을 구분하여 실시하였다. 일반건강검진에서 여성 의 폐경상태에 대한 정보를 제공하지 않았기 때문에 암 진단 시 나이를 여성의 평균 폐경 나이인 50세[12] 기준으로 나 눠서 폐경 상태를 대신하였으며 유방암, 자궁내막암, 자궁경 부암, 난소암에 대하여 암 진단 시 나이 < 50, ≥ 50세로 나 눠서 분석을 수행하였다. 모든 분석은 SAS 9.4 (SAS Institute, Cary, NC, USA) 소프트웨어를 이용하였으며, 모든 통계적 유의성 검정은 P < 0.05를 통계적으로 유의하 다고 판정하였다.
—————————————————————————
결 과
—————————————————————————
1. 연구 대상자의 일반특성
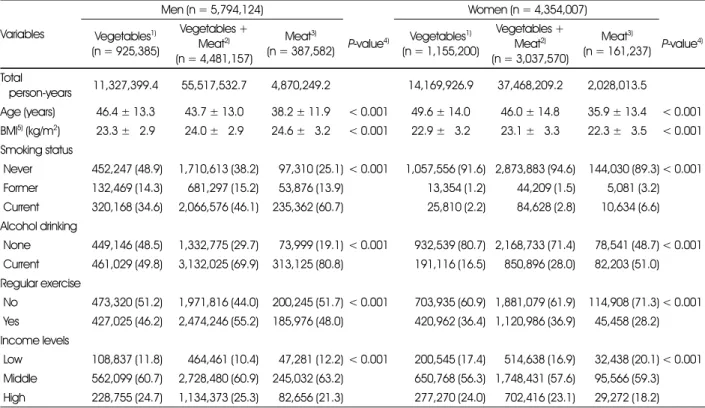
본 연구 대상자의 성별과 채소 및 육류 섭취의 상대적인 선
호도에 따른 일반사항 특징은 Table 1과 같다. 5,794,124
명의 남성과 4,354,007명의 여성이 연구에 포함되었으며,
평균 연령은 남성이 43.8세이고 여성이 46.6세였다. 남성과 여성 모두 채식을 주로 섭취하는 대상자의 연령이 남성 46.4 세, 여성 49.6세로 가장 높고, 육식을 주로 섭취하는 대상자 의 연령이 남성 38.2세, 여성 35.9세로 가장 낮았다. 체질량 지수는 남성은 육류를 주로 섭취하는 군이, 여성은 채식과 육 식을 골고루 섭취하는 군이 가장 높았다. 현재 흡연자 및 현 재 음주자의 비율 또한 채식을 주로 섭취하는 군에서 가장 낮 았고 육식을 주로 섭취하는 군에서 가장 높았다. 남성은 채 식을 주로 섭취하는 군, 여성은 육류를 주로 섭취하는 군이 다른 군에 비해 규칙적인 운동을 하는 비율이 낮았다. 남녀 모두 육식을 주로 섭취하는 군에서 저소득의 비율이 가장 높 고, 고소득의 비율이 가장 낮게 나타났다. 채소 및 육류 섭취 의 상대적인 선호도에 따른 위에서 언급한 특성의 차이는 모 두 통계적으로 유의하였다.
2. 채소 및 육류 섭취의 상대적인 선호도와 암 발생의 연관성
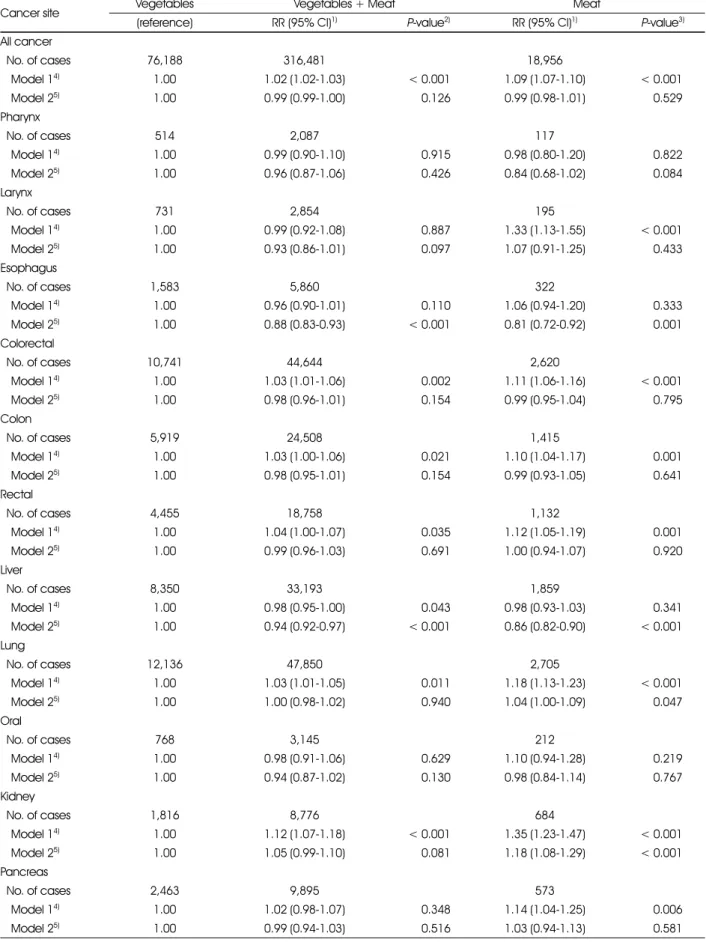
남성과 여성의 채소 및 육류 섭취의 상대적인 선호도와 암 발생 위험의 연관성을 분석한 결과는 Table 2~3과 같다. 남
성의 경우 연령만 보정하여 분석한 결과 모든 암 발생위험이 채식을 주로 섭취하는 군에 비해 채식과 육식을 골고루 섭취 하는 군은 2% (95% CI: 1.02-1.03; P < 0.001), 육식 을 주로 섭취하는 군은 9% (95% CI: 1.07-1.10; P <
0.001)로 높았지만 연령 외의 공변량을 추가 보정하여 분석 한 결과 유의한 연관성은 없었다. 식도암의 발생위험은 채식 을 주로 섭취하는 군에 비해 골고루 섭취하는 군에서 12%
(95% CI: 0.83-0.93, P < 0.001), 육식을 주로 섭취하는 군에서 19% (95% CI: 0.72-0.92, P = 0.001) 더 낮 았다. 대장암, 결장암, 직장암, 폐암의 경우 연령만 보정했을 경우에는 골고루 섭취하는 군, 육식을 주로 섭취하는 군 순 으로 발생 위험이 유의하게 증가하였지만 추가로 다른 변수 를 보정한 후에 유의한 연관성은 없었다. 간암은 골고루 섭 취하는 군에서 6% (95% CI: 0.92-0.97, P < 0.001), 육식을 주로 섭취하는 군에서 14% (95% CI: 0.82-0.90, P < 0.001) 발생 위험이 유의하게 감소하는 것으로 나타났 다. 위암도 골고루 섭취하는 군(RR: 0.97; 95% CI: 0.95- 0.99, P < 0.001), 육식을 주로 섭취하는 군(RR: 0.93;
95% CI: 0.90-0.97, P < 0.001) 순으로 발생위험이 낮아
Table 1. General characteristics of the study population according to the relative preference for vegetables and meat Variables
Men (n = 5,794,124) Women (n = 4,354,007)
Vegetables1) (n = 925,385)
Vegetables + Meat2) (n = 4,481,157)
Meat3)
(n = 387,582) P-value4) Vegetables1) (n = 1,155,200)
Vegetables + Meat2) (n = 3,037,570)
Meat3)
(n = 161,237) P-value4) Total
person-years 11,327,399.4 55,517,532.7 4,870,249.2 14,169,926.9 37,468,209.2 2,028,013.5
Age (years) 46.4 ± 13.3 43.7 ± 13.0 38.2 ± 11.9 < 0.001 49.6 ± 14.0 46.0 ± 14.8 35.9 ± 13.4 < 0.001 BMI5) (kg/m2) 23.3 ± 52.9 24.0 ± 52.9 24.6 ± 53.2 < 0.001 22.9 ± 53.2 23.1 ± 53.3 22.3 ± 53.5 < 0.001 Smoking status
Never 452,247 (48.9) 1,710,613 (38.2) 97,310 (25.1) < 0.001 1,057,556 (91.6) 2,873,883 (94.6) 144,030 (89.3) < 0.001 Former 132,469 (14.3) 681,297 (15.2) 53,876 (13.9) 13,354 (1.2) 44,209 (1.5) 5,081 (3.2) Current 320,168 (34.6) 2,066,576 (46.1) 235,362 (60.7) 25,810 (2.2) 84,628 (2.8) 10,634 (6.6) Alcohol drinking
None 449,146 (48.5) 1,332,775 (29.7) 73,999 (19.1) < 0.001 932,539 (80.7) 2,168,733 (71.4) 78,541 (48.7) < 0.001 Current 461,029 (49.8) 3,132,025 (69.9) 313,125 (80.8) 191,116 (16.5) 850,896 (28.0) 82,203 (51.0) Regular exercise
No 473,320 (51.2) 1,971,816 (44.0) 200,245 (51.7) < 0.001 703,935 (60.9) 1,881,079 (61.9) 114,908 (71.3) < 0.001 Yes 427,025 (46.2) 2,474,246 (55.2) 185,976 (48.0) 420,962 (36.4) 1,120,986 (36.9) 45,458 (28.2) Income levels
Low 108,837 (11.8) 464,461 (10.4) 47,281 (12.2) < 0.001 200,545 (17.4) 514,638 (16.9) 32,438 (20.1) < 0.001 Middle 562,099 (60.7) 2,728,480 (60.9) 245,032 (63.2) 650,768 (56.3) 1,748,431 (57.6) 95,566 (59.3) High 228,755 (24.7) 1,134,373 (25.3) 82,656 (21.3) 277,270 (24.0) 702,416 (23.1) 29,272 (18.2) Mean ± SD or n (%)
1) Participants who answered that they consumed vegetables more often 2) Participants who answered that they consumed both vegetables and meat 3) Participants who answered that they consumed meat more often
4) P-values by ANOVA for continuous variables and by chi-square test for categorical variables 5) Abbreviations: BMI, body mass index
Table 2. Risks of cancer incidence according to the relative preference for vegetables and meat in men
Cancer site Vegetables Vegetables + Meat Meat
(reference) RR (95% CI)1) P-value2) RR (95% CI)1) P-value3)
All cancer
No. of cases 76,188 316,481 18,956
Model 14) 1.00 1.02 (1.02-1.03) < 0.001 1.09 (1.07-1.10) < 0.001
Model 25) 1.00 0.99 (0.99-1.00) 0.126 0.99 (0.98-1.01) 0.529
Pharynx
No. of cases 514 2,087 117
Model 14) 1.00 0.99 (0.90-1.10) 0.915 0.98 (0.80-1.20) 0.822
Model 25) 1.00 0.96 (0.87-1.06) 0.426 0.84 (0.68-1.02) 0.084
Larynx
No. of cases 731 2,854 195
Model 14) 1.00 0.99 (0.92-1.08) 0.887 1.33 (1.13-1.55) < 0.001
Model 25) 1.00 0.93 (0.86-1.01) 0.097 1.07 (0.91-1.25) 0.433
Esophagus
No. of cases 1,583 5,860 322
Model 14) 1.00 0.96 (0.90-1.01) 0.110 1.06 (0.94-1.20) 0.333
Model 25) 1.00 0.88 (0.83-0.93) < 0.001 0.81 (0.72-0.92) 0.001
Colorectal
No. of cases 10,741 44,644 2,620
Model 14) 1.00 1.03 (1.01-1.06) 0.002 1.11 (1.06-1.16) < 0.001
Model 25) 1.00 0.98 (0.96-1.01) 0.154 0.99 (0.95-1.04) 0.795
Colon
No. of cases 5,919 24,508 1,415
Model 14) 1.00 1.03 (1.00-1.06) 0.021 1.10 (1.04-1.17) 0.001
Model 25) 1.00 0.98 (0.95-1.01) 0.154 0.99 (0.93-1.05) 0.641
Rectal
No. of cases 4,455 18,758 1,132
Model 14) 1.00 1.04 (1.00-1.07) 0.035 1.12 (1.05-1.19) 0.001
Model 25) 1.00 0.99 (0.96-1.03) 0.691 1.00 (0.94-1.07) 0.920
Liver
No. of cases 8,350 33,193 1,859
Model 14) 1.00 0.98 (0.95-1.00) 0.043 0.98 (0.93-1.03) 0.341
Model 25) 1.00 0.94 (0.92-0.97) < 0.001 0.86 (0.82-0.90) < 0.001
Lung
No. of cases 12,136 47,850 2,705
Model 14) 1.00 1.03 (1.01-1.05) 0.011 1.18 (1.13-1.23) < 0.001
Model 25) 1.00 1.00 (0.98-1.02) 0.940 1.04 (1.00-1.09) 0.047
Oral
No. of cases 768 3,145 212
Model 14) 1.00 0.98 (0.91-1.06) 0.629 1.10 (0.94-1.28) 0.219
Model 25) 1.00 0.94 (0.87-1.02) 0.130 0.98 (0.84-1.14) 0.767
Kidney
No. of cases 1,816 8,776 684
Model 14) 1.00 1.12 (1.07-1.18) < 0.001 1.35 (1.23-1.47) < 0.001
Model 25) 1.00 1.05 (0.99-1.10) 0.081 1.18 (1.08-1.29) < 0.001
Pancreas
No. of cases 2,463 9,895 573
Model 14) 1.00 1.02 (0.98-1.07) 0.348 1.14 (1.04-1.25) 0.006
Model 25) 1.00 0.99 (0.94-1.03) 0.516 1.03 (0.94-1.13) 0.581
Table 2. continued
Cancer site Vegetables Vegetables + Meat Meat
(reference) RR (95% CI)1) P-value2) RR (95% CI)1) P-value3)
Stomach
No. of cases 16,654 67,590 3,852
Model 14) 1.00 1.00 (0.98-1.02) 0.979 1.02 (0.98-1.06) 0.278
Model 25) 1.00 0.97 (0.95-0.99) < 0.001 0.93 (0.90-0.97) < 0.001
Ureter
No. of cases 277 1,085 66
Model 14) 1.00 1.01 (0.89-1.15) 0.873 1.23 (0.94-1.61) 0.132
Model 25) 1.00 0.96 (0.84-1.10) 0.561 1.08 (0.82-1.42) 0.577
Bladder
No. of cases 2,790 11,160 644
Model 14) 1.00 1.02 (0.98-1.06) 0.362 1.13 (1.04-1.23) 0.005
Model 25) 1.00 0.98 (0.94-1.02) 0.323 1.02 (0.94-1.11) 0.656
Gallbladder
No. of cases 872 3,405 169
Model 14) 1.00 1.01 (0.94-1.09) 0.709 1.02 (0.86-1.20) 0.855
Model 25) 1.00 0.99 (0.91-1.06) 0.706 0.94 (0.80-1.11) 0.474
Prostate
No. of cases 6,292 25,479 1,222
Model 14) 1.00 1.05 (1.02-1.08) 0.001 1.03 (0.97-1.10) 0.298
Model 25) 1.00 1.04 (1.01-1.07) 0.005 1.05 (0.99-1.12) 0.137
1) Relative risks (95% confidence intervals)
2) P-values for estimates comparing consuming both vegetables and meat to consuming vegetables more often.
3) P-values for estimates comparing consuming meat more often to consuming vegetables more often.
4) Model 1: Stratified by age (20 to < 40, 40 to < 60, and 60+ years) and adjusted for age (years, continuous)
5) Model 2: Model 1 further adjusted for BMI (kg/m2, continuous), alcohol intake (none, 2-3 times per month, 1 ~ 2 times per week, 3 ~ 4 times per week, and every day), smoking status (never, past, and current), regular exercise (no, 1 ~ 2 times per week, 3 ~ 4 times per week, 5 ~ 6 times per week, and every day), and income levels (low, middle, and high)
Table 3. Risks of cancer incidence according to the relative preference for vegetables and meat in women
Cancer site Vegetables Vegetables + Meat Meat
(reference) RR (95% CI)1) P-value2) RR (95% CI)1) P-value3)
All cancer
No. of cases 85,957 208,565 8,023
Model 14) 1.00 1.02 (1.01-1.03) < 0.001 1.03 (1.00-1.05) 0.034
Model 25) 1.00 1.01 (1.00-1.02) 0.004 1.02 (0.99-1.04) 0.142
Pharynx
No. of cases 115 298 6
Model 14) 1.00 1.11 (0.90-1.38) 0.340 0.65 (0.28-1.48) 0.302
Model 25) 1.00 1.13 (0.91-1.40) 0.285 0.63 (0.27-1.44) 0.270
Larynx
No. of cases 57 126 5
Model 14) 1.00 1.01 (0.74-1.38) 0.955 1.57 (0.63-3.95) 0.333
Model 25) 1.00 0.99 (0.72-1.36) 0.947 1.19 (0.47-3.01) 0.713
Esophagus
No. of cases 156 358 12
Model 14) 1.00 1.07 (0.88-1.29) 0.495 1.55 (0.86-2.80) 0.142
Model 25) 1.00 1.10 (0.91-1.33) 0.348 1.45 (0.80-2.63) 0.216
Colorectal
No. of cases 9,644 21,539 683
Model 14) 1.00 1.01 (0.99-1.04) 0.364 1.20 (1.11-1.29) < 0.001
Model 25) 1.00 1.00 (0.97-1.02) 0.860 1.15 (1.07-1.25) < 0.001
Table 3. continued
Cancer site Vegetables Vegetables + Meat Meat
(reference) RR (95% CI)1) P-value2) RR (95% CI)1) P-value3)
Colon
No. of cases 5,806 12,759 400
Model 14) 1.00 1.00 (0.97-1.03) 0.807 1.17 (1.06-1.30) 0.002
Model 25) 1.00 0.98 (0.95-1.01) 0.231 1.13 (1.02-1.25) 0.022
Rectal
No. of cases 3,486 8,011 260
Model 14) 1.00 1.03 (0.99-1.08) 0.106 1.20 (1.06-1.37) 0.004
Model 25) 1.00 1.02 (0.98-1.06) 0.299 1.17 (1.03-1.33) 0.017
Liver
No. of cases 4,001 8,040 209
Model 14) 1.00 0.92 (0.89-0.96) < 0.001 0.97 (0.84-1.11) 0.663
Model 25) 1.00 0.91 (0.87-0.94) < 0.001 0.91 (0.79-1.04) 0.170
Lung
No. of cases 6,568 14,151 352
Model 14) 1.00 0.99 (0.96-1.02) 0.355 0.97 (0.87-1.08) 0.622
Model 25) 1.00 0.99 (0.96-1.02) 0.686 0.94 (0.85-1.05) 0.293
Oral
No. of cases 476 1,091 33
Model 14) 1.00 0.99 (0.89-1.10) 0.822 0.86 (0.60-1.23) 0.416
Model 25) 1.00 0.98 (0.87-1.09) 0.660 0.82 (0.58-1.18) 0.291
Kidney
No. of cases 1,078 2,631 82
Model 14) 1.00 1.06 (0.99-1.14) 0.101 1.02 (0.81-1.28) 0.861
Model 25) 1.00 1.04 (0.97-1.12) 0.292 0.99 (0.79-1.25) 0.959
Pancreas
No. of cases 2,686 5,924 136
Model 14) 1.00 1.02 (0.98-1.07) 0.316 1.01 (0.85-1.20) 0.912
Model 25) 1.00 1.02 (0.97-1.07) 0.437 0.97 (0.82-1.15) 0.723
Stomach
No. of cases 9,845 22,469 641
Model 14) 1.00 1.01 (0.99-1.04) 0.339 0.95 (0.88-1.03) 0.243
Model 25) 1.00 1.01 (0.99-1.03) 0.399 0.94 (0.86-1.01) 0.104
Ureter
No. of cases 222 427 11
Model 14) 1.00 0.90 (0.77-1.06) 0.213 1.06 (0.58-1.94) 0.856
Model 25) 1.00 0.89 (0.75-1.05) 0.155 1.03 (0.56-1.89) 0.929
Bladder
No. of cases 845 1,814 35
Model 14) 1.00 0.99 (0.92-1.08) 0.876 0.80 (0.57-1.13) 0.207
Model 25) 1.00 1.00 (0.92-1.09) 0.950 0.80 (0.57-1.12) 0.199
Gallbladder
No. of cases 1,340 2,994 84
Model 14) 1.00 1.04 (0.97-1.11) 0.252 1.26 (1.01-1.58) 0.039
Model 25) 1.00 1.02 (0.96-1.09) 0.481 1.22 (0.98-1.53) 0.073
Breast (< 50 y)6)
No. of cases 4,724 14,780 937
Model 14) 1.00 1.03 (0.99-1.06) 0.106 1.05 (0.98-1.13) 0.140
Model 25) 1.00 1.04 (1.00-1.07) 0.028 1.08 (1.00-1.16) 0.038
졌다. 폐암과 신장암 위험은 육식을 주로 섭취하는 군에서 채 식을 주로 섭취하는 군에 비해 각각 4% (95% CI: 1.00- 1.09, P = 0.047), 18% (95% CI: 1.08-1.29, P <
0.001) 더 높았다. 전립선암은 골고루 섭취하는 군에서 발 생 위험이 4% (95% CI: 1.01-1.07; P = 0.005) 더 높 은 것으로 나타났다. 육식을 주로 섭취하는 군에서는 발생위 험이 5% (95% CI: 0.99-1.12; P = 0.137) 더 높았지 만 통계적으로 유의하지는 않았다. 그 외 암은 유의한 연관 성이 없었다.
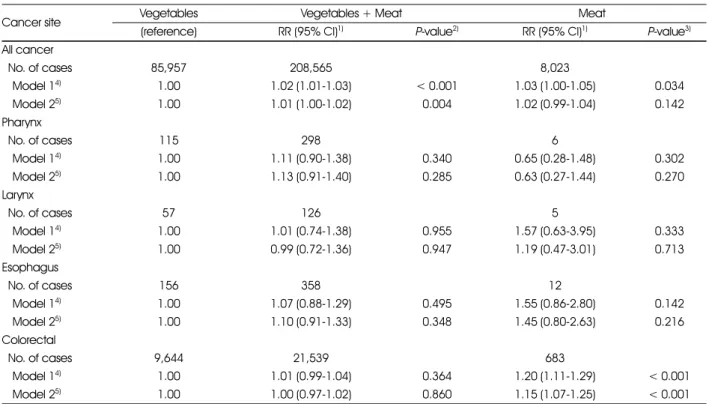
여성의 경우 모든 암의 발생 위험이 채식을 주로 섭취하는
군에 비해 채소와 육식을 골고루 섭취하는 군이 1% (95%
CI: 1.00-1.02; P = 0.004) 더 높은 것으로 나타났다. 육 식을 주로 섭취하는 군에서는 발생위험이 2% (95% CI:
0.99-1.04; P = 0.142) 높았지만 통계적으로 유의하지는 않았다. 대장암은 채식을 주로 섭취하는 군에 비해 육식을 주 로 섭취하는 군에서 발생 위험이 15% (95% CI: 1.07- 1.25; P < 0.001) 더 높았고, 결장암과 직장암은 각각 13%
(95% CI: 1.02-1.25; P = 0.022), 17% (95% CI:
1.03-1.33; P = 0.017) 더 높았다. 간암은 골고루 섭취하 는 군에서 발생 위험이 9% (95% CI: 0.87-0.94; P <
Table 3. continued
Cancer site Vegetables Vegetables + Meat Meat
(reference) RR (95% CI)1) P-value2) RR (95% CI)1) P-value3)
Breast (50+ y)7)
No. of cases 9,056 21,399 679
Model 14) 1.00 1.02 (1.00-1.05) 0.072 1.10 (1.02-1.19) 0.015
Model 25) 1.00 1.01 (0.98-1.03) 0.592 1.08 (1.00-1.16) 0.064
Endometrium (< 50 y)6)
No. of cases 300 1,044 79
Model 14) 1.00 1.14 (1.01-1.30) 0.039 1.40 (1.09-1.80) 0.008
Model 25) 1.00 1.04 (0.92-1.19) 0.528 1.29 (1.00-1.66) 0.049
Endometrium (50+ y)7)
No. of cases 1,324 3,069 89
Model 14) 1.00 1.00 (0.94-1.07) 0.890 0.99 (0.80-1.23) 0.927
Model 25) 1.00 0.98 (0.92-1.05) 0.540 0.96 (0.77-1.19) 0.719
Ovary (< 50 y)6)
No. of cases 438 1,366 95
Model 14) 1.00 1.00 (0.90-1.11) 0.996 1.05 (0.84-1.31) 0.665
Model 25) 1.00 1.01 (0.91-1.13) 0.835 1.07 (0.86-1.35) 0.543
Ovary (50+ y)7)
No. of cases 1,497 3,383 78
Model 14) 1.00 1.01 (0.95-1.07) 0.736 0.88 (0.70-1.10) 0.258
Model 25) 1.00 1.01 (0.95-1.08) 0.714 0.89 (0.71-1.12) 0.327
Cervix (< 50 y)6)
No. of cases 630 2,143 183
Model 14) 1.00 1.09 (1.00-1.19) 0.064 1.38 (1.17-1.63) < 0.001
Model 25) 1.00 1.06 (0.96-1.16) 0.241 1.23 (1.04-1.46) 0.015
Cervix (50+ y)7)
No. of cases 1,742 3,761 101
Model 14) 1.00 0.98 (0.92-1.03) 0.416 1.03 (0.84-1.26) 0.769
Model 25) 1.00 0.97 (0.91-1.03) 0.276 0.98 (0.80-1.20) 0.865
1) Relative risks (95% confidence intervals)
2) P-values for estimates comparing consuming both vegetables and meat to consuming vegetables more often.
3) P-values for estimates comparing consuming meat more often to consuming vegetables more often.
4) Model 1: Stratified by age (20 to < 40, 40 to < 60, and 60+ years) and adjusted for age (years, continuous)
5) Model 2: Model 1 further adjusted for BMI (kg/m2, continuous), alcohol intake (none, 2 ~ 3 times per month, 1 ~ 2 times per week, 3 ~ 4 times per week, and every day), smoking status (never, past, and current), regular exercise (no, 1 ~ 2 times per week, 3 ~ 4 times per week, 5 ~ 6 times per week, and every day), and income levels (low, middle, and high)
6) Cancers were diagnosed before the age of 50.
7) Cancers were diagnosed at the age of 50 and after.
0.001) 더 낮은 것으로 나타났다. 폐경 전 유방암의 발생 위 험은 골고루 섭취하는 군에서 4% (95% CI: 1.00-1.07;
P = 0.028), 육식을 주로 섭취하는 군에서 8% (95% CI:
1.00-1.16; P = 0.038) 더 높았다. 폐경 전 자궁내막암과 자궁경부암의 발생 위험은 육식을 주로 섭취하는 군에서 29%
(95% CI: 1.00-1.66; P = 0.049), 23% (95% CI:
1.04-1.46; P = 0.015) 더 높았다. 그 외 암은 유의한 상 관성이 없었다.
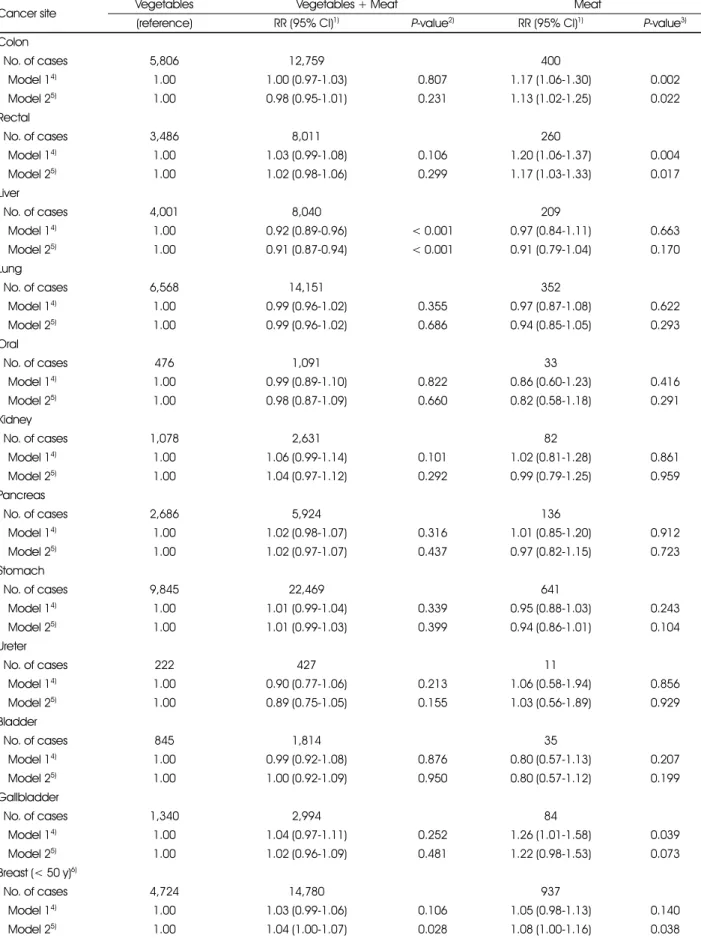
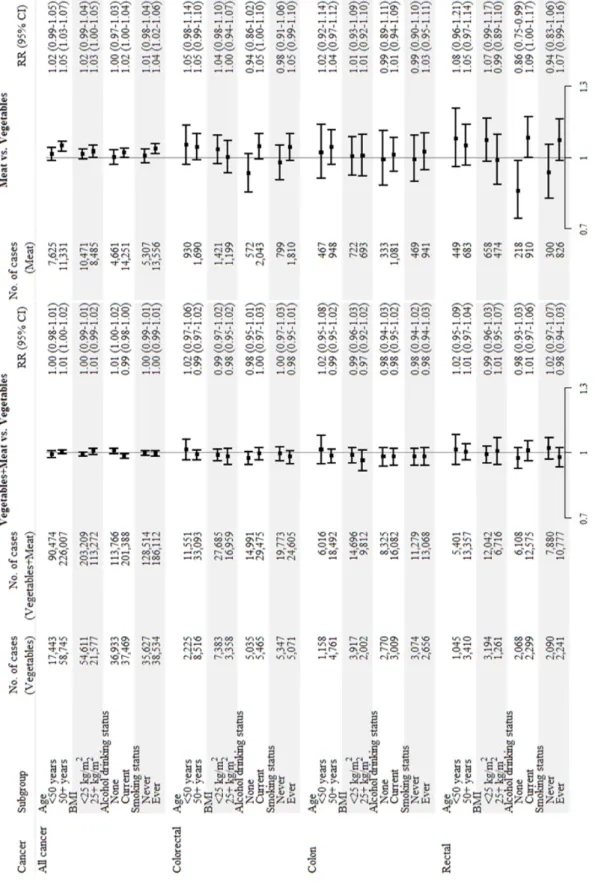
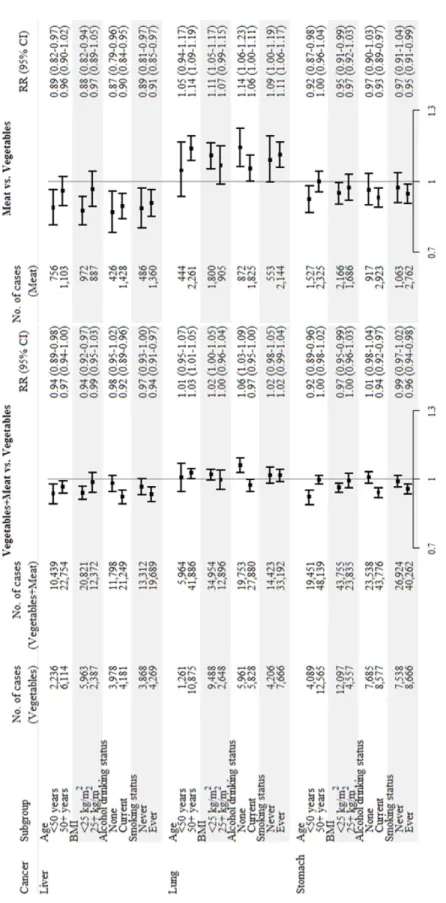
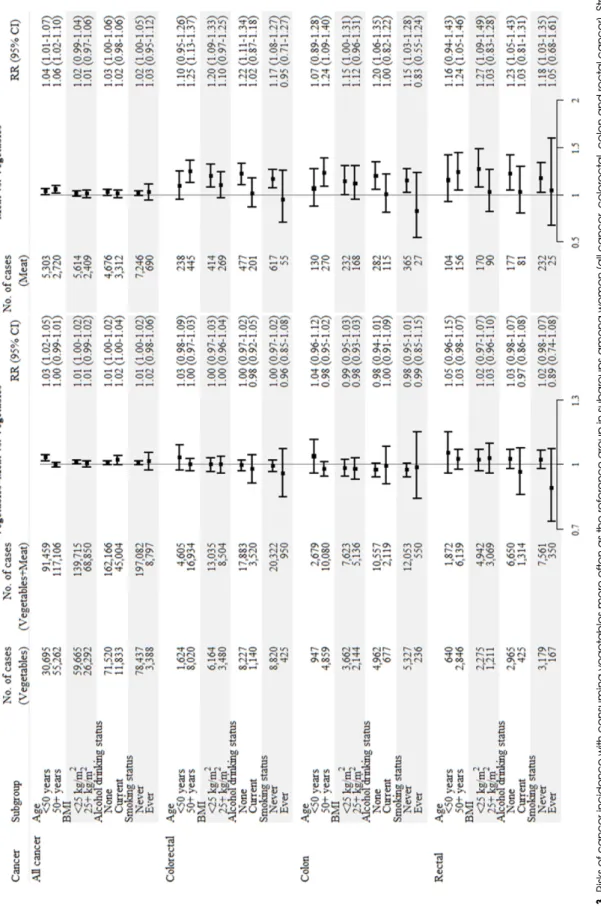
채식과 육식을 골고루 섭취하는 군을 기준(reference)으
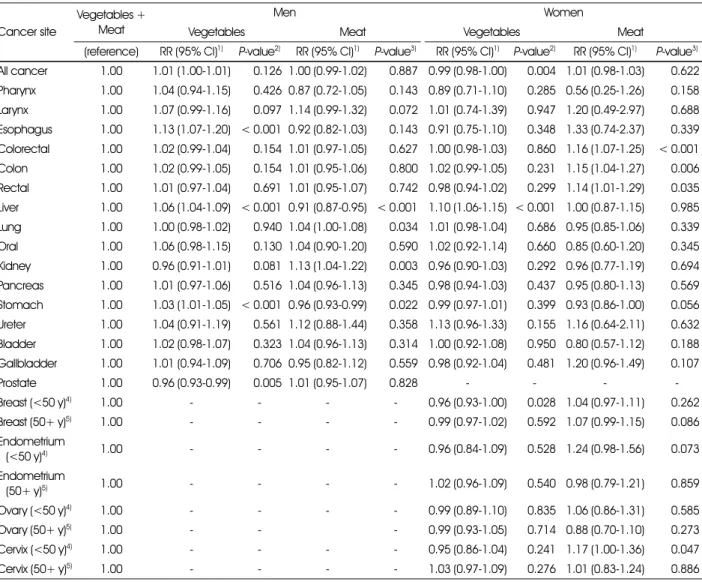
로 하였을 때 남성과 여성의 채소 및 육류의 상대적인 선호 도와 암 발생 위험의 연관성을 분석한 결과는 Table 4와 같 다. 남성은 식도암, 간암, 위암의 경우 채식을 주로 섭취하는 군에서 암 발생 위험이 높았고 반대로 전립선암은 위험이 낮 게 나타났다. 또한 간암과 위암은 육식을 주로 섭취하는 군 에서 암 발생 위험이 낮은 것으로 나타났다. 여성에서는 골 고루 섭취하는 군에 비해 채식을 주로 섭취하는 군에서 모든 암 발생위험이 1% (95% CI: 0.98-1.00, P = 0.004) 낮은 것으로 나타났다. 간암은 채식을 주로 섭취하는 경우 발
Table 4. Risks of cancer incidence according to the relative preference for vegetables and meat with consuming both vegetables and meat as the reference group in men and women
Cancer site
Vegetables + Meat
Men Women
Vegetables Meat Vegetables Meat
(reference) RR (95% CI)1) P-value2) RR (95% CI)1) P-value3) RR (95% CI)1) P-value2) RR (95% CI)1) P-value3) All cancer 1.00 1.01 (1.00-1.01) 0.126 1.00 (0.99-1.02) 0.887 0.99 (0.98-1.00) 0.004 1.01 (0.98-1.03) 0.622 Pharynx 1.00 1.04 (0.94-1.15) 0.426 0.87 (0.72-1.05) 0.143 0.89 (0.71-1.10) 0.285 0.56 (0.25-1.26) 0.158 Larynx 1.00 1.07 (0.99-1.16) 0.097 1.14 (0.99-1.32) 0.072 1.01 (0.74-1.39) 0.947 1.20 (0.49-2.97) 0.688 Esophagus 1.00 1.13 (1.07-1.20) < 0.001 0.92 (0.82-1.03) 0.143 0.91 (0.75-1.10) 0.348 1.33 (0.74-2.37) 0.339 Colorectal 1.00 1.02 (0.99-1.04) 0.154 1.01 (0.97-1.05) 0.627 1.00 (0.98-1.03) 0.860 1.16 (1.07-1.25) < 0.001 Colon 1.00 1.02 (0.99-1.05) 0.154 1.01 (0.95-1.06) 0.800 1.02 (0.99-1.05) 0.231 1.15 (1.04-1.27) 0.006 Rectal 1.00 1.01 (0.97-1.04) 0.691 1.01 (0.95-1.07) 0.742 0.98 (0.94-1.02) 0.299 1.14 (1.01-1.29) 0.035 Liver 1.00 1.06 (1.04-1.09) < 0.001 0.91 (0.87-0.95) < 0.001 1.10 (1.06-1.15) < 0.001 1.00 (0.87-1.15) 0.985 Lung 1.00 1.00 (0.98-1.02) 0.940 1.04 (1.00-1.08) 0.034 1.01 (0.98-1.04) 0.686 0.95 (0.85-1.06) 0.339 Oral 1.00 1.06 (0.98-1.15) 0.130 1.04 (0.90-1.20) 0.590 1.02 (0.92-1.14) 0.660 0.85 (0.60-1.20) 0.345 Kidney 1.00 0.96 (0.91-1.01) 0.081 1.13 (1.04-1.22) 0.003 0.96 (0.90-1.03) 0.292 0.96 (0.77-1.19) 0.694 Pancreas 1.00 1.01 (0.97-1.06) 0.516 1.04 (0.96-1.13) 0.345 0.98 (0.94-1.03) 0.437 0.95 (0.80-1.13) 0.569 Stomach 1.00 1.03 (1.01-1.05) < 0.001 0.96 (0.93-0.99) 0.022 0.99 (0.97-1.01) 0.399 0.93 (0.86-1.00) 0.056 Ureter 1.00 1.04 (0.91-1.19) 0.561 1.12 (0.88-1.44) 0.358 1.13 (0.96-1.33) 0.155 1.16 (0.64-2.11) 0.632 Bladder 1.00 1.02 (0.98-1.07) 0.323 1.04 (0.96-1.13) 0.314 1.00 (0.92-1.08) 0.950 0.80 (0.57-1.12) 0.188 Gallbladder 1.00 1.01 (0.94-1.09) 0.706 0.95 (0.82-1.12) 0.559 0.98 (0.92-1.04) 0.481 1.20 (0.96-1.49) 0.107
Prostate 1.00 0.96 (0.93-0.99) 0.005 1.01 (0.95-1.07) 0.828 - - - -
Breast (<50 y)4) 1.00 - - - - 0.96 (0.93-1.00) 0.028 1.04 (0.97-1.11) 0.262
Breast (50+ y)5) 1.00 - - - - 0.99 (0.97-1.02) 0.592 1.07 (0.99-1.15) 0.086
Endometrium
(<50 y)4) 1.00 - - - - 0.96 (0.84-1.09) 0.528 1.24 (0.98-1.56) 0.073
Endometrium
(50+ y)5) 1.00 - - - - 1.02 (0.96-1.09) 0.540 0.98 (0.79-1.21) 0.859
Ovary (<50 y)4) 1.00 - - - - 0.99 (0.89-1.10) 0.835 1.06 (0.86-1.31) 0.585
Ovary (50+ y)5) 1.00 - - - 0.99 (0.93-1.05) 0.714 0.88 (0.70-1.10) 0.273
Cervix (<50 y)4) 1.00 - - - - 0.95 (0.86-1.04) 0.241 1.17 (1.00-1.36) 0.047
Cervix (50+ y)5) 1.00 - - - - 1.03 (0.97-1.09) 0.276 1.01 (0.83-1.24) 0.886
1) Relative risks (95% confidence intervals); stratified by age (20 to < 40, 40 to < 60, and 60+ years) and adjusted for age (years, continuous), BMI (kg/m2, continuous), alcohol intake (none, 2 ~ 3 times per month, 1 ~ 2 times per week, 3 ~ 4 times per week, and every day), smoking status (never, past, and current), regular exercise (no, 1 ~ 2 times per week, 3 ~ 4 times per week, 5 ~ 6 times per week, and every day), and income levels (low, middle, and high)
2) P-values for estimates comparing consuming vegetables more often to consuming both vegetables and meat.
3) P-values for estimates comparing consuming meat more often to consuming both vegetables and meat.
4) Cancers were diagnosed before the age of 50.
5) Cancers were diagnosed at the age of 50 and after.