1. Introduction
1.1. Research background and objectives
Mild climate due to changes in climate these days frequently generate extreme climate phenomena such as heat wave, intense cold, heavy rain, heavy snow hugely affecting socioeconomic system and natural environment.
Furthermore, urban heat island phenomenon increasing focused on domestic metropolis not only increases building energy consumption but worsens air pollution by increasing ozone concentration in air because of temperature increase. Thus, coping methods towards this currently present the methods that reduce heat absorption amount of building roof and wall (Cool or Green Roofs), methods that reduce heat absorption amount of urban road (Cool or Green Pavements), forest within cities (Shade Tree), creation of green space within cities (Urban Vegetation), formation of water circulation system (Water circulation system).
Summer main issues of human associated with this climate
pISSN 2288-968X, eISSN 2288-9698 http://dx.doi.org/10.12813/kieae.2015.15.3.005
change can be effect and coping of abnormal climate phenomena such as heat wave, typhoon, heavy rain. While possibility of diseases and death by abnormal temperature such as heat wave is increasing, heat wave warnings along with alert were announced nationally in 2013 not to mention the national damage from long-term heat wave due to effect of high pressure in North Pacific near our country. Damage caused by heavy wave varies from affecting personal health to electricity shortage at national level.
Climate change like global warming, urban heat island and heat wave in our country recently causes rapid increase in cooling electricity consumption in summer generating concerns regarding occurrence of national problem in electricity supply with increasing concern towards blackout. As a national response to this, indoor temperature in summer was limited to 28℃ since 2012 and respiratory and skin disease because of too much usage of air conditioner are increasing 4) . According to the up-to-date data of Korea Energy Management Corporation, rise in cooling temperature in summer has the effect that can reduce the energy by about 7% thus it is expected that 14~21% of energy can be saved upon cooling effect where air temperature decreased by 2~3℃.
KIEAE Journal
Korea Institute of Ecological Architecture and Environment 73
1)
A Verification Study on the Temperature reduction Effect of Water Mist Injection
Jeong-Ho Kim * ⋅ Myung-Hun Lee ** ⋅ Yong-Han Yoon ***
* Dept. of Green Technology Convergence, Konkuk University([email protected]) ** Coautohor, Dept. of Forest Science, Konkuk University
*** Corresponding author, Dept. of Green Technology Convergence, Konkuk University([email protected])
A B S T R A C T K E Y W O R D
Purpose: Recently, according to climate changes, human health is exposed to danger over the world and they influence all fields of human society. Due to these climate changes, humans can be exposed to more frequent and extreme scorching heat and cold wave than the present. As precautions against these urban higher temperature and dryness, diverse methods are being sought. Among them, as measures to form cold islands, the evaporative cooling effect realistic to social and economic conditions was examined.
Method: This study was conducted to analyze effects of temperature reduction and cooling according to injection quantity of minute water particles by using a blast sprayer as one of alternatives of alleviation of urban climate changes in outside space in summer. For this, through temperature difference in accordance with the injection quantity per hour of a day, a time zone representing the value of the highest temperature change was analyzed.
Also, by analyzing temperature difference according to the injection quantity per daytime insolation, relation of amounts of insolation and evaporation was investigated. Temperature difference in accordance with distances at the highest temperature with the highest value in temperature changes was analyzed. Result: At the study result, about temperature, as injection quantity increase, temperature reduction was significant statistically at the highest temperature with the most insolation. A factor with the highest influence was judged to be the increase of the injection quantity. According to the injection quantity, it was predicted that 3.1℃ temperature reduction of a daily average in case of 0.16L/min, 3.5℃ temperature reduction of a daily average in case of 0.32L/min, and 4.4℃ temperature reduction of a daily average in case of 0.48L/min.
ⓒ 2015 KIEAE Journal
Evaporative Cooling Temperature reduction Water Mist
One-way Analysis of Vaviance
A C C E P TA N C E IN F O Received March 13, 2015
Final revision received June 12, 2015
Accepted June 15, 2015
Likewise, frequency and intensity of heat wave is worsening and as uncertainty regarding its time of occurrence increases, its damage is getting bigger as well.
Since we can be exposed to more frequent and intense heat wave and intense cold compared to now even in our country, long-term approach towards coping method is required. Besides, as a proper coping methods regarding effect and damage of heat wave, we put importance in temperature reduction using water mist.
Evaporative cooling effect not only reduces building energy but copes with heat wave and urban heat island and is a part of cooling method that uses principles to lower surrounding temperature absorbing nearby heat energy through fast evaporation of water mist sprayed after spraying small sized water droplets to hot air.
Yoon et. al. 1) proposed that installation of evaporation cooling effect system can have cooling effect by as a result of performance evaluation by field experiment utilizing cooling system. In addition, cooling system using water droplets is reported to provide pleasantness obtained from cooling to users 2) , as well as proposing proper control method to facilitate the usage of Water Mist Cooling System using water droplet 3) .
Gibe-Hong 4) as well evaluated that evaporation cooling effect using water droplet is effective when installed in half-open space with outer roof and reported that it was applied to urban railway station, driving range, exhibition in Japan while in Korea it was installed in amusement park, Daejeon ocean world, Yeosu EXPO, chungju world rowing championship 2013 recently. This Water Mist Cooling System can obtain cooling effect by being installed temporarily in benches for example which are exposed to sunlight during daytime and it is also possible to obatin various visual effect with lights at night. Currently, this cooling system is now widely used in the country but it is considered as the most effective and best water and temperature control system using water.
Likewise, there is a need for installment of eco-friendly water droplet mist with energy reduction and temperature reduction effect at outside in summer but domestic researches on system application and creation of water space in the aspect of evaporation cooling effect are still deficient.
According to this, this research intended to examine temperature reduction effect by amount of water mist using mist spray, one of alternative of heat island because of betterment in urban city climate then utilize it as basic data in coping with heat wave.
1.2. Research scope
This research intended to spray water mist outside and examine its cooling effect and directly customized water mist to analyze the effect of mist amount and cooling effect by exposure and composition of experimental device used in this research.
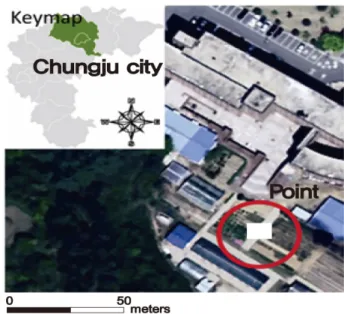
Research target location was laboratory of green fusion technology department of Kunkuk university located in Chunju, Chungbuk like Fig. 1 and research was done for approximately 5 months, from June to November of 2014. Experimental device was installed in asphalt which is impermeable wrapping and nearby soil was mostly shielded with artificial features. July to June became the target of focused investigation because it has rather high monthly average temperature in analyzing weather factors that affect the temperature reduction the most with prominent features of heat island phenomenon due to highest average temperature and insolation among 5-month period.
Fig. 1. Study on site and measurement points location map
2. Pilot study contemplation
According to Giduk, Kim and others 6) if we use evaporative latent heat which is the effect of mist water spray on microclimate, air temperature can be cooled effectively. EXPO2005 exhibition in Japan directly propose this active utilization and reported that applying that cooling effect to specific urban space is equal to lowering 2℃ of air at 7m height per minute as an evaporation effect generated in green space with 100m×100m size.
When applying micro water spray indoor, Sa-Keun, Park and
Hun, Shin 5) used humidifier used for indoor humidity in winter
instead of using nozzle indoor to examine possibility of cooling
effect. To add, through measurement result according to the degree
of humidification (13㎖/min, 10㎖/min, 7.5㎖/min) and the
presence of atmosphere generation (distance 1.5 ~ 1.8m/s), cooling
effect by evaporation can be subtle by water sprayer causing
increase in relative humidity in closed space like indoor but
depending on the degree of humidification, temperature reduction
effect by 1∼1.5℃ was observed. But it was reported that there is a need for review in that indoor cooling effect should be considered comprehensively along with temperature and humidity, air current speed, radiation temperature. Besides, to examine the cooling effect of water spray quantitatively, we performed an experiment at indoor and outdoor and as a result, we confirmed sensory temperature reduction effect by 4.0~6.0℃ at maximum outside and by 1.0~1.5℃ inside.
On the other side, Gibe-Hong 4) performed basic experiment regarding cooling temperature measurement by one nozzle, changes in water mist droplet and spray pressure through experiment using water mist of one nozzle and as a result, he proved that the droplet size of water mist decreases as spray pressure increases showing that big droplet is 40% when spray pressure is 4㎫ and droplet smaller than 19㎛ is 40% when spray pressure is 9.5㎫.
Many data that evaporation cooling effect from water droplet sprayer affects temperature reduction in indoor space isolated from outdoor have been proved. On the other hand, no one paid attention to the aspect of methodology that mentions the cooling effect of air by climate change specifically and prevents this as a way in heat island aspect and researches on fine dust reduction effect in cities or localized cooling effect through water droplet sprayer are almost not being done.
Thus, this research installed water droplet sprayer in outdoor space of building in summer then comprehended the experiment quantitatively regarding temperature reduction effect of water droplet mist amount investigation its function on evaporation cooling effect.
3. Research method
3.1. Installment of water mist
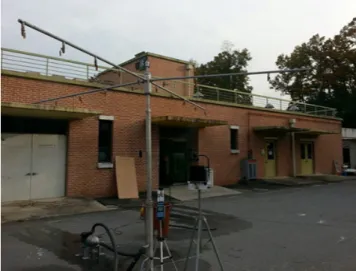
Experimental equipment was installed on asphalt, impermeable wrapping, like Fig. 2 and inverter was used to control the flow along with 5㍱ pump. Water mist supplies highly pressured water (50~60bar) being the device possessing flow of 0.04L/min per nozzle and is a system that controls pleasant environment by spraying fine water through optimal design to expect the range of cooling effect. By spraying water particle smaller than 100㎛, evaporation cooling was designed to be enabled right after spraying without getting wet.
Nozzle was installed at 3m height then valve was installed to change the amount of mist according to need for experiment. 4 pipes with 5 nozzles by direction were allocated in a cross shape and each nozzle was installed in spraying form. Like in Fig. 2, 3, this research customized water mist for experiment. The most
effective utilization of water mist is evaporation cooling right before contact of water with the ground and it is important to control the intensity in pressure and spray nozzle to make the water particle finer.
3.2. Measuring method
1) Outdoor insolation measurement
In case of LI-19 solarimeter used as auxillary equipment of climate factors, tis class is second class certified by ISO with wavelength range 0~1,600Wm -2 or 2,000 Wm -2 and usage temperature range within –40~80℃. To analyze insolation of measured date, we selected location not affected by water particles and measured insolation.
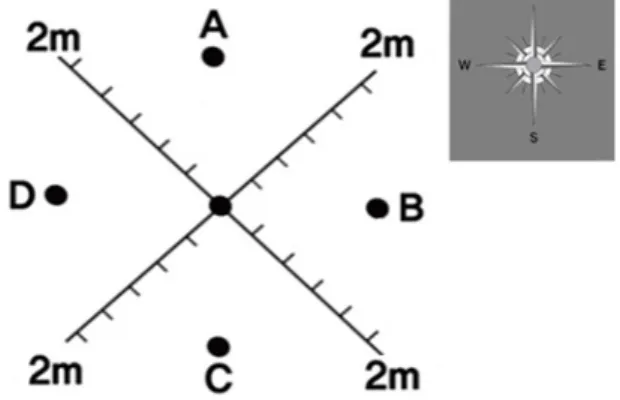
2) Temperature measurement by amount of mist by daily time Water mist was operated from 10:00 to 16:00 and in case of indoor temperature management by time was done by direction of water mist installed. Additionally, to minimize error range, we divided it into 4 spots like Fig. 4 and measured, generalized it at A, B, C, D point every one minute through automatic weather research craft. A point was North (N), B point was East (E), C point was South (S), D point was West (W).
Like Fig. 3, outer temperature was measured at the same time after installing cradle at point from 10m not affected by water mist.
By putting difference in amount of mist upon measurement, 0.16L/min, 0.32L/min, 0.48L/ min were sprayed and temperature change was examined analyzing the difference value in each measured temperature after spraying.
3) Temperature management by mist amount by insolation Like shown in Fig. 2, 3, 5 nozzles are attached to each pipe and mist amount was controlled with each 1, 2, 3 nozzle in four pipes
Fig. 2. Mist supply system
then measurement by mist amount was compared, analyzed clarifying temperature reduction difference by 1 nozzle, 2 nozzles, 3 nozzles. Mist amount by one nozzle was 0.04L/min and each mist amount was measured to be 0.16L/min(4ea × 0.04L/min), 0.32L/min(8ea × 0.04L/min), 0.48L/min(12ea × 0.04L/min).
Measurement time of insolation, indoor and outdoor temperature was from 10am to 4pm and it was done to analyze temperature difference by mist amount by insolation.
4) Temperature measurement by distance at the highest temperature Indicating the point 1m from the center of the mist as indoor like Fig. 5, 6 below, three points 3m. 5m. 7m away from the center were
selected. It was measured when insolation was the highest with the highest temperature before and after 14:00 to analyze the realtion between evaporation time and temperature change. Besides, with difference in mist amount, each difference by distance and temperature change upon spraying 0.16L/min, 0.32L/min, 0.48L/min were analyzed.
3.3. Measuring device
1) Automatic weather research craft
Fig. 7 used Watch dog 2000 Series(AWS : Automatic Weather System, Spectrum Technologis Inc.), an automatic weather research craft, to measure climate factors with the measuring device list. Climate factors are insolation, temperature, wind direction, wind velocity, relative humidity and temperature reduction effect of water mist was analyzed through this.
Measurement time had interval by 1 minute showing average value and measured difference in climate factors inside and outside water mist and evaporation cooling effect by distance.
2) Measuring instrument and solarimeter for outdoor environment Solarimeter (VELOCICALC) can measure the temperature and wind velocity at the same time and this was used to analyze the effect of evaporation cooling and temperature reduction effect of water mist by wind velocity.
Also, solarimeter (L1-19) was used to analyze and compare the difference indoor and outdoor temperature and evaporation cooling effect of water mist by solar radiation.
AWS VELOCICALC LI-19
Fig. 7. Weather element measuring device
Fig. 3. Mist influence measurement points Fig. 6. Mist supply system measurement points by distance
Fig. 4. Mist inner temperature measurement points
Fig. 5. Mist spray system by distance
3.4. Statistical analysis
This research used SPSS Statistics 18 program to clearly analyze the value of temperature difference by water mist and confirm significance between measured data and performed Duncan multiple range test at 5% level and one-way ANOVA. To analyze the temperature difference indoor and outdoor by water mist, we chose the method of one-way ANOVA which analyzes difference in temperature reduction by each mist amount setting outer temperature of target as one independent variable.
4. Result and analysis
4.1. Outdoor insolation measurement
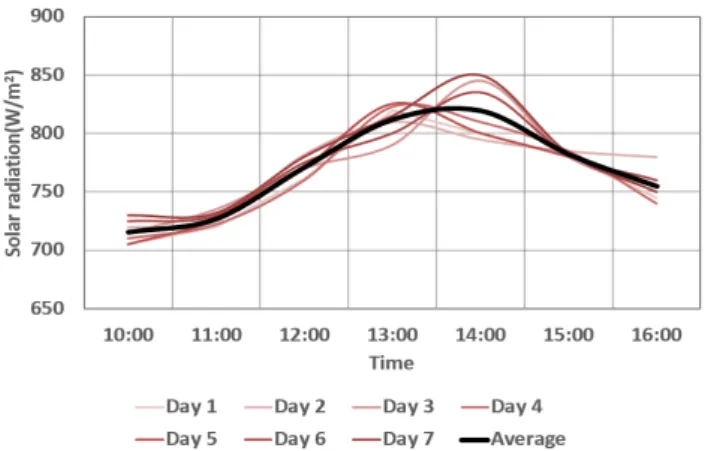
Selecting 7 days with the highest average air temperature as a result of measuring insolation in summer, measuring time of this research, it was shown in time graph and the insolation of this average value showed the highest tendency before and after 13-14:00, which shows the highest temperature. This showed similar result to the distribution of summer air temperature generating heat island phenomenon because of artificial features in cities.
Fig. 8. Change of solar radiation on seven days
4.2. Temperature difference at indoor and outdoor by mist amount by daily time
1) Distribution comparison of temperature change by types (1) 0.16L/min
Following graph in Fig. 8 shows the value of temperature value of mist amount of 0.16L/min by daily time. As a result of temperature difference analysis by measuring types, 10-12:00 showed average temperature difference by 2.6℃ and 12~14:00 showed average by 3.5℃, while 14~16 showing average by 2.9℃
with daily average temperature difference 3.1℃. The time range with the highest value of temperature difference was 12-14, and it was judged that highest temperature before and after 14 showed the highest temperature change value.
Fig. 9. Temperature difference over time : 0.16L/min
(2) 0.32L/min
As a result of temperature change value of mist amount 0.32L/min, following graph in Fig. 9 shows the result. As a result of temperature difference result by measuring time, 10-12 showed 2.8℃
temperature difference on average while12~14 showed 4.0℃ on average, 14~16 showed 3.4℃ on average with 3.5℃ in daily average temperature difference.
Fig. 10. Temperature difference over time : 0.32L/min
The time with the highest average temperature difference was shown to be 12-14 showing the highest temperature change value before and after 14 with highest temperature.
(3) 0.48L/min
Following graph in Fig. 10 shows the temperature change value
of mist amount 0.48L/min by daily time. As a result of measuring
temperature difference by time, 10-12 showed 4.1℃ temperature
difference on average, 12~14 showed 4.7℃ on average, 14~16
showed 4.3℃ on average with analyzed data of 4.4℃ on daily
average. The time with the highest temperature difference value on
average was 12-14, showing the highest temperature change value
at maximum temperature on daily average as shown in above two
types. Like pilot research of Lee, Hyun-woo and Kim, Young-sik, 9)
it was determined that enough cooling effect can be obtained
through adjustment such as increasing mist exposure time or the
number of nozzles since increase in mist amount can heighten evaporation cooling effect much more.
Fig. 11. Temperature difference over time : 0.48L/min
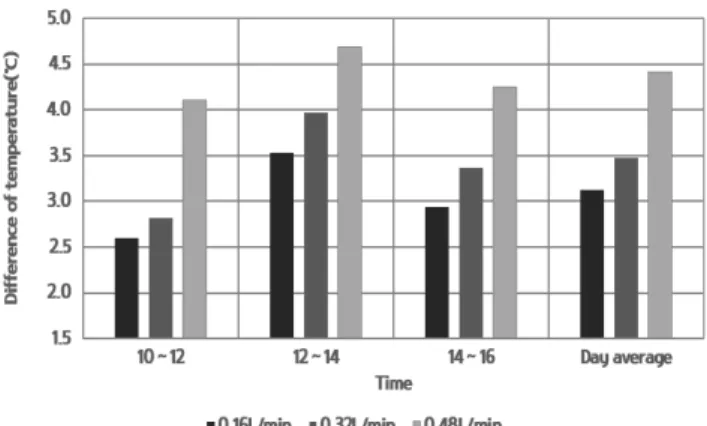
(4) Comparison analysis
Following graph in Fig. 11 shows analysis that combined temperature difference in three types. As a result of analysis, temperature difference showed a tendency to increase as mist amount increases. That difference showed temperature reduction by about 4.0~5.0℃ at maximum and as a result of performing water mist outside, it had temperature reduction effect by 4.0~6.0℃ at maximum. Outside temperature rapidly decreases as water is sprayed and when water mist stops to operate, the temperature starts to reverse rising up to the temperature near water mist operation as time lapses. This was the similar tendency to pilot research 5)8) and we could confirm that temperature difference distribution by water mist by time lapsed was uniform.
Fig. 12. Temperature difference compared over time
As what we examined in distribution change in temperature difference by time lapsed, distribution change of temperature difference was shown somehow large as mist amount increases during the day 9) . Although deviation occurrence of temperature difference by water mist is not large. it is considered to be because of deviation generated by climate factors such as momentous solar
radiation blockage by cloud movement and temporary wind velocity of the wind.
Besides, the highest temperature difference by daily time was measured to be 12-14 and this was determined to be shown before and after 14, the highest temperature as a result of insolation.
2) Value comparison of temperature difference between mist amount by time
(1) 0.48L/min-0.16L/min
Graph in Fig. 12 shows difference value in temperature difference of two types. Thus it is the result that temperature difference value 0.16L/min was deducted from 0.48L/min temperature difference value. As a result of temperature difference value analysis by time 10~12 showed 1.5℃ difference, 12~14 showed 1.2℃, 14~16 showed 1.3℃ with daily average temperature difference value being 1.3℃.
Fig. 13. Temperature differences by injection quantity
(2) 0.48L/min-0.32L/min
Graph in Fig. 13 is the result where temperature difference 0.32L/min was deducted from 0.48L/min temperature difference.
As a result of value analysis in temperature difference by time 10~12 showed 1.3℃ difference, 12~14 showed 0.7℃, 14~16 showed 0.9℃ with daily average temperature difference value being 0.9℃.
Fig. 14. Temperature differences by injection quantity
(3) 0.32L/min-0.16L/min
Graph in Fig. 14 as well shows difference value in temperature difference. This is the result where 0.16L/min temperature difference value is deducted from 0.32L/min temperature difference value. As a result of temperature difference value analysis by time 10~12 showed 0.2℃ difference, 12~14 showed 0.4℃, 14~16 showed 0.5℃ with daily average temperature difference value being 0.4℃.
Fig. 15. Temperature differences by injection quantity
(4) Comparison analysis
Graph in Fig. 15 combined and analyzed the value of temperature difference of three types. As a result of analysis difference value of 0.48L/min-0.16L/min showed the highest temperature difference value and difference value of 0.32L/min-0.16L/min showed daily average 0.4℃ with subtle temperature difference. This is seen to be temperature change according to the difference in water mist amount.
Besides, it was analyzed to maintain a stable temperature difference value during spraying time from 10 to 16 after air temperature decreased by 2~4℃ approximately since the temperature decreased rapidly together with water mist.
Fig. 16. Analysis of the temperature difference by the quantity
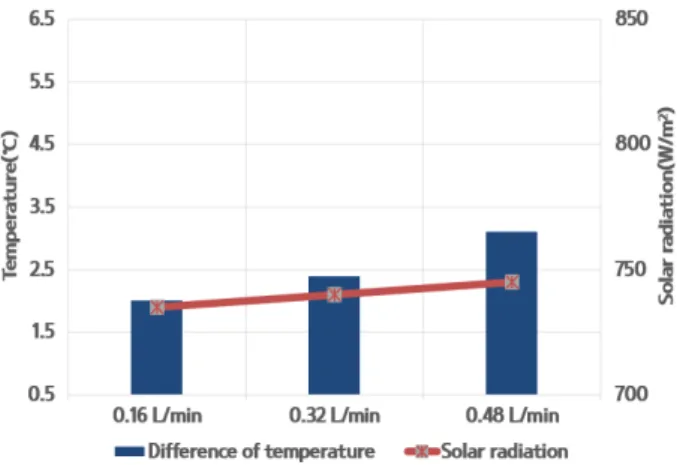
4.3. Temperature difference by mist amount by insolation 1) 700~750W/m 2
To analyze the temperature difference by mist amount by insolation, we intended to measure insolation by time after setting measuring time in a day as 10-16 and analyze the effect of the change on temperature difference. Graph in Fig. 16 shows temperature difference of 700~750W/m 2 insolation. 0.16L/min showed average temperature difference by 2.0℃, 0.32L/min showed average 2.4℃, 0.48L/min showed 3.1℃ temperature difference on average. This is shown to increase with the effect of mist amount when insolation possesses a certain value.
Fig. 17. Temperature differences in solar radiation(700~750W/m
2)
2) 750~800W/m 2
Graph in Fig. 17 shows temperature difference of 750~800W/m 2 . 0.16L/min showed 3.1℃ temperature difference on average, 0.32L/min showed average 4.2℃, 0.48L/min showed 4.5℃.
Besides temperature difference value rather increased compared to insolation 700~750W/m2 and this was considered to be the effect due to insolation increase.
Fig. 18. Temperature differences in solar radiation(750~800W/m2)
3) 800~850W/m 2
Fig. 18 shows temperature difference of insolation 800~850W/m 2 . 0.16L/min showed average temperature difference by 3.7℃, 0.32L/min showed 4.8℃ on average, 0.48L/min showed 5.4℃.
Besides upon maximum temperature of the day with the highest insolation temperature difference showed maximum value and this was considered to show temperature change value increasing evaporation amount as mist amount increases.
Fig. 19. Temperature differences in solar radiation(800~850W/m
2)
4) Comparison analysis
When examining insolation during mist hour, we could see that solar shading ratio was relatively low by water droplet. Combining these implies that temperature drop period gets longer as water mist amount increases but proper control on water droplet mist time is needed since humidity disorder is expected through continuous maintenance of increased humidity. This showed the similar trend to the researches presented in the review of cooling effect from mist time 10) .
4.4. Temperature difference by distance at maximum temperature
1) 0.16L/min Comparison
To analyze temperature difference by distance at daily maximum temperature on average, 1m, 3m, 5m, 7m distance was set in a straight line from the point where water mist is installed then temperature difference was analyzed. Besides mist amount was differentiated to 0.16L/min, 0.32L/min, 0.48L/min to help each measurement.
Fig. 19 showed temperature reduction effect more than 1℃ until 3m straight line in case of 0.16L/min, temperature difference was shown 1m > 3m > 5m > 7m in order. From 5m point, temperature difference was shown to be subtle because of water droplet evaporation.
Fig. 20. Temperature differences in maximum temperature :0.16L/min
2) 0.32L/min Comparison
Like Fig. 20, 0.32L/min showed temperature reduction effect more than 1℃ until 5m straight line, temperature difference was measured to be 1m > 3m > 5m > 7m in order. As well, 7m point showed subtle temperature difference due to evaporation of water droplet.
Fig. 21. Temperature differences in maximum temperature :0.32L/min
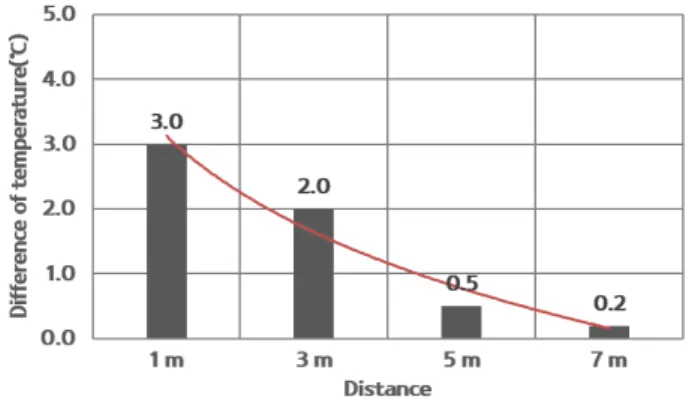
3) 0.48L/min comparison
Graph in Fig. 21 very different from above two measurements show temperature reduction effect more than 1℃ up to 7m in a straight line in case of 0.48L/min, temperature difference was shown to be 1m > 3m > 5m > 7m in order. Besides, temperature difference by distance at maximum temperature was analyzed to affect depending on the mist amount.
Fig. 22. Temperature differences in maximum temperature :0.48L/min
4) Comparison analysis by distance depending on the mist amount As a result of measuring temperature change with difference in mist amount, it was analyzed that temperature reduction width decreases as distance from the mist spray decreases regarding evaporation cooling effect of water droplet by distance and as mist amount increases, influencing range of temperature reduction tended to increase as mist amount increases. Mist amount by distance was considered to affect temperature difference.
Fig. 23. Analysis of the Temperature differences in maximum temperature
4.5. Result of variance analysis of temperature difference by mist amount
1) one- way ANOVA
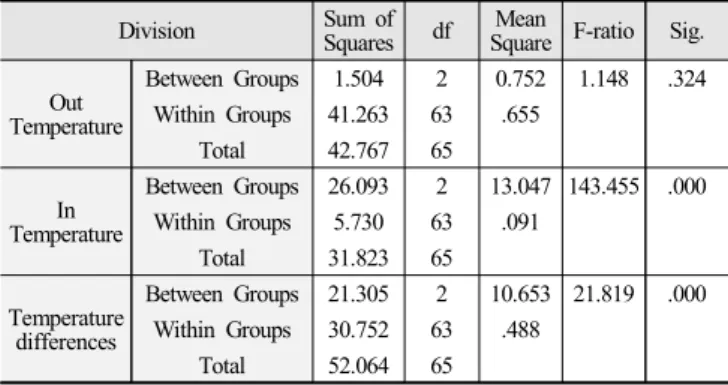
Considering outer temperature difference by mist amount as independent variables, one-way ANOVA was performed setting inner temperature and temperature difference by mist amount as wind variables. Analysis result is like Table 1.
Outer temperature field exceeds significance level of 5%, F-ratio value is 1.148 helping us judge that difference in outer temperature does not affect temperature difference by mist amount. But as mist amount increases, internal temperature and its difference all satisfies significance level 5% exceeding F-ratio value 2.99 so it can be said that there is a difference in temperature reduction by mist amount of each group.
Division Sum of
Squares df Mean
Square F-ratio Sig.
Temperature Out
Between Groups 1.504 2 0.752 1.148 .324 Within Groups 41.263 63 .655
Total 42.767 65 Temperature In
Between Groups 26.093 2 13.047 143.455 .000 Within Groups 5.730 63 .091
Total 31.823 65 Temperature
differences
Between Groups 21.305 2 10.653 21.819 .000 Within Groups 30.752 63 .488
Total 52.064 65
Table 1. Results of ANOVA. on Temperature differences of Injection
2) Duncan multiple range test
Table 2 shows the result of multiple range test of result of inner temperature reduction by mist amount difference. According to statistical analysis, temperature difference was analyzed to be high in order of Type S 3 > Type S 2 > Type S 1 . To add, mist amount of all three Types showed significance.
Division Out
Temperature In
Temperature Temperature differences
Type S
132.67b
z29.60c 3.06c
Type S
232.94b 29.23b 3.71b
Type S
332.58a 28.12a 4.45a
z