ORIGINAL ARTICLE
Assessing Unit Hydrograph Parameters and Peak Runoff Responses from Storm Rainfall Events: A Case Study in Hancheon Basin of Jeju Island
Kanak Kanti Kar, Sung-Kee Yang*, Jun-Ho Lee
Department of Civil Engineering, Jeju National University, Jeju 690-756, Korea
Abstract
Estimation of runoff peak is needed to assess water availability, in order to support the multifaceted water uses and functions, hence to underscore the modalities for efficient water utilization. The magnitude of storm rainfall acts as a primary input for basin level runoff computation. The rainfall-runoff linkage plays a pivotal role in water resource system management and feasibility level planning for resource distribution. Considering this importance, a case study has been carried out in the Hancheon basin of Jeju Island where distinctive hydrological characteristics are investigated for continuous storm rainfall and high permeable geological features. The study aims to estimate unit hydrograph parameters, peak runoff and peak time of storm rainfalls based on Clark unit hydrograph method. For analyzing observed runoff, five storm rainfall events were selected randomly from recent years’ rainfall and HEC-hydrologic modeling system (HMS) model was used for rainfall-runoff data processing. The simulation results showed that the peak runoff varies from 164 to 548 m3/sec and peak time (onset) varies from 8 to 27 hours. A comprehensive relationship between Clark unit hydrograph parameters (time of concentration and storage coefficient) has also been derived in this study. The optimized values of the two parameters were verified by the analysis of variance (ANOVA) and runoff comparison performance were analyzed by root mean square error (RMSE) and Nash-Sutcliffe efficiency (NSE) estimation. After statistical analysis of the Clark parameters significance level was found in 5% and runoff performances were found as 3.97 RMSE and 0.99 NSE, respectively. The calibration and validation results indicated strong coherence of unit hydrograph model responses to the actual situation of historical storm runoff events.
Key words : Storm rainfall, Unit hydrograph, Peak runoff, HEC-HMS, ANOVA
1. Introduction1)
Estimation of peak flood runoff and its timing is a fundamental issue for water resources planning and management sectors, especially in developing the design and controlling the functions of various flood protection and other hydraulic and hydrologic structures (Pegram and Parak, 2004). The assessment of peak runoff depends on rainfall-runoff intensity, as well as the geomorphologic and climatic characteristics of a basin. If a basin area
contains long temporal soaked rain, soil becomes saturated with water, for which no excess rainfall can enter it. Such cases are usually followed by the eventual draining out of excess rainfall into adjacent streams, resulting in a large amount of flow. These spatial and temporal variations of rainfall-runoff largely constraints the pragmatic yet accurate estimation of peak flow, for which the concept of unique unit hydrograph is predominantly used. Unit hydrograph method is accepted procedure for transforming rainfall access to obtain runoff
Received 11 February, 2015; Revised 16 March, 2015;
Accepted 26 March, 2015
*Corresponding author : Sung-Kee Yang, Department of Civil Engineering, Jeju National University, Jeju 690-756, Korea Phone: +82-64-754-3451
E-mail: [email protected]
ⓒ The Korean Environmental Sciences Society. All rights reserved.
This is an Open-Access article distributed under the terms of the Creative Commons Attribution Non-Commercial License (http://
creativecommons.org/licenses/by-nc/3.0) which permits unrestricted non-commercial use, distribution, and reproduction in any medium, provided the original work is properly cited.
time distribution.
The very first unit hydrograph was introduced by Sherman (1932), which considered the physiographic factors of basin to predict hydrograph. A similar effort has been made in this study, which attempts to use the unit hydrograph concept to simulate a peak flood runoff of a typical water-soaked basin area, by analyzing the historical information on rainfall and runoff of multiple storm rainfall events. A typical basin named Hancheon basin from the Jeju Island of South Korea has been chosen in this regard. Jeju Island is positioned in southern part of South Korea and familiar for experiencing diversified rainfall-runoff phenomena due to having a highly permeable geologic feature, driven by volcanic distinctiveness. Over the years, this island has been hit by heavy rainfall events as well as tropical storms. The area contains small patches with mountainous characteristics. The long term annual average rainfall of island is 2,061 mm.
A total number of five rational models for determining the unit hydrograph have been inspected during this case study, the first of which was derived by Clark (1945).
Clark unit hydrograph model works as a significant tool for rainfall-runoff simulation, where basins are assumed to have large length-width ratios and a relatively complex geomorphology (Sabol, 1988). The model implies rainfall -runoff estimations using two major empirical parameters:
time of concentration (Tc) and storage coefficient (R).
The relationship between Tc and R was proposed by Johnstone et al. (1949), using major stream length and slope factor. The second rational method, developed by Snyder (1938), relates the time from centroid of the rainfall to the peak of unit hydrograph. The basic assumption of this method is that different basin area having similar geometrical characteristics will have identical values of peak flood runoff and onset time.
These regional parameters i.e. excess rainfall duration and area’s storage coefficients are determined using the basin lag time. The method also allows for un-gauged basins of similar patterns rainfall. The third method is known as the soil conservation service (SCS, 1964) triangular unit
hydrograph method, which developed a dimensionless hydrograph assumed by the relationship between accumulated total rainfall-runoff, infiltration and initial abstraction. However, implication of this method for high water levels is relatively difficult and the various antecedent moisture conditions (I, II and III) cannot handle rainfall -runoff problems accurately (Capece et al., 1988). The fourth method was the kinematic wave method (Wooding, 1965) which investigated overland flow and created a stream hydrograph assuming gravity force. This is a physics based approach similar to the conventional hydrograph concept. The method requires the use of numerical methods in order to account for non-uniform rainfall and variable of basin characteristics.
The last method is Mod-Clark method, which inspected a computer aided model to incorporate grid cell data into detail hydrograph modeling (USACE, 1995). This method is popular in rainfall-runoff modeling as it can very closely represent the torrential rainfall patterns and support to separate regression analysis using appropriate equations.
To understand the storm rainfall-runoff characteristics of Hancheon basin, several significant recent articles have been studied. Kim et al. (2014) investigated the flood runoff characteristics using surface image velocimetry method by disaster monitoring technology and considering 2012 years’ storm rainfall events. The study gives an idea about observed runoff data measurement by Kalesto meter. Another study inferred that the Hancheon basin stream runoff can be affected by the upstream reservoir operation (Moon et al. 2014). This study estimated peak runoff ‘with’ and ‘without’ reservoir operation scenarios, by considering typhoon Dianmu and typhoon Nari.
Chung et al. (2011) developed threshold runoff simulation method (TRSM) to overcome the limitation of SWAT application for Jeju Island based on 2008-2010 daily limit rainfall-runoffs. The study provides the calibration method techniques and SCS CN idea for Hancheon basin.
Another study has been carried out based on the process of unit hydrograph parameter estimation using stream
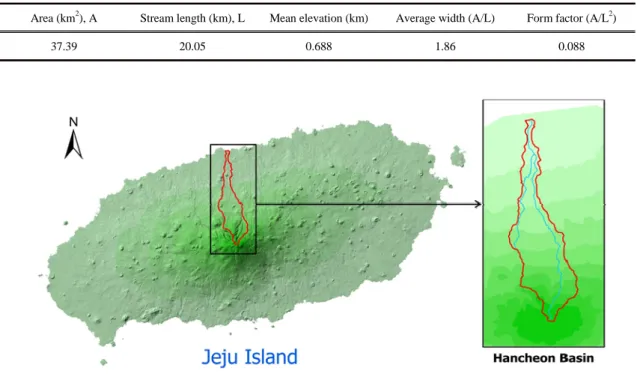
Area (km2), A Stream length (km), L Mean elevation (km) Average width (A/L) Form factor (A/L2)
37.39 20.05 0.688 1.86 0.088
Fig. 1. Location map of Hancheon basin.
Table 1. Key characteristics of Hancheon basin
water velocity, as developed by Jung et al. (2014), where the time of concentration and storage coefficient were estimated by Kraven II and Sabol formula respectively.
The limitation of that study was the unit hydrograph parameter's range which could not be derived.
Considering the proto-typical significance of these study outputs, simplicity of the calculation methods, temporal variability and the overall appropriateness in connection with uniform basins, the Clark unit hydrograph model has been used in this study. The objective of this study is to preliminarily investigate the temporal variations of peak runoff and hence establish Clark unit hydrograph parameters so as to simulate the peak runoff and time of peak. The following sections provided by discussions on study area, data sources, methodological descriptions of Clark’s model, its calibration and validation, study results and lastly, concluding remarks.
2. Study area and data sources
2.1. Study area
The study area encompasses entire Hancheon basin of Jeju Island. This basin is geographically located at northern part of island (Fig. 1), between latitudes and longitudes of 32º 54' to 33º 03' N and 126º 30' to 126º 33', respectively. The basin falls on the semi-urban portion of Jeju Island, with around 688 m mean elevation and an area of about 37.39 km2.
Hancheon basin’s rainwater is drained by Hancheon stream, directly into the ocean. Han stream is the longest, widest and water stressed stream within the Jeju Island.
Water levels often rise during heavy rainfall events and most of the basin area reaches its highest peak flood.
Around 43% of total rainfalls occur in between late June to early September. Table 1 below illustrates the basic characteristics of the Hancheon basin, extracted from geo-spatial data portal.
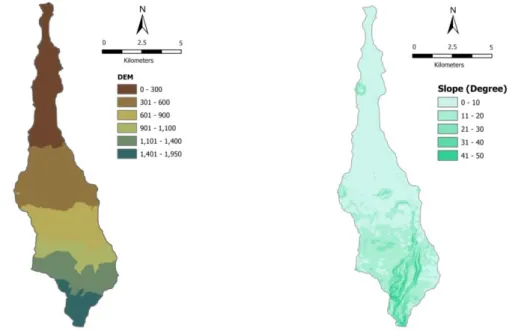
Fig. 2. Digital elevation model (DEM). Fig. 3. Slope analysis.
Table 2. List of using geo-spatial and temporal data
Data Source Description of data
DEM Contour map 30 m horizontal resolution
Soil/land use Korean society of agriculture eng., 1977 1:250,000 spatial scale Rainfall KMA authority of automatic weather system (AWS) 60 min time interval
Stream runoff Kalesto, Hancheon bridge station 10 min time interval
2.2. Data sources
The topography of study area has been generated in the form of a 30-meter resolution digital elevation model (DEM) using ArcGIS 10.2 software (which is available from environmental system research institute, ESRI).
Firstly, information on reduced levels was extracted from contours, and a triangular irregular network (TIN) layer was generated. The TIN layer was then digitized as a DEM (Fig. 2). The DEM acted as the main source to derive basin elevations, stream lengths and drainage command areas. The elevations from mean sea level were found to vary within 10 m to 1,950 m range. The highest peak was found in Halla mountain. Geo-spatial information of the DEM was also used to obtain slopes for the area (Fig. 3). Slope values were even as high as 49 degree in
some areas, wherein 10.8 degree was found as mean slope.
The NRCS curve number method (SCS, 1972) was used to develop a rainfall-runoff relation for basins based on land use pattern, soil type and hydrologic condition (Fig. 4). A recent research carried out by Kar et al. (2014), found that the Hancheon basin area consists of antecedent moisture content II (AMC II) along with a curve number (CN) value is 67.04.
Information on rainfall was collected from five nearby rainfall stations of automatic weather system (AWS) at Jeju, Ara, Eorimok, Jindallaebat and Witsaeorum. Area- averaged values were adopted by the thiessen polygon method (Fig. 5), to take account of the close proximity of average rainfall in each station. The thiessen
Fig. 4. NRCS curve number (CN). Fig. 5. Thiessen area for point rainfall station.
Table 3. Summary of selected five storm rainfall events
Storm events Data availability Total average rainfall (mm)
Heavy rainfall 21-22 April, 2012 314.96
Typhoon Khanun 18-19 July, 2012 293.12
Typhoon Borlaben 22-23August, 2012 961.89
Typhoon Sanba 16-17 September, 2012 659.38
Typhoon Nakri 1-2 August, 2014 678.94
polygon’s area ratio of Jeju, Ara, Eorimok, Jindallaebat and Witsaeorum were found as 0.26, 0.31, 0.14, 0.09 and 0.20, respectively. Runoff data was collected using a fixed Kalesto at Hancheon bridge (latitude 33º 30' 32.75'' N and longitude 126º 30' 41.22'' E). A list of geo-spatial and temporal data used in this study is presented as below (Table 2).
3. Methodology
This study employs to develop the consistency of surface runoff hydrograph according to Clark unit hydro -graph method estimation. The following steps were carried out during the process.
3.1. Storm events selection
Viessman et al. (1989) described three characteristics of heavy rainfall events from a well-defined unit hydrograph which are; the simple hydrograph structure with distinct peak, extended duration of rainfall and uniform spatial distribution. Following the above criterion, five independent heavy rainfall events (Table 3) from 2012 to 2014 have been clustered to be used in model calibration and validation. A study was carried out by Yang et al. (2014) which also considered heavy rainfall events for Hancheon basin. In this study, without antecedents, the rainfall average lag time was found as around 1.5 hr, which increased notably by more than 45%
following an antecedent rainfall event. The analysis
calculated NRCS curve number and percentage of impervious area as 67.04 and 4.71, respectively. After that, the resulting temporal distribution of rainfall at five stations and consequent runoff were assembled in HEC -HMS 2.2.0 version program (USACE, 2000).
3.2. Initial value selection
In order to apply the Clark method in HEC-HMS model, it is necessary to estimate the time-area relationship between runoff travel times and basins contributed area.
Travel time is the only independent variable in this case, which time is required from the most remote part of basin outlet. Generally, it is assumed that travel time is proportional to the stream length from basin’s outlet point. A time-area relationship of basin water which contributes runoff to the basin outlet as a function of time is measured from the onset of rainfall excess.
Initial time of concentration and storage coefficient has been computed with the following empirical formula of Kirpich (1940) and Clark:
Time of concentration, ×
Storage coefficient,
Here, L is the length of stream in km, S represents the land slope of basin and α is coefficient (value varies from 0.4 to 1.4).
3.3. Calibration of Clark parameters
Consequential results of the Clark’s two parameter (Tc and R) were examined by sensitivity analysis. The sensitivity was performed based on trial-and-error method. Meantime, the numerical values (Tc and R) were always assumed in between 0.1 to 3. The optimal values of the parameters were also derived. Afterwards, an optimum pair (Tc, R) was used to compare between observed and simulated peak runoff information.
Meanwhile, the rainfall loss was also investigated. When the peak runoff values start to change by an extremely
minor quantity following slight alterations of Tc and R (within 0.1 to 3), the values for Tc and R were acknowledged.
Effort was also made to reduce the uncertainty of parameters.
3.4. Model performance
The calibrated parameters of four selected storm rainfall events were projected by trial-and-error approach.
These parameter values were firstly adjusted by analysis of variance (ANOVA) method (e.g. Gophen, 2012). After calibration of parameters, Nash-Sutcliffe efficiency (NSE) model (Nash and Sutcliffe, 1970) and peak weighted root mean square error (RMSE) (USACE HEC-HMS, 1998) were used for testing the performance of runoff model results.
NSE =
× RMSE =
Here, n is ordinate number, i is varying from 1 to n, Qoi
is i-th ordinate observed runoff, Qsi is i-th ordinate simulated runoff and is average observed runoff of the hydrograph.
4. Results and discussions
4.1. Data calibration for unit hydrograph parameter estimation
The Kirpich equation has been used by many researchers’ in the recent past (Kumar et al. 2002; Shaoo et al. 2006; Ahmad et al. 2009), using both time-area relationships and geomorphologic parameters of the basin. In this case study, by using the geomorphologic data, Kirpich’s time of concentration and Clark’s storage coefficient values were found as 1.59 and 3.06, respectively.
These initial values were used in the HEC-HMS model
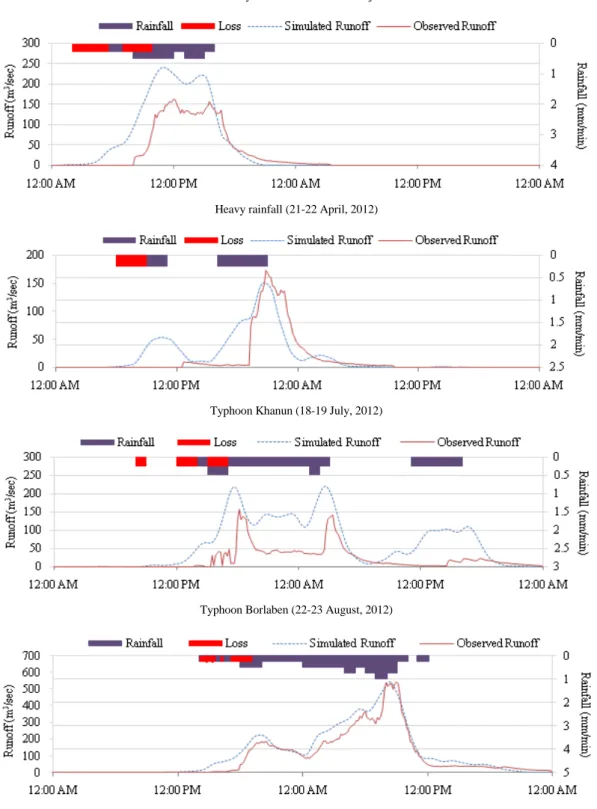
Heavy rainfall (21-22 April, 2012)
Typhoon Khanun (18-19 July, 2012)
Typhoon Borlaben (22-23 August, 2012)
Typhoon Sanba (16-17 September, 2012)
Fig. 6. Comparison between observed and simulated runoff hydrograph.
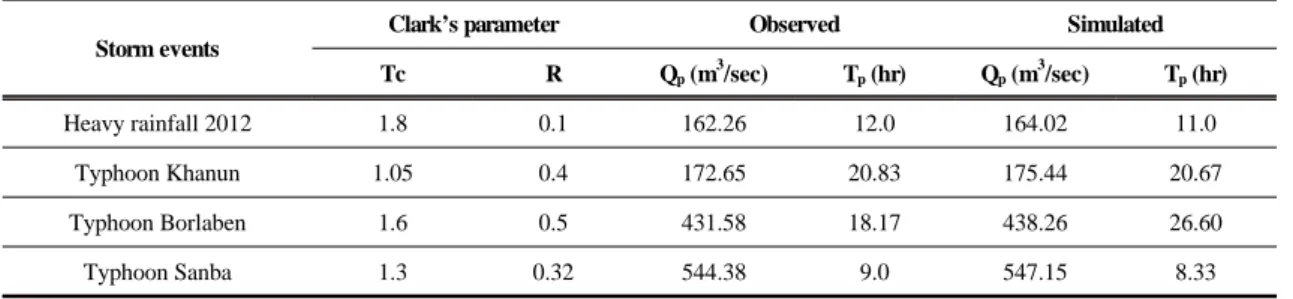
Storm events
Clark’s parameter Observed Simulated
Tc R Qp (m3/sec) Tp (hr) Qp (m3/sec) Tp (hr)
Heavy rainfall 2012 1.8 0.1 162.26 12.0 164.02 11.0
Typhoon Khanun 1.05 0.4 172.65 20.83 175.44 20.67
Typhoon Borlaben 1.6 0.5 431.58 18.17 438.26 26.60
Typhoon Sanba 1.3 0.32 544.38 9.0 547.15 8.33
Table 4. Calibration of Clark parameters and difference between peak runoff hydrographs
Source of variation Sum of squares
Degree of freedom
Mean
square F-value P-value (Below 5%),
Significance F critical (5%)
Between groups 2.453113 1 2.453113
35.58029 0.000995 5.987378
Within groups 0.413675 6 0.068946
Total 2.866788 7
Fig 7. Comparison after calibration between observed and simulated runoff.
Table 5. Statistical Analysis: ANOVA analysis for Clark parameters for peak data estimation of four different rainfall events (Peters, 1993), but it showed an unstable relation between observation and simulation results. After that, trial- and-error method was used for optimizing the objective function i.e. peak weighted root mean square error (RMSE). Following the objective function and trial-and -error analysis of hydrograph parameters (Tc and R) nearest runoff simulation values were shown in table 4 and fig. 6.
During calibration of Clark unit hydrograph parameters, the peak runoff (Qp) and time of peak (Tp)
were also been estimated. Optimized values were showing good coherence between observed and simulated results.
Table 4 shows that, the observed peak runoff was varied from 162.26 to 544.38 m3/sec, whereas simulated runoffs vary by 164.02 to 547.15 m3/sec. On the other hand, observed peak time intervals were found from 9 to 20.83 hr, whereas the simulated peak time showed 8.33 to 26.60 hr. The maximum observed and simulated runoffs were identified for typhoon Sanba. The typhoon Sanba showed 544.38 m3/sec observed and 547.15 m3/sec simulated runoff where 8.33 hr and 9 hr peak times were found.
Source of variation Sum of squares
Degree of freedom
Mean
square F-value P-value (Below 5%),
Significance F critical (5%)
Between groups 2.453113 1 2.453113
35.58029 0.000995 5.987378
Within groups 0.413675 6 0.068946
Total 2.866788 7
Table 5. Statistical Analysis: ANOVA analysis for Clark parameters
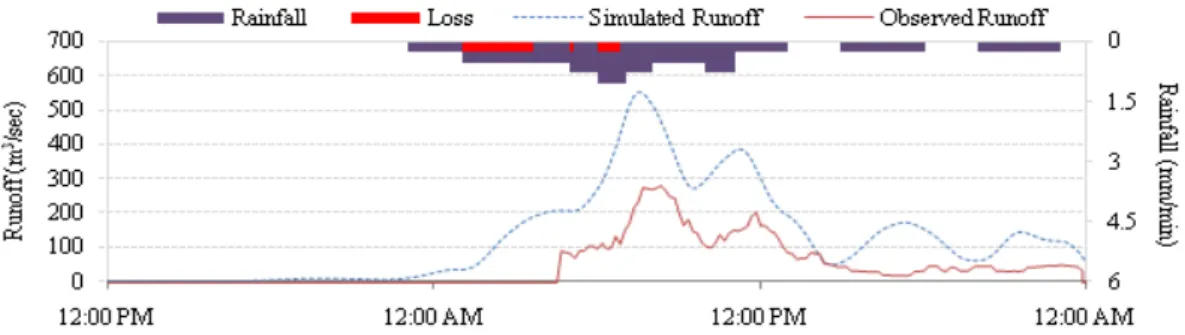
Fig. 8. Validation of model considering typhoon Nakri (1-2 August, 2014).
Noticeable that storm rainfall event’s rising limb to peak runoff was found within short duration.
4.2 Statistical performance analysis for unit hydrograph parameters and runoffs
The performance of four events in terms of parameters was determined based on ANOVA analysis. This analysis obtained a probability value of 0.00009 (below 5% signi -ficance level), which is statistically considerable (Table 5). The estimated variance of Tc and R were 0.11 and 0.03, respectively. Fig. 7 shows a graphical representation with the observed and simulated runoff model comparison result where the determination factor (r-square), RMSE and NSE was 0.91, 3.97 and 0.99, respectively. The following statistical analysis carried out to ensure the good relation.
4.3 Model validation
The model has been developed for setting a reasonable pair value (Tc, R) to estimate unit hydrograph parameters.
The average value of four storm events calibrated parameters (Tc, R) as (1.44, 0.33) was considered as initial
value. After using trial-and-error values, the ANOVA statistical method was again used, until the difference in probability was found insignificant. Unit hydrograph was derived by Clark method in HEC-HMS model and accordingly, excess rain was derived to get the accurate hydrograph. After the trial-and-error based validation, Tc and R values were found as 1.4 and 0.27 respectively, for typhoon Nakri 2014. Subsequently, the probability (p-value) was found below 0.00005 (below 5% significance level) which gave good relation of statistical calculation.
Thereafter, a unique hydrograph was drawn that shows the rainfall access, loss, observed and simulated runoff (Fig. 8). The typhoon Nakri event hydrograph showed that observed and simulated peak runoffs was 553.09 m3/sec and 278.86 m3/sec meanwhile time of peaks was seen 20.35 hr and 19.58 hr, respectively. After validation, observed and simulated runoff’s r-square value was 0.88, near to the calibrated r-square value. Due to the complexity of rainfall-runoff process and geophysical characteristics, a single pair of (Tc and R) sometimes does not show exact result, a significant deviation always be there.
In this case study, the unit hydrograph model also
shows (Fig. 8) the significant deviation (274.76 m3/sec) between observed and simulated runoff for typhoon Nakri. The reasons behind this fluctuation were expected for runoff observation point which was at downstream (dose not consider any upstream discharge data), flow diversion detention pond and reservoir in Hancheon stream. According to Jung (2013) study investigation, upper portion of stream two onsite detention ponds were constructed to reduce the velocity and flood frequency of stream flow storage considering an aesthetic value (maximum 133 m3/sec). Consequently, upstream reservoirs have also been developed to control the flood velocity in Hancheon stream which are considerably impacted on flood runoff. Furthermore, this Moon et al. (2014) study noted that without a reservoir, discharge can be obtained remarkable difference after simulation (maximum 175 m3/sec). Above all discussions and statistical performance, the model result has generated reasonable result.
5. Conclusions
The main findings of this case study were to estimate Clark unit hydrograph parameters and peak runoff response for storm rainfall events. The values of selected model parameters (time of concentration and storage coefficient) showed a variation of 0.1 to 2 hr during calibration and validation, which can be considered as statistically correct. It can also be understood that the observed and simulated runoff responses were easily accessed by the Clark unit hydrograph method. The rainfall access and loss were also considered during the simulation in this study. Overall, application of the Clark method implies that it can also be guided as to un-gauged basins where rainfall and stream runoff data are available.
ACKNOWLEDGEMENTS
This research was supported by a grant (10 CHUD B02) from the Regional Development Research Program funded by Ministry of Land, Infrastructure and Transport
of Korean government. The specific review comments and suggestions from three anonymous reviewers have greatly improved this paper.
REFERENCES
Pegram, G., Parak, M., 2004, A review of the regional maximum flood and rational formula using geomor -phological information and observed floods, Water SA, 30(3), 377 392.
Sherman, L.K., 1932, Stream flow from rainfall by unit graph method, Water Resources Bulletin, 12(2), 381- 392.
Clark, C.O., 1945, Storage and the unit hydrograph, Trans. ASCE, 110, 1419-1446.
Sabol, G.V., 1988, Clark unit hydrograph and R parameter estimation, Journal of Hydraulics Engineering, 114(1), 103-111.
Johnstone, D., Cross, W.P., 1949, Elements of applied hydrology, Ronald Press, New York, USA.
Snyder, F.F., 1938, Synthetic unit graphs, Trans. American Geophysical Union, 19, 447-454.
Soil conservation service (SCS), 1964, SCS national engineering handbook, Section 4: Hydrology, USDA, Washington-DC, USA.
Capece, J.C., Campbell, K.L., Baldwin, L.B., 1988, Estimating runoff peak rates and volumes from flat, high-water-table watersheds, Trans. ASAE, 31(1), 74-81.
Wooding, R.A., 1965, A hydraulic model for the catchment -stream problem, Part I: kinematic wave theory, Journal of Hydrology, 3, 254-267.
USACE HEC-HMS, 1995, A procedure for evaluating runoff parameters for HRAP cells from USGA digital elevation models-drafts, Hydrologic Engineering Center (HEC), Davis, USA.
Kim, Y.S., Yang, S.K., Yu, K., Kim, D.S., 2014, Flood runoff calculation using disaster monitoring CCTV system, Journal of Environmental Science International, 23(4), 571-584.
Moon, D.C., Jung, K.S., Park, W.B., Kim, Y.C., 2014, An evaluation of the flood control effect according to the Hancheon reservoir operation, Journal of Korea Water Resources Association, 47(2), 107-117.
Chung, I.M., Lee, J., Kim, J.T., Na, H., Kim, N.W., 2011, Development of threshold runoff simulation method for runoff analysis of Jeju Island, Journal of Environmental Science International, 20(10), 1347- 1355.
Jung, W.Y., Yang, S.K., Kim, D.S., 2014, Flood discharge to decision of parameters in Han stream watershed, Journal of Environmental Science International, 23(4), 533-541.
Soil Conservation Service (SCS), 1972, SCS national engineering handbook: Hydrology, USDA, Washington -DC, USA.
Kar, K.K., Yang, S.K., Jung, W.Y., 2014, Determination of surface runoff for recent year’s rainfall over Hancheon basin in Jeju Island, Proceedings of Korean Environmental Sciences Society Conference, Daegu, 23, 655-657.
Viessman, W.J., Lewis, G.L. Knapp, J.W., 1989, Introduction to hydrology, 3rd ed., Harper and Row, New York, USA.
Yang, S.K., Kim, D.S., Jung, W.Y., 2014, Rainfall-runoff characteristics in a Jeju stream considering antecedent precipitation, Journal of Environmental Science International, 23(4), 553-560.
USACE HEC-HMS, 2000, http://www.hec.usace.army.
mil/software/hec-hms.
Kirpich, Z.P., 1940, Time of concentration of small agricultural catchments, Journal of Civil Engineering, ASCE, 10(6), 362-365.
Gophen, M., 2012, The ecology of Keratella cochlearis
in lake Kinneret (Israel), Open Journal of Modern Hydrology, 2(1), 1-6.
Nash, J.E., Sutcliffe, J.V., 1970, River flow forecasting through conceptual models, Part-I: a discussion of principles, Journal of Hydrology, 10(3), 282-290.
USACE Hydrological Modeling System (HEC-HMS), 1998, Technical reference manual, http://www.hec.
usace.army.mil/software/hec-hms.
Kumar, R., Chatterjee, C., Lohani, A.K., Kumar, S., Singh, R.D., 2002, Sensitivity analysis of GIUH based on Clark model for a catchment, Water Resources Management, 16, 263-278.
Sahoo, B., Chatterjee, C., Raghuwanshi, N.S., Singh, R., Kumar, R., 2006, Flood estimation by GIUH-based Clark and Nash models, Journal of Hydrologic Engineering, 11(6), 515-525.
Ahmad, M.M., Ghumman, A.R., Ahmad, S., 2009, Estimation of Clark’s instantaneous unit hydrograph parameters and development of direct surface runoff hydrograph, Water Resources Management, 23, 2417-2435.
Peters, J., 1993, Application of rainfall-runoff simulation for flood forecasting, Technical Report No.145, US Army Corps of Engineers, Hydrologic Engineering Center, California, USA.
Jung, W.Y., 2013, The estimation of parametric runoff characteristics and flood discharge based on riverine in-situ measurements in Jeju Island, Ph.D. Dissertation, Jeju National University, Jeju-do, South Korea.