A Comparative Study on Classification Methods of Sleep Stages by Using EEG
Jinwoo Kim†
ABSTRACT
Electrophysiological recordings are considered a reliable method of assessing a person’s alertness.
Sleep medicine is asked to offer objective methods to measure daytime alertness, tiredness and sleepiness.
As EEG signals are non-stationary, the conventional method of frequency analysis is not highly success- ful in recognition of alertness level. In this paper, EEG signals have been analyzed using wavelet trans- form as well as discrete wavelet transform and classification using statistical classifiers such as euclidean and mahalanobis distance classifiers and a promising method SVM (Support Vector Machine). As a result of simulation, the average values of accuracies for the Linear Discriminant Analysis (LDA)-Quadratic, k-Nearest Neighbors (k-NN)-Euclidean, and Linear SVM were 48%, 34.2%, and 86%, respectively.
The experimental results show that SVM classification method offer the better performance for reliable classification of the EEG signal in comparison with the other classification methods.
Key words: Discrete Wavelet Transform(DWT), EEG signal, Sleep stages, SVM
※ Corresponding Author : Jinwoo Kim, Address : (608- 736) Dept. of Information Communication Engineering, 309, Suyeong-ro, Nam-gu, Busan, Rep. Korea. TEL : +82-51-663-5153, FAX : +82-51-625- 1402, E-mail : [email protected]
Receipt date : Dec. 13, 2013, Revision date : Jan. 28, 2014 Approval date : Feb. 3, 2014
†Dept. of Information Communication Engineering, Kyungsung Univ.
※ This research was supported by Kyungsung University Research Grants in 2013.
1. INTRODUCTION
One of the important applications of electro- encephalogram (EEG) processing is the study of the time course of alertness and vigilance of oper- ators who perform monotonous but attention de- manding tasks (air traffic controllers, lorry drivers, etc.) [1-5]. The objective is to avoid potential acci- dents generated by decreased vigilance using a re- al-time system which can continuously monitor vigilance, thereby preventing accidents caused by attention deficit. So, EEG signals give important information about the vigilance states of any subject. But conventional method of classification of EEG signals using mutually exclusive time and
frequency domain representations does not give efficient results.
Therefore, the aim of this study was to establish a method for processing input data from a set of statistical features, which was extracted from dis- crete wavelet transform (DWT) sub-bands of EEG recordings, by the use of support vector machine (SVM) that distinguishes between alert, drowsy and sleep states in arbitrary subjects. EEG dis- tinguishes between states of vigilance, that is, wakefulness and sleep, and to some extent between the ‘levels’ of vigilance within a state. The EEG frequency spectrum is subdivided into (1–4),
(4–8), (8–13), (13–30) and (>30) frequency ranges. During wakefulness, and frequencies in the awake state EEG are of partic- ular interest for research on sleepiness[6].
During active wakefulness (with eyes open), power is usually low unless the subject is severely fatigued. However, in resting conditions (with eyes closed), power is also high when the subject is fully rested. During the transition from resting conditions, with eyes closed, to sleeping a gradual
reduction of power and a gradual increase in q power occurs. Reduced a power and increased power during resting awake periods, with eyes closed, may thus indicate a high motivation for sleeping. Indeed, it was found that subjective sleepiness during awake periods correlates neg- atively with power and positively with power in the awake EEG during prolonged wakefulness.
Spontaneous electrical brain activities, that are EEG signals, are dynamic, stochastic, non-linear and non-stationary [7-9]. The EEG recordings de- pend on the location of the electrodes, their im- pedance and the state of alertness.
In addition, the EEG recordings vary sub- stantially between healthy subjects.
Recently, some studies [10,11] concentrated on detecting the information on drowsiness available from a full EEG spectrum.
[12] used power spectrum analysis of EEG sig- nals for estimating visual attention.
[13] worked on developing an automatic proce- dure for arousal detection during sleep.
They tested this on a group of subjects, in dif- ferent pathological conditions by using wavelet transform.
In numerical analysis and functional analysis, a discrete wavelet transform (DWT) is any wavelet transform for which the wavelets are discretely sampled.
As compared to the conventional method of fre- quency analysis using Fourier transform or short time Fourier transform, wavelets enable analysis with a course to fine multi-resolution perspective of the signal[14]. In this work, discrete wavelet transform (DWT) has been applied for the time–
frequency analysis of EEG signals and SVM for the classification using wavelet coefficients. EEG signals were decomposed into frequency sub- bands using discrete wavelet transform (DWT).
Then a set of statistical features was extracted from the sub-bands to represent the distribution of wavelet coefficients.
2. MATERIALS
2.1 Subjects
In this study, EEG signals were obtained from 20 subjects. The group consisted of 9 females and 11 males with ages ranging from 18 to 65 years and a mean age of 40 years, and a Body Mass Index (BMI) of about 35. Subjects with normal in- telligence and without mental disorders were in- cluded in this study after passing the neurological screening. All recordings were performed in ac- cordance with medically ethical standards.
2.2 Sleep EEG and Specifications of Stages
Sleep is a state that does not react to the sur- rounding environment and reduces feeling. Also, sleep is divided into several sleep stage according to EEG signals (see Fig. 2).
Here, let's take a closer look at the four stages of sleep:
•Stage W(Wake) :
It is the stage of alertness through falling into sleep. In this section there may a more clear dis- tinctiveness and little amount of slowness in alpha rhythms. Beta rhythms may be observed and this may continue through the stage 1 of sleep.
Especially, this stage of sleep is seen more when the sleep is provided under condition of sedative effects. Stage 1 sleep is light sleep where you drift in and out of sleep and can be awakened easily.
In this stage, the eyes move slowly and muscle ac- tivity slows. During this stage, many people expe- rience sudden muscle contractions preceded by a sensation of falling.
•Stage 1:
This stage takes start with attenuating alpha rhythms and revealing 2-7 slow waves. In early periods of this stage, many peoples’ EEGs have low amplitude and mixed frequency activities. However, mid-amplitude slow wave drains right after at- tenuation of alpha rhythms might be encountered
(a)
(b)
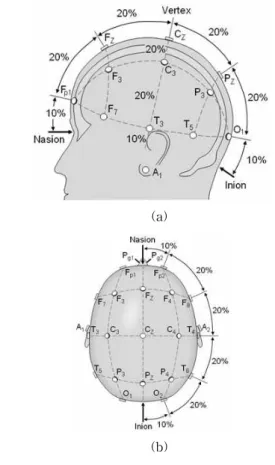
Fig. 1. The international 10-20 system seen from (a) left and (b) above the head.
on some subjects. Alpha rhythms might be re- peated in short time intervals. This is the instant when light stimulus paradoxical alpha rhythms are visualized. Muscle activity gets slower and slow eye movements may occur and last a few seconds.
•Stage 3:
It can be distinguished by high amplitude and slow waves. 20-50% of the whole sleep recording period is occupied by the waves which are 2 and have amplitude above 75 microvolts. K-complexes may happen and sleep needles may not. When a person enters stage 3, extremely slow brain waves called delta waves are interspersed with smaller, faster waves.
•Stage R(REM):
This stage can be distinguished by low voltage EEG patterns, rapid eye movements and generally attenuated muscle movements. Dreams are seen in this stage of the sleep. Even though some visual and behavioral patterns of EEG make the experts consider that this stage is a light sleep stage, in- crease of the auditory stimulants awakening threshold value shows that sleep is deepening in this stage. Therefore this stage is a deep sleep period. In the REM period, breathing becomes more rapid, irregular and shallow, eyes jerk rapidly and limb muscles are temporarily paralyzed. Brain waves during this stage increase to levels experi- enced when a person is awake. Also, heart rate in- creases, blood pressure rises, males develop erec- tions and the body loses some of the ability to reg- ulate its temperature. This is the time when most dreams occur, and, if awoken during REM sleep, a person can remember the dreams. Most people experience three to five intervals of REM sleep each night.
2.3 EEG data acquisition and representation
Silver-plated electrodes were used for the re- cordings, and a C3–A2 standard settlement was
applied to the subject of the experiment, according to the 10–20 international electrode placement system (see Fig. 1).
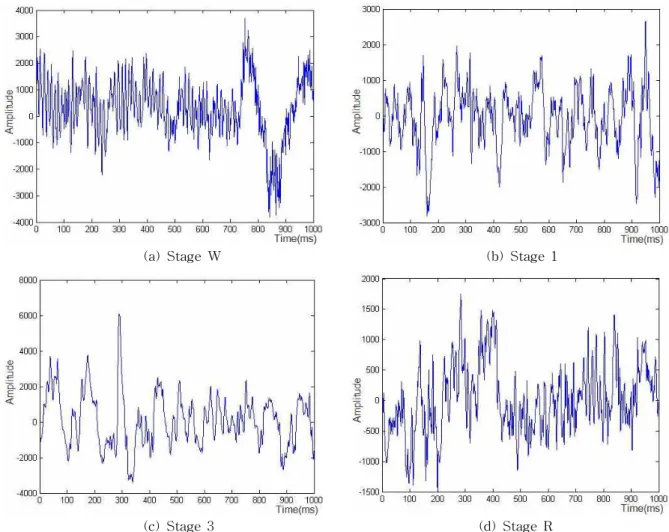
The EEG data used in this study was taken from GRASS MODEL-78 EEG & POLYGRAPH data recording system. The recordings were band pass filtered between 0.3 and 50. The EEG recordings were digitalized with 12-bit resolution, at a sam- pling rate of 128 per channel. Eight channels of the instrument can be used at the same time. Each channel can be gained distinctly and has at most 1000 sampling rate. Each record was scored by two experts for alertness level staging, with a link to the recording. The system provides real-time data processing. Different EEG epochs have been given in Fig. 2. The signals were recorded during the 6∼8-hour episodes. Then these EEG record- ings were divided into 5-second epochs and 75%
overlapped, and these epochs are divided into four frequency sub-bands , , and by using dis-
(a) Stage W (b) Stage 1
(c) Stage 3 (d) Stage R
Fig. 2. Different EEG signals.
crete wavelet transform (DWT).
3. METHODS
3.1 Analysis using discrete wavelet transform
Signal processing techniques are part and parcel of EEG analysis. The sleep EEG signal is non-sta- tionarity and wavelet analysis is very useful for analysis of non-stationary signals. Specially, wavelet transform has a good time-analysis ability for high frequency component, and has a good fre- quency-analysis ability for low frequency compo- nent. Discrete wavelet transform (DWT) is a effi- cient tool applied not only to the field of such signal processing as noise elimination and image com- pression but also in the analysis of disturbances in waveforms owing to its capability to detect
discontinuities.
In this section, we used the technique of discrete wavelet transform (DWT) to characterize the vari- ous sleep stages associated with human sleep.
3.1.1 Wavelet transform
The wavelet transform specifically permits to discrimination of non-stationary signals with dif- ferent frequency features [15]. A signal is sta- tionary if it does not change much over time.
Fourier transform can be applied to the stationary signals. However, like EEG, plenty of signals may contain non-stationary or transitory character- istics. Thus it is not ideal to directly apply Fourier transform to such signals. The wavelet transform decomposes a signal into a set of basic functions called wavelets. These basic functions are obtained
by dilations, contractions and shifts of a unique function called wavelet prototype. Continuous wavelets are functions generated from one single function by dilations and translations [16-19].
(1) Where is real valued and called the shift parameter. The function set () is called a wavelet family. Since the parameters are con- tinuous valued, the transform is called continuous wavelet transform. The definition of classical wavelets as dilates of one function means that high frequency wavelets correspond to or narrow width, while low frequency wavelets have or wider width. In the wavelet transform, is ex- pressed as linear combination of scaling and wave- let functions. Both scaling functions and the wave- let functions are complete sets [16]. However, it is common to employ both wavelet and scaling func- tions in the transform representation. In general, the scale and shift parameters of the discrete wavelet family are given by
,
where and are integers. The function family with discretized parameters becomes
(2)
is called the discrete wavelet transform (DWT) basis. Although it is called DWT, the time variable of the transform is still continuous. The discrete wavelet transform (DWT) coefficients of a continuous time function are similarly defined as
(3)
When the Discrete Wavelet Transform(DWT) set () is complete, the wavelet representation of a function is expressed as
(4)
In general, a function can be completely repre-
sented by using L-finite resolutions of wavelet, and the scaling function with parameters value of
and as
∞∞ ∅
∞∞
(5)
where scaling coefficients are similarly de- fined as
∅
∅
(6)and
∅ ∅
∅
∅ ∅
3.1.2 Sub-band decomposition of discrete wavelet transform (DWT)
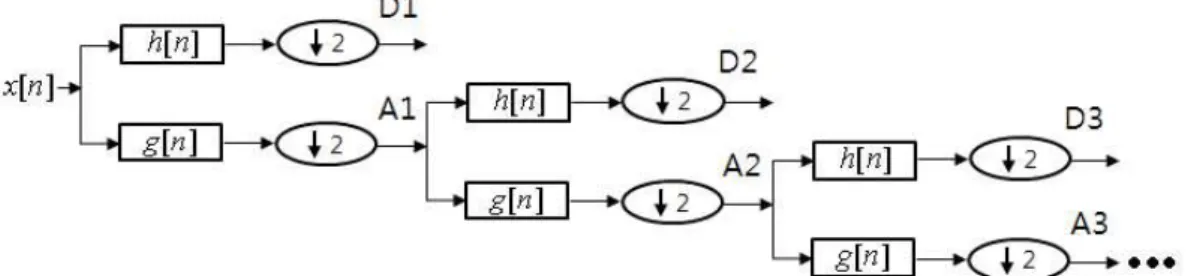
The Discrete Wavelet Transform (DWT), which is based on sub-band coding, is found to yield a fast computation of wavelet transform. It is easy to implement and reduces the computation time and resources required. The Discrete Wavelet Trans- form (DWT) of a sequence x[n] is calculated by passing it through a series of half band high pass and low pass filters. Fig. 3 shows Sub-band de- composition of discrete wavelet transform (DWT) implementation. The low pass filter is denoted by g[n] while the high pass filter is denoted by h[n].
Selection of suitable wavelet and the number of levels of decomposition is very important in analy- sis of signals using discrete wavelet transform (DWT). The typical way is to visually inspect the data first, and if the data are kind of discontinuous, Haar or other sharp wavelet functions are applied;
otherwise a smoother wavelet can be employed.
Usually, tests are performed with different types of wavelets and the one which gives maximum ef-
Fig. 3. Sub-band decomposition of DWT implementation; is the high-pass filter, is the low-pass filter.
Table. 1. Frequencies corresponding to different levels of decomposition for Daubechies order 2 wavelet with a sampling fre- quency of 128.
Decomposed signal Frequency range ()
D1 32-64
D2 16-32
D3 8-16
D4 4-8
A4 0–4
ficiency is selected for the particular application.
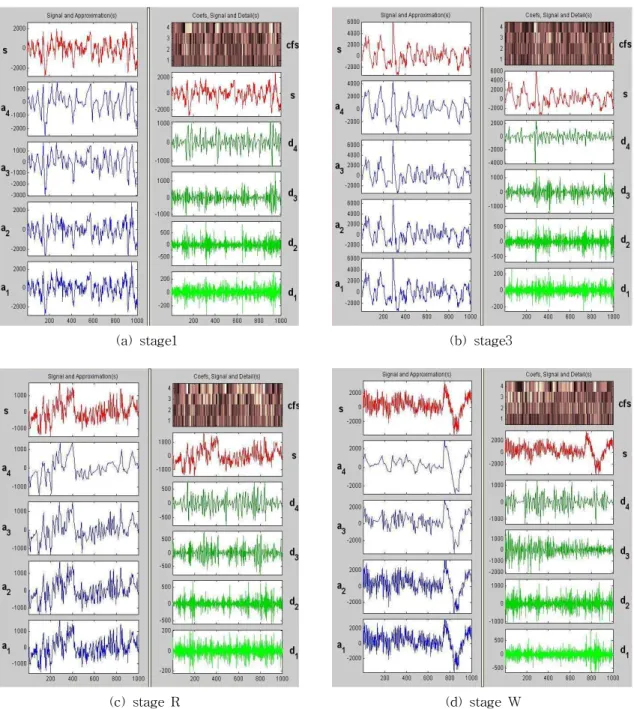
The number of levels of decomposition is chosen based on the dominant frequency components of the signal. The levels are chosen such that those parts of the signal that correlate well with the fre- quencies required for classification of the signal are retained in the wavelet coefficients. Since the EEG signals do not have any useful frequency compo- nents above 30, the number of levels was chosen to be 4. Thus the signal is decomposed into the details D1–D4 and one final approximation, A4.
The ranges of various frequency bands are shown in Table 1. Daubechies order 2 wavelet transform was applied to the stage1, stage3, stage R and stage W signals. Fig. 4 shows four different levels of approximation (identified by A1–A4 and dis- played in the left column) and details (identified by D1– D4 and displayed in the right column) of an EEG signal.
These approximation and detail records are re- constructed from the wavelet coefficients. Approx- imation A3 is obtained by superimposing details D4 on approximation A4. Approximation A2 is ob-
tained by superimposing details D3 on approx- imation A3. Finally, the original signal is obtained by superimposing details D1 on approximation A1.
Wavelet transform acts like a mathematical micro- scope, zooming into small scales to reveal com- pactly spaced events in time and zooming out into large scales to exhibit the global waveform pat- terns [20].
4. CLASSIFICATION ALGORITHMS
After selecting the most discriminatory features, we apply Linear Discriminant Analysis (LDA), k-Nearest Neighbors (k-NN), and Support Vector Machine (SVM) to obtain accuracy on our testing samples. The classification results of these algo- rithms can be used to compare the effectiveness of various feature selection methods.
•LDA uses the distance between cluster cen- ters and data to assign data to the accurate group.
The types of discriminant function: linear, quad- ratic, and mahalanobis.
•k-NN is a typical instance-based prediction model. By k-NN, the class label of a new testing sample is decided by the majority class of its k closest neighbors based on their Euclidean distance.
The types of discriminant function: euclidean, cor- relation, and cosine.
•SVM is a kind of blend of linear modeling and instance-based learning. A SVM selects a small number of critical boundary samples from each class and builds a linear discriminant function that separates them as widely as possible. In the case
(a) stage1 (b) stage3
(c) stage R (d) stage W
Fig. 4. Daubechies order 2 wavelet transform of stage EEG signal, respectively.
that no linear separation is possible, the technique of "kernel" will be used to automatically inject the training samples into a higher-dimensional space, and to learn a separator in that space. The types of discriminant function: linear SVM, Radial basis function(RBF), and polynomial.
5. RESULTS
EEG signals were obtained from 20 subjects.
The group consisted of 9 females and 11 males with ages ranging from 18 to 65 years and a mean age of 40 years, and a Body Mass Index (BMI) of about 35. Performances of classifiers were tested using the data recorded in 10 healthy subjects. EEG signals of the Other 10 subjects were used to train the classifiers we utilized when realising the project. In this work, discrete wavelet transform (DWT) has been applied for the time–
frequency analysis of EEG signals and SVM for
Table. 2. Results for LDA-Linear Classifier LDA-Linear
True False Accuracy
Stage 1 432 6768 6%
Stage 3 4320 2880 60%
Stage R 2952 4248 41%
Stage W 4896 2304 68%
Table. 3. Results for LDA-Quadratic Classifier LDA-Quadratic
True False Accuracy
Stage 1 144 7056 2%
Stage 3 5904 1296 82%
Stage R 3960 3240 55%
Stage W 3816 3384 53%
Table. 4. Results for LDA-Mahalanobis Classifier LDA-Mahalanobis
True False Accuracy
Stage 1 1512 5688 21%
Stage 3 3024 4176 42%
Stage R 1080 6120 15%
Stage W 5256 1944 73%
Table. 5. Results for k-NN-Euclidean Classifier k-NN-Euclidean
True False Accuracy
Stage 1 1800 5400 25%
Stage 3 2376 4824 33%
Stage R 2376 4824 33%
Stage W 3312 3888 46%
Table. 6. Results for k-NN-Correlation Classifier k-NN-Correlation
True False Accuracy
Stage 1 1512 5688 21%
Stage 3 2232 4968 31%
Stage R 2448 4752 34%
Stage W 2160 5040 30%
the classification using wavelet coefficients. EEG signals were decomposed into frequency sub- bands using discrete wavelet transform (DWT).
Then a set of statistical features was extracted from the sub-bands to represent the distribution of wavelet coefficients.
We applied Linear Discriminant Analysis (LDA), k-Nearest Neighbors (k-NN), and Support Vector Machine (SVM) to obtain accuracy on our testing samples. Here, totally 7200 feature vectors are gone through a classification process. Tables 2∼10 shows result of LDA, k-NN, and SVM, re- spectively. Each table is organized is as follows:
in each row the is represented by an specific sleep stage, each column represents the results of the classification.
5.1 LDA Classifiers
For Table 2, the highest accuracy is 68% and the lowest is 6%. The average accuracy rate of LDA-Linear classifier was about 43.7%.
For Table 3, the highest accuracy is 82% and the lowest is 2%. The average accuracy rate of LDA-Quadratic classifier was about 48%.
For Table 4, the highest accuracy is 73% and the lowest is 15%. The average accuracy rate of
LDA-Mahalanobis classifier was about 37.7%.
5.2 k-NN Classifiers
For Table 5, the highest accuracy is 46% and the lowest is 25%. The average accuracy rate of k-NN-Euclidean classifier was about 29.5%.
For Table 6, the highest accuracy is 34% and the lowest is 21%. The average accuracy rate of k-NN-Correlation classifier was about 29%.
For Table 7, the highest accuracy is 34% and the lowest is 22%. The average accuracy rate of k-NN-Cosine classifier was about 29.5%.
5.3 SVM Classifiers
For Table 8, the highest accuracy is 96% and the lowest is 73%. The average accuracy rate of Linear SVM classifier was about 86%.
Table. 7. Results for k-NN-Cosine Classifier k-NN-Cosine
True False Accuracy
Stage 1 1584 5616 22%
Stage 3 2160 5040 30%
Stage R 2448 4752 34%
Stage W 2304 4896 32%
Table. 8. Results for Linear SVM Classifier Linear SVM
True False Accuracy
Stage 1 6696 504 93%
Stage 3 5904 1296 82%
Stage R 5256 1944 73%
Stage W 6912 288 96%
Table. 9. Results for RBF Classifier
RBF(Radial basis function)
True False Accuracy
Stage 1 5976 1224 83%
Stage 3 1080 6120 15%
Stage R 6984 216 97%
Stage W 2088 5112 29%
Table. 10. Results for Polynomial Classifier Polynomial
True False Accuracy
Stage 1 7200 0 100%
Stage 3 3384 3816 47%
Stage R 2952 4248 41%
Stage W 7128 72 99%
For Table 9, the highest accuracy is 97% and the lowest is 15%. The average accuracy rate of RBF classifier was about 56%.
For Table 10, the highest accuracy is 100% and the lowest is 41%. The average accuracy rate of Polynomial classifier was about 71.5%.
In the case of low accuracy, we can think that mixed up with other sleep stage. For example, classification accuracy for Stage 1 of Table 3 is only 2%( Stage 1 gets mixed up with Stage R and
Stage W). As a result of simulation, the average values of accuracies for the Linear Discriminant Analysis (LDA)-Quadratic, k-Nearest Neighbors (k-NN)-Euclidean, and Linear SVM were 48%, 34.2%, and 86%, respectively. The experimental results show that SVM classification method offer the better performance for reliable classification of the EEG signal in comparison with the other clas- sification methods.
6. CONCLUSION
A lot of information about brain functions are hidden in EEG signals. EEG signals give important information about the vigilance states of any subject. Specially, One of the important applica- tions of electroencephalogram (EEG) processing is the study of the time course of alertness and vigi- lance of operators who perform monotonous but attention demanding tasks (air traffic controllers, lorry drivers, etc.). But, Conventional method of classification of EEG signals using mutually ex- clusive time and frequency domain representations does not give efficient results. In this work, method of sleep stage classification of EEG signals is proposed. We was investigating sleep stage in- formations of a human EEG by using Wavelet Transformation method for the extraction one of the very important features. In this study, EEG signals were obtained from 20 subjects. The group consisted of 9 females and 11 males with ages ranging from 18 to 65 years and a mean age of 40 years, and a Body Mass Index (BMI) of about 35. Subjects with normal intelligence and without mental disorders were included in this study after passing the neurological screening.
The number of levels of decomposition is chosen based on the dominant frequency components of the signal. The levels are chosen such that those parts of the signal that correlate well with the fre- quencies required for classification of the signal are retained in the wavelet coefficients. Since the EEG
signals do not have any useful frequency compo- nents above 30 Hz, the number of levels was chos- en to be 4. EEG signals were decomposed into the frequency sub-bands using wavelet transform in order to find entropy of a EEG signal segment by wavelet coefficients and a set of statistical features. Then these statistical features were used as an input to above mentioned classifiers with four discrete outputs: stage 1, stage 3 stage REM and stage AWAKE.
Features go through a selection so as to find the best approach to purpose of the project. For Classification, We used total 7200 feature vectors.
As a result of simulation, the average values of accuracies for the Linear Discriminant Analysis (LDA)-Quadratic, k-Nearest Neighbors (k-NN)- Euclidean, and Linear SVM were 48%, 34.2%, and 86%, respectively. Thus, the experimental results show that Support Vector Machine (SVM) classi- fication method offer the better performance for re- liable classification of the EEG signal in compar- ison with the other classification methods. The ac- curacy of this study is likely to be raised with the improvement of the biomedical signal acquisition tools, with the development of digital filters and of course with the development of more accurate signal processing algorithms. Finally, it can be concluded that method of sleep stage classification of this study will be useful for the neurologists to analyze awake-sleep correlations.
REFERENCES
[ 1 ] R.R Johnson, D.P. Popovic, R.E Olmstead, M.
Stikic, D.J Levendowski, and C. Berka,
"Drowsiness/Alertness Algorithm Develop- ment and Validation using Synchronized EEG and Cognitive Performance to Individualize a Generalized Model," Biol. Psychol., Vol. 87, No. 2, pp. 241-250, 2011.
[ 2 ] E.A. Schmidt, M. Schrauf, M. Simon, M.
Fritzsche, A. Buchner, and W.E. Kincses,
"Drivers' Misjudgement of Vigilance State during Prolonged Monotonous Daytime Driving," Accident Analysis and Prevention, Vol. 41, No. 5, pp. 1087-1093, 2009.
[ 3 ] B.T Jap, S. Lal, and P. Fischer, "Comparing Combinations of EEG Activity in Train Drivers during Monotonous Driving," Expert Syst., Vol. 38, No. 1, pp. 996-1003, 2011.
[ 4 ] M.B. Kurt, N. Sezgin, M. Akin, G. Kirbas, and M. Bayram, "The ANN-based Computing of Drowsy Level," Expert Syst Appl., Vol. 36, No.
2, pp. 2534-2542, 2009.
[ 5 ] S.I. Shin, J.H. Cho, and M.N. Kim,
"Proposition for 4 Channel Frontal Lobe Electrode Configuration and Study on EOG Removal from Measured EEG," Journal of Korea Nultimedia Society, Vol. 6, No. 1, pp.
167-175, 2003.
[ 6 ] V.M. Yeo, X. Li, K. Shen, and E.P. V. Wider- Smith, "Can SVM be used for Automatic EEG Detection of Drowsiness during Car Driving?," Saf. Sci., Vol. 47, No. 1, pp. 115-124, 2009.
[ 7 ] U.R. Acharya, O. Faust, N. Kannathal, T.
Chua, and S. Laxminarayan, "Non-linear Analysis of EEG Signals at Various Sleep Stages,"Computer Methods Programs Biomed., Vol. 80, No. 1, pp. 37-45, 2005.
[ 8 ] C.J. Stam, "Nonlinear Dynamical Analysis of EEG and MEG:Review of an Emerging Field,"
Clinical Neurophysiol., Vol. 116, No. 10, pp.
2266-2301, 2005.
[ 9 ] S.R. Liyanage, C. Guan, H. Zhang, K. Ang, J.
Xu, and T.H. Lee, "Dynamically Weighted Ensemble Classification for Non-stationary EEG Processing,"J. Neural Eng., Vol. 10, No.
3, pp. 1-10, 2013.
[ 10 ] Y. Yin, Y. Zhu, S. Xiong, and J. Zhang,
"Drowsiness Detection from EEG Spectrum Analysis," Informatics in Control, Automation and Robotics, Vol. 133, No. 2012, pp. 753-759, 2012.
[11] C.T. Lin, K.C. Huang, C.H. Chuang, L.W. Ko, and T.P. Jung, "Can Arousing Feedback Rectify Lapses in Driving? Prediction from EEG Power Spectra,"J. Neural Eng., Vol. 10, No. 5, pp. 1-10, 2013.
[12] M.K. Ahirwal and N.D londhe, "Power Spectrum Analysis of EEG Signals for Estim- ating Visual Attention," International Journal of Computer Applications, Vol. 42, No. 15, pp.
22-25, 2012.
[13] F.D. Carli, L. Nobili, P. Gelcich, and F. Ferrillo,
"A Method For The Automatic Detection Of Arousals During Sleep," Sleep, Vol. 22, No. 5, pp. 561-572, 1999.
[14] A. Kandaswamy, C.S. Kumar, R.P. Ramana- than, S. Jayaraman, and N. Malmurugan,
"Neural Classification of Lung Sounds using Wavelet Coefficients," Computers in Biology and Medicine, Vol. 34, No. 6, pp. 523-537, 2004.
[15] I. Daubechies, Ten Lectures on Wavelets, SIAM, Philadelphia, 1992.
[16] O. Rioul and M. Vetterli, “Wavelets and Signal Processing,” IEEE Sig. Proc. Magazine, Vol.
8, No. 4, pp. 14-38, 1991.
[17] W. Yan and W. Ren, "Use of Continuous- Wavelet Transmissibility for Structural Operational Modal Analysis,"J. Struct. Eng., Vol. 139, No. 9, pp. 1444-1456, 2013.
[18] V. Krishnaveni, S. Jayaraman, S. Aravind, V.
Hariharasudhan, and K. Ramadoss, "Auto- matic Identification and Removal of Ocular Artifacts from EEG using Wavelet Transform,"
Measurement Science Review, Vol. 6, No. 4, pp. 45-57, 2006.
[19] F. Protopapa, D. Mylonas, K. Spiliotis, C.
Siettos, N. Smyrnis, and I. Evdokimidis,
"Dynamic Analysis of EEG Signals during Spatial Working Memory used for Either Perception Discrimination or Planning of Action," Conf Proc IEEE Eng Med Biol Soc., pp. 5896-5899, 2011.
[20] H. Adeli, Z. Zhou, and N. Dadmehr, “Analysis of EEG Records in an Epileptic Patient using Wavelet Transform,” J. Neurosci. Meth., Vol.
123, No. 1, pp. 69-87, 2003.
Jinwoo Kim
He received the B.S degree in Electrical Engineering from Myongji University in 1992 and the M.S and Ph.D. degrees in Electronic Engineering and System design Engineering from Fukui National University, Fukui, Japan, in 1996 and 1999, respectively. From 2000 to 2003, he was a contract Professor in the Department of Information Communication and Computer Engin- eering at Hanbat National University, Daejeon, Korea.
Since 2003 he has been with the Department of Information and Communication Engineering at Kyung- sung University, Busan, Korea, where he is currently an associate professor. From Dec., 2007 to Mar., 2012, he was a visiting researcher in the Department of Bioengineering at Tokyo University, Japan. His cur- rent research interests include image processing, pat- tern recognition, Brain-Computer Interface (BCI), and medical imaging technology.