CpG Array Analysis of Histone H3 Lysine 4 Trimethylation by Chromatin Immunoprecipitation Linked to Microarrays
Analysis in Peripheral Blood Mononuclear Cells of IgA Nephropathy Patients
Suwen Qi,
1Weiguo Sui,
2Ming Yang,
2Jiejing Chen,
2and Yong Dai
11Key Laboratory of Laboratory Medical Diagnostics, Ministry of Education, Chongqing Medical University, Chongqing;
2Kidney Transplantation and Hemopurification Center of PLA, 181th Hospital of Guangzhou Military Area of PLA, Guangxi, China.
Received: March 10, 2011 Revised: May 1, 2011 Accepted: May 2, 2011
Corresponding author: Dr. Yong Dai, Shenzhen People’s Hospital, No.1017, Dongmen North Rd, Shenzhen, Guangdong Province, 518020, P.R. China.
Tel: 86-755-2562-6750, Fax: 86-755-2562-6750 E-mail: [email protected]
∙ The authors have no financial conflicts of interest.
© Copyright:
Yonsei University College of Medicine 2012 This is an Open Access article distributed under the terms of the Creative Commons Attribution Non- Commercial License (http://creativecommons.org/
licenses/by-nc/3.0) which permits unrestricted non- commercial use, distribution, and reproduction in any medium, provided the original work is properly cited.
Purpose: The purpose of the present study was to investigate the aberrance of his- tone H3 lysine 4 trimethylation (H3K4me3) in patients with IgA Nephropathy (IgAN). Materials and Methods: In this study, H3K4me3 variations in peripheral blood mononuclear cells (PBMCs) from 15 IgAN patients and 15 healthy subjects were analyzed using chromatin immunoprecipitation linked to microarrays analy- sis (ChIP-chip). ChIP real-time PCR was used to validate the microarray results.
Expression analysis by quantitative real-time PCR (qRT-PCR) revealed correla- tions between mRNA and H3K4me3 levels. DNA methylation status was ana- lyzed by quantitative methylation-specific PCR. Results: We found that 321 probes displayed significant H3K4me3 differences in IgAN patients compared with healthy controls. Among these probes, 154 probes displayed increased H3K- 4me3 and 167 probes demonstrated decreased H3K4me3. For further validation, we selected 4 key relevant genes (FCRL4, GALK2, PTPRN2 and IL1RAPL1) to study. The results of ChIP real-time PCR coincided well with the microarray data.
Quantitative RT-PCR revealed the correlations between the mRNA expression and the methylation levels of H3K4me3. Different degrees of DNA methylation altera- tions appeared on the selected positive genes. Conclusion: Our studies indicated that there were significant alterations in H3K4me3 in IgAN patients. These find- ings may help to explain the disturbed immunity and abnormal glycosylation in- volved in IgAN patients.
Key Words: Chromatin immunoprecipitation, histone H3 lysine 4, IgA nephropa- thy, quantitative methylation-specific PCR, trimethylation
INTRODUCTION
IgA Nephropathy (IgAN) is defined immunohistologically by predominant mesan-
gial deposition of IgA.
1The immunochemical nature of the IgA molecule and its
mesangial uptake command a pivotal role in the pathogenesis of IgAN.
2,3Many
in yeast. In humans, Weinmann, et al.
20first utilized chroma- tin immunoprecipitation and CpG microarrays to identify target genes for transcription factors. Recently, this approach has been employed successfully to elucidate the profiles of H3K9 and H3K27 methylation in human disease.
21-23Promoter methylation profiling is quickly becoming a powerful diagnostic tool for the early detection, prognosis, and even prediction of a clinical response to treatments of various diseases. Among the theories concerning the etiolo- gy of IgAN, little is known about the epigenetic alterations that occur.
Hence, in this study, we used ChIP-chip technology to pro- file the variations in H3K4me3 at a genome-wide level of PBMCs from IgAN patients and healthy controls. Our aim was to gain better understanding of the pathogenic mecha- nisms in IgAN. Meanwhile, we also researched the rele- vance between H3K4me3 and DNA methylation under this disease condition.
MATERIALS AND METHODS
Patients and controls
IgAN patients (n=15) and healthy volunteers (n=15) were recruited for this study. Patients were diagnosed and treated in the Kidney Transplantation and Hemopurification Center of the 181th Hospital of Guangzhou Military Area of PLA, from January 2006 to May 2009. Diagnostic criteria of IgAN were based on the manifestation of generalized glomerular mesangial proliferation, with the presence of IgA as the sole or predominant immunoglobulin deposited in the mesangial area of the glomeruli. All of the patients had undergone a re- nal biopsy for an exact histological diagnosis. Renal biopsy specimens were graded as Haas I-V according to the patho- logical scheme of IgAN proposed by Haas.
24Age-, race- and patients with IgAN have elevated levels of aberrantly gly-
cosylated IgA1 in circulating immune complexes.
4,5Aber- rant IgA1 O-glycosylation results from the abnormal func- tion or expression of several specific glycosyltransferases, which may be one of the key pathogenetic mechanisms of IgAN.
6It was also thought that the pathogenic potential of frequently colocalized IgG deposits depends on polarized T-helper cytokines that modulate Fcα receptors of infiltrat- ing macrophages, leading to either activation or inhibition that determines glomerular injury.
7How this kind of im- mune dysregulation and over-production of aberrantly gly- cosylated IgA1 develops remain obscure.
8Histone lysine methylation is an important epigenetic mechanism for gene silencing, which may confer tumor cells of growth advan- tage.
9Many cellular pathways are inactivated by this epi- genetic event, including DNA repair, cell cycle, apoptosis, cell adherence, and detoxification.
10Lysine can accept 3 methyl groups, and therefore can be monomethylated, di- methylated or trimethylated. Methylation of histone H3 on lysine 4 (H3K4) plays an important role in the association with active chromatin and gene expression.
11-14Trimethyl- ated H3K4 is preferentially detected at active genes and proposed to promote gene expression through recognition by transcription-activating effector molecules.
13Aberrant alterations in histone lysine methylation patterns implicate in multiple biological processes, such as changing the chro- matin structure, regulating gene transcription.
15,16Therefore, it is of significant interest to discuss the aberrance of H3K- 4me3 in peripheral blood mononuclear cells (PBMCs) of IgAN patients and explore its pathogenic mechanisms.
Chromatin immunoprecipitation linked to microarrays analysis (ChIP-chip), with high-throughput capability, is a useful technology to study histone modifications at a ge- nome-wide level.
17,18Ren, et al.
19first adopted this method to monitor binding of gene-specific transcription activators
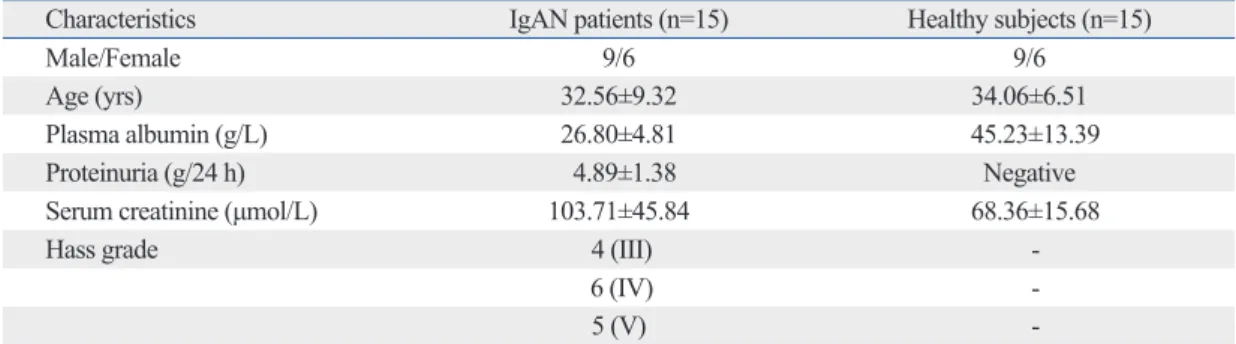
Table 1. Characteristics of Immunoglobulin A Nephropathy Patients and Healthy Controls
Characteristics IgAN patients (n=15) Healthy subjects (n=15)
Male/Female 9/6 9/6
Age (yrs) 32.56±9.32 34.06±6.51
Plasma albumin (g/L) 26.80±4.81 45.23±13.39
Proteinuria (g/24 h) 4.89±1.38 Negative
Serum creatinine (μmol/L) 103.71±45.84 68.36±15.68
Hass grade 4 (III) -
6 (IV) -
5 (V) -
IgAN, IgA Nephropathy.
Values are expressed as means±SD.
magnetic beads were sequentially washed in low salt, high salt, LiCl salt, and TE buffers. The protein/DNA complexes were eluted, and heated at 65°C for 5 hr to reverse formal- dehyde crosslink. Samples were mixed with RNase for 20 min at 37°C prior to treatment with proteinase K overnight.
DNA was extracted according to the phenol/chloroform method. PCR amplification of DNA was carried out on di- luted DNA aliquots as recommended by the whole genome amplification kit (Sigma, St. Louis, MO, USA) instructions, followed by DNA purification using the QIAquick PCR purification kit (Qiagen, Hilden, Germany). Cy5TM-dUTP and Cy3TM-dUTP (Invitrogen, Carlsbad, CA, USA) la- beled methylated K4 precipitated DNA and input DNA, re- spectively; and the products thereof were then cohybridized to the human 12K CpG-island array (UNH Microarray Centre, Toronto, Canada). The hybridized microarray slides were then scanned using a GenePix 4000B scanner (Axon Instruments, Foster City, CA, USA). GenePix pro version 6.0 was used to read the raw intensity of the image. The re- sulting text files were imported into the Agilent GeneSpring GX software for further analysis. The two microarray data sets were normalized in GeneSpring GX using the Agilent Two-color scenario (mainly LOWESS normalization), and then CpGs marked present (“All Targets Value”) were cho- sen for further analysis. The differences between the test and control samples were identified using 2-fold change.
The sequences of CpG islands on the array and alignment data are available at http://data.microarrays.ca/. The experi- ments were done in duplicate.
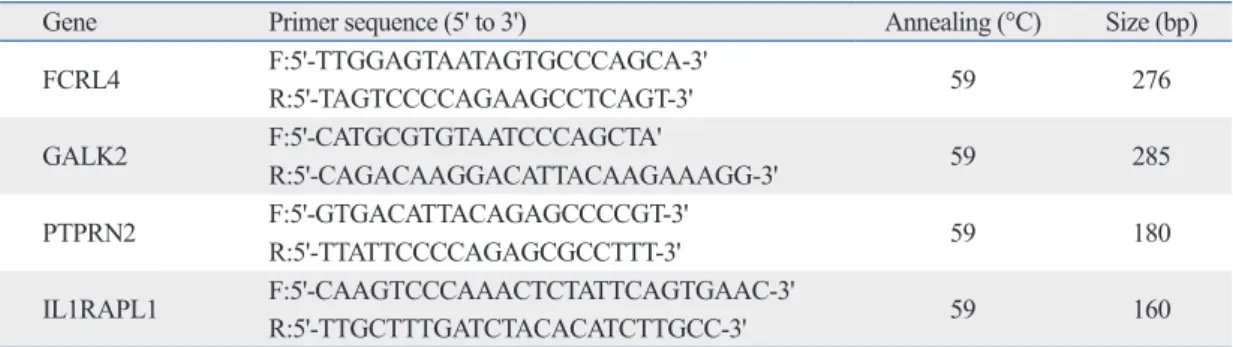
Chromatin immunoprecipitation-quantitative PCR ChIP was conducted in the same way as in ChIP-chip. The DNA pool from ChIP, input control and negative control, was used for quantitative PCR which was performed on an ABI 7700 Real-Time PCR (Applied Biosystems, Foster City, CA, USA). The PCR conditions were as follows: an initial step of 95°C for 5 min, followed by 95°C for 15 sec, 59°C for 20 sec, 72°C for 20 sec repeated for 40 cycles, and a final 10 min extension at 72°C. In order to evaluate ChIP on chip data, four genes were selected and their correspond- ing primers are displayed in Table 2. Threshold cycle (CT) values of serially diluted input DNA were determined to generate a standard curve for each amplification. The H3K- 4me3 changes were determined using the 2
-ΔΔCTmethod
28and each reaction was performed with melting curve analy- sis to ensure a single peak. The experiment was conducted in triplicate, and average value was calculated for each sample.
sex-matched healthy controls were recruited through adver- tising. Urinalysis results of the healthy controls were nega- tive and their serum creatinine was within the normal range.
The clinical features of the patients and healthy subjects are shown in Table 1. The Ethics Committee of the Chongqing Medical University approved the study, and peripheral blood samples were obtained with the informed consent of all par- ticipating individuals. The Helsinki Declaration was ad- hered to throughout the study.
Isolation of PBMCs
Approximately 10 mL heparinized venous blood samples from IgAN patients and healthy volunteers were collected.
Blood samples were treated according to the Ficoll-Paque Plus (Cedarlane Laboratoryies Ltd., Ontario, Canada) instruc- tions and reference.
25Each sample was diluted with equal volumes of phosphate-buffered saline. The diluted blood was overlaid on the equal volume of Ficoll-Paque Plus medium, followed by centrifuged at 800 g for 25 min at 22°C. After being washed twice with phosphate-buffered saline, the col- lected PBMC layer was stored at -80°C until assayed.
Chromatin immunoprecipitation microarray
The ChIP-chip analysis was performed according to de- scribed protocols
26,27with some modifications. Firstly, PBMCs were allowed to crosslink with 1% formaldehyde (final concentration) for 10 min at 37°C, adding glycine (0.125 M) for 5 min at 37°C to stop the crosslink. Secondly, the cell pellets were eluted twice with 10 mL of ice-cold 1×
PBS and then resuspended with 300 µL lysis buffer (10 mM Tris-HCl pH 8.0; NaCl 100 mM; EDTA 1 mM pH 8.0;
Na-Deoxycholate 0.1% and Protease inhibitors) and incu- bated on ice for 30 min. Finally, the cell suspension was sonicated for 4 min (30 seconds “ON” & 30 seconds “OFF”) DNA lengths were decreased to between 200 and 1000 bp.
Each ChIP sample was incubated with 555 μL of dilution
buffer containing a protease inhibitor cocktail, and the ly-
sate was then divided into three parts. The first lysate was
incubated with anti-K4 trimethylated histone H3 antibody
(Upstate Biotechnology, Lake Placid, NY, USA) at 4°C
overnight. The remaining two parts served as the input con-
trol and negative control, respectively. Fifty microlitres of
magnetic beads (Bangs Laboratories. Inc., Fishers, IN,
USA) were added and incubated for 1 h at 4°C to harvest
immunoprecipitated complexes. Pellet beads were ad-
sorbed to the bottom of the tube by a magnetic separation
rack for 2 min at 4°C, and then discard the supernatant. The
10 min for extension. Expression was assessed by evaluat- ing CT values. The relative quantity of expressed mRNA was determined by the 2
-ΔΔCTmethod.
28The experiment was performed in triplicate, and average value was calcu- lated for each sample.
DNA extraction and real-time quantitative methylation- specific PCR
Genomic DNA from 15 IgAN patients and 15 healthy con- trols were treated by overnight proteinase K incubation, phenol-chloroform extraction, recovered by ethanol precip- itation and RNase digestion. Sodium bisulfite conversion of unmethylated (but not methylated) cytosine residues to ura- cil was performed as previously described.
29Briefly, 4 µg of genomic DNA were denatured in NaOH (0.3 M) for 20 min at 50°C, and then diluted with 450 µL of a freshly pre- pared solution of hydroquinone (125 mM) and sodium bi- sulfite (2.5 M). After incubation for 3 hr at 70°C, modified DNA samples were desalted and purified through a column (Wizard DNA Clean-Up System, Promega, Madison, WI, USA), incubated with sodium hydroxide for 10 min at room temperature, precipitated with 100% ethanol, resuspended in 240 µL of water and stored at -80°C for real-time Quan- titative Methylation-Specific PCR.
The specific PCR was then used to distinguish between RNA extraction and real-time quantitative RT-PCR
Total RNA was extracted from PBMCs using the Trizol re- agent (Invitrogen, Carlsbad, CA, USA) in light of the man- ufacturer’s instructions. The concentration and quality of RNA was analyzed spectroscopically using UV absorbance at 260 and 280 nm (A260/A280 ratio), and visualized by agarose gel electrophoresis individually. For RT-PCR, 2 μg total RNA was reverse- transcribed into cDNA with M-MLV reverse transcriptase by using oligo-dT as a primer. Real- time PCR utilized SYBR green dye and Taq polymerase.
One-tenth of the resulting cDNA template was used for the subsequent DNA amplification on a 7700 real-time PCR system apparatus.
PCR conditions were 95°C for 15 min, followed by 95°C for 10 sec, 58°C for 30 sec, 72°C for 1 min repeated for 35 cycles, and finally a 7-min incubation at 72°C. Serial dilu- tions of the amplified product standard with a predefined known concentration were used to create a standard curve.
The PCR primers for each gene in this analysis are given in Table 3. GADPH gene mRNA was used as the internal con- trol. The primers for GAPDH were 5’-CCA TGG AGA AGG CTG GGG-3’ (sense), and 5’-CAA AGT TGT CAT GGA TGA CC-3’ (antisense) (250 bp). The thermal cycles were 94°C for 6 min, followed by 35 cycles of 94°C for 60 sec 58°C for 60 sec and 72°C for 60 sec, and finally 72°C for
Table 2. Chromatin Immunoprecipitation Real-Time Quantitative PCR Primers Used for Validation of the CpG Array Data
Gene Primer sequence (5' to 3') Annealing (°C) Size (bp)
FCRL4 F:5'-TTGGAGTAATAGTGCCCAGCA-3' 59 276
R:5'-TAGTCCCCAGAAGCCTCAGT-3'
GALK2 F:5'-CATGCGTGTAATCCCAGCTA' 59 285
R:5'-CAGACAAGGACATTACAAGAAAGG-3'
PTPRN2 F:5'-GTGACATTACAGAGCCCCGT-3' 59 180
R:5'-TTATTCCCCAGAGCGCCTTT-3'
IL1RAPL1 F:5'-CAAGTCCCAAACTCTATTCAGTGAAC-3'
59 160
R:5'-TTGCTTTGATCTACACATCTTGCC-3' F, forward primer; R, reverse primer.
Table 3. Primers Used in Real-Time Quantitative PCR for mRNA Expression
Gene Primer sequence (5' to 3') Annealing (°C) Size (bp)
FCRL4 F:5'-CTCTGACTTGCAATGGATTTCAG-3'R:5'-CCAAGTATATTTCACAGCAGTCAA-3' 58 293
GALK2 F:5'-GAAGCTAAAGGAGATGTTTAACTCCA-3' 58 286
R:5'-AAGTCCACATAAGAAATAGTTGTGC-3'
PTPRN2 F:5'-GCCAGAAGGTTCCGGCAAT-3' 58 170
R:5'-CAGGTAGGTTTTCGGGAGGT-3' IL1RAPL1 F:5'-GGACTCTGCTATAATTCCAAGATG-3'
58 230
R:5'-TCACAGGTATAATTTCCAATGTCATC-3' F, forward primer; R, reverse primer.
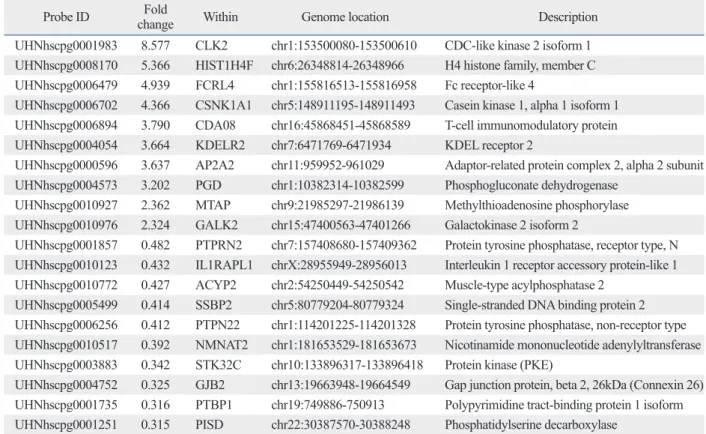
significant methylation alterations were excluded in the tar- get list if they were not identified as H3K4me3 targets. As a result, 321 probes displayed significant H3K4me3 differ- ences in IgAN patients compared with healthy subjects.
Among these probes, 154 probes displayed increased H3K- 4me3 and 167 probes showed decreased H3K4me3. The H3K4me3 alterations of the 20 selected genes are presented in Table 5. Among these were genes that are involved in many cellular pathways and critical biological functions in- cluding protein transcription and synthesis, transport, cell apoptosis, etc.
Validation for CpG microarray data
To validate the microarray results, two genes that displayed increased H3K4me3 (FCRL4 and GALK2) and two de- creased H3K4me3 (PTPRN2 and IL1RAPL1) were select- ed and verified by ChIP-qPCR. The data showed FCRL4 (1.56±0.02 versus 1.0; p<0.05) and GALK2 (2.53±0.03 ver- sus 1.0; p<0.05) were significantly higher in IgAN patients than those in healthy controls, while PTPRN2 (0.68±0.03 versus 1.0; p<0.05) and IL1RAPL1 (0.52±0.03 versus 1.0;
p<0.05) were significantly lower in IgAN patients than those in healthy controls (Fig. 1). All these results together sup- ported the accuracy of the array data.
H3K4me3 alterations and gene expression
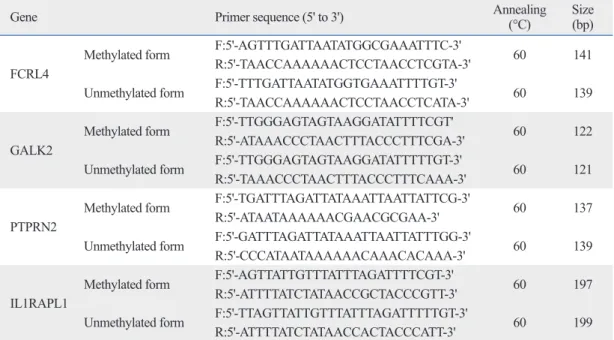
The mRNA expressions of the four selected H3K4me3 candidates were examined by real-time quantitative RT- methylated and unmethylated DNA sequences. The primer
sequences for the methylated form and unmethylated form are given in Table 4. The PCR conditions comprised one in- cubation of 10 min at 95°C, followed by 35 cycles of 94°C for 40 sec, 60°C for 30 sec, and 72°C for 30 sec, and a final extension at 72°C for 10 min. Relative enrichment of DNA methylation for each gene was determined by the same method described above. The experiment was performed in triplicate and obtained CT values to calculate methylation index (MI=methylated copy number/(methylated copy number+unmethylated copy number).
30Statistical analysis
Statistical analyses were performed using SPSS software, version 11.5 (SPSS Company, Chicago, IL, USA). Quantita- tive data were expressed as means±SD, and p values less than 0.05 were regarded as statistically significant for all statistic tests.
RESULTS
Identification of CpG island methylation profiles between IgAN patients and healthy subjects
Two steps were adopted to analyze this data to avoid false positive results. First, genes that showed significant differenc- es (the ratio >2 or <0.5) between IgAN and control groups were regarded as H3K4me3 candidates. Second, genes with
Table 4. Primers Used for Quantitative Methylation-Specific PCR
Gene Primer sequence (5' to 3') Annealing
(°C) Size (bp) FCRL4
Methylated form F:5'-AGTTTGATTAATATGGCGAAATTTC-3' 60 141 R:5'-TAACCAAAAAACTCCTAACCTCGTA-3'
Unmethylated form F:5'-TTTGATTAATATGGTGAAATTTTGT-3'
60 139
R:5'-TAACCAAAAAACTCCTAACCTCATA-3' GALK2
Methylated form F:5'-TTGGGAGTAGTAAGGATATTTTCGT'
60 122
R:5'-ATAAACCCTAACTTTACCCTTTCGA-3'
Unmethylated form F:5'-TTGGGAGTAGTAAGGATATTTTTGT-3' 60 121 R:5'-TAAACCCTAACTTTACCCTTTCAAA-3'
PTPRN2
Methylated form F:5'-TGATTTAGATTATAAATTAATTATTCG-3' 60 137 R:5'-ATAATAAAAAACGAACGCGAA-3'
Unmethylated form F:5'-GATTTAGATTATAAATTAATTATTTGG-3'
60 139
R:5'-CCCATAATAAAAAACAAACACAAA-3' IL1RAPL1
Methylated form F:5'-AGTTATTGTTTATTTAGATTTTCGT-3'
60 197
R:5'-ATTTTATCTATAACCGCTACCCGTT-3'
Unmethylated form F:5'-TTAGTTATTGTTTATTTAGATTTTTGT-3' 60 199 R:5'-ATTTTATCTATAACCACTACCCATT-3'
F, forward primer; R, reverse primer.
versus 1.0; p<0.05) displayed lower mRNA expression lev- els. According to our previous understanding, the high lev- els of H3K4me3 are associated with active genes,
11,31but the high expression of IL1RAPL1 was contrary to its low H3K4me3.
PCR. As shown in Fig. 2, FCRL4 (1.86±0.03 versus 1.0; p
<0.05), GALK2 (1.73±0.04 versus 1.0; p<0.05) and IL- 1RAPL1 (1.55±0.03 versus 1.0; p<0.05) mRNA expression levels in PBMCs were significantly higher than in corre- sponding normal subjects. In addition, PTPRN2 (0.74±0.03
Table 5. The 20 Selected Probes with H3K4me3 Alterations between Immunoglobulin A Nephropathy Patients and Healthy Subjects, Identified by Chromatin Immunoprecipitation-CpG Microarray Analysis
Probe ID Fold
change Within Genome location Description
UHNhscpg0001983 8.577 CLK2 chr1:153500080-153500610 CDC-like kinase 2 isoform 1 UHNhscpg0008170 5.366 HIST1H4F chr6:26348814-26348966 H4 histone family, member C UHNhscpg0006479 4.939 FCRL4 chr1:155816513-155816958 Fc receptor-like 4
UHNhscpg0006702 4.366 CSNK1A1 chr5:148911195-148911493 Casein kinase 1, alpha 1 isoform 1 UHNhscpg0006894 3.790 CDA08 chr16:45868451-45868589 T-cell immunomodulatory protein UHNhscpg0004054 3.664 KDELR2 chr7:6471769-6471934 KDEL receptor 2
UHNhscpg0000596 3.637 AP2A2 chr11:959952-961029 Adaptor-related protein complex 2, alpha 2 subunit UHNhscpg0004573 3.202 PGD chr1:10382314-10382599 Phosphogluconate dehydrogenase
UHNhscpg0010927 2.362 MTAP chr9:21985297-21986139 Methylthioadenosine phosphorylase UHNhscpg0010976 2.324 GALK2 chr15:47400563-47401266 Galactokinase 2 isoform 2
UHNhscpg0001857 0.482 PTPRN2 chr7:157408680-157409362 Protein tyrosine phosphatase, receptor type, N UHNhscpg0010123 0.432 IL1RAPL1 chrX:28955949-28956013 Interleukin 1 receptor accessory protein-like 1 UHNhscpg0010772 0.427 ACYP2 chr2:54250449-54250542 Muscle-type acylphosphatase 2
UHNhscpg0005499 0.414 SSBP2 chr5:80779204-80779324 Single-stranded DNA binding protein 2 UHNhscpg0006256 0.412 PTPN22 chr1:114201225-114201328 Protein tyrosine phosphatase, non-receptor type UHNhscpg0010517 0.392 NMNAT2 chr1:181653529-181653673 Nicotinamide mononucleotide adenylyltransferase UHNhscpg0003883 0.342 STK32C chr10:133896317-133896418 Protein kinase (PKE)
UHNhscpg0004752 0.325 GJB2 chr13:19663948-19664549 Gap junction protein, beta 2, 26kDa (Connexin 26) UHNhscpg0001735 0.316 PTBP1 chr19:749886-750913 Polypyrimidine tract-binding protein 1 isoform UHNhscpg0001251 0.315 PISD chr22:30387570-30388248 Phosphatidylserine decarboxylase
H3K4me3, H3 lysine 4 trimethylation.
Fig. 1. Quantitative real-time PCR verification of ChIP-chip result. Real-time PCR values are expressed as the mean±SD compared to the healthy group. Quantitative data was calculated by 2-ΔΔCT. Assays were done in trip- licate. *p<0.05 was considered statistically significant (independent sam- ples t-test). Microarray changes of histone H3 lysine 4 trimethylation are presented as upregulated (U) or downregulated (D) compared to the healthy group. ChIP-chip, chromatin immunoprecipitation linked to micro- arrays analysis; IgAN, IgA Nephropathy.
Fig. 2. H3 lysine 4 trimethylation (H3K4me3) variations and mRNA expres- sion levels with real-time quantitative RT-PCR analysis. Relative mRNA val- ues are expressed as the mean±SD compared to the healthy group.
Quantitative data was calculated by 2-ΔΔCT. Assays were done in triplicate.
*p<0.05 was considered statistically significant (independent samples t- test). Microarray changes of histone H3K4me3 are presented as upregulat- ed (U) or downregulated (D) compared to the healthy group. IgAN, IgA Nephropathy.
0 0.5 1 1.5 2 2.5 3
Real-time PCR value
FCRL 4 GALK2 PTPRN2 IL1RAPL1
Gene group
IgAN Controls U*
U*
D* D
*
0 0.5 1 1.5 2
Relative mRNA values
FCRL 4 GALK2 PTPRN2 IL1RAPL1
Gene group IgAN Controls
U* U
*
D*
D*
ily. PTPs are known to be signaling molecules that regulate a variety of cellular processes including cell growth, differ- entiation, mitotic cycle, and oncogenic transformation.
37Protein tyrosine kinase (PTK) can promote renal podocytes to produce vascular endothelial growth factor by a signal- ing pathway and increase urine protein.
38In our results, PT- PRN2 displayed decreased H3K4me3 and mRNA expres- sion. It has been elucidated that PTP can oppose PTK actions.
39Perhaps the depression of PTP could not inhibit the activity of PTK and exacerbate the progression of IgAN.
PTPRN2 has been a sensitive and specific DNA methyla- tion marker panel for squamous cell lung cancer.
40In our study, PTPRN2 gene also showed high DNA methylation.
The protein encoded by the IL1RAPL1 gene is a mem- ber of the interleukin 1 receptor family and is similar to the interleukin 1 accessory proteins. The IL-1 cytokine family is considered to play important roles in the progression of IgAN, and IL-1 is expressed in the glomeruli of IgAN pa- tients.
41Generally, cytokines fulfill their biological process- es by combination with their receptor. IL1RAPL1 showed low methylation of H3K4me3, enhanced DNA methylation and increased mRNA expression. We feel that the high ex- pression can encode for more interleukin 1 receptors and deteriorate the disease. The low levels of H3K4me3 and high level DNA methylation are generally associated with inactive genes; nevertheless, IL1RAPL1 displayed high mRNA expression. We assumed that there are other epigen- etic modifications to promote this gene expression.
DNA methylation and histone modification may act syn- H3K4me3 alterations and DNA methylation
We further assessed the association of H3K4me3 and DNA methylation. As shown in Fig. 3, the levels of DNA methyl- ation in PTPRN2 (0.75±0.04 versus 0.26±0.01; p<0.05) and IL1RAPL1 (0.59±0.04 versus 0.34±0.01; p<0.05) were higher than in normal subjects. FCRL4 (0.46±0.02 versus 0.71±0.09; p<0.05) was lower than in normal subjects. How- ever, GALK2 (0.38±0.03 versus 0.44±0.104; p>0.05) showed no distinct difference in DNA methylation between IgAN and normal subjects.
DISCUSSION
More than one-half of human genes have cytosineguanine (CpG) islands which are important regulatory elements of transcription.
32In this study, we used human 12K CpG is- land arrays to identify H3K4me3 variations. The human 12K CpG island contains a significant percentage of the CpG islands found in the human genome and approximate- ly 68% were located near a transcription start site.
33Among the genes identified in the CpG array, FCRL4 and GALK2 displaying increased H3K4me3 were selected for further study. The FCRL4 gene encodes a member of the immuno- globulin receptor superfamily and is one of several Fc re- ceptor-like glycoproteins clustered on the long arm of chro- mosome 1. Data indirectly suggest that FcalphaRI (Fc alpha receptor I) activation mediates IgAN development by initi- ating a cytokine/chemokine cascade.
34The encoded protein by FCRL4 may have a similar function as the FcalphaRI in the pathogenetic progress. As for the Fc receptor-like gly- coproteins, we conjecture that they take part in the underga- lactosylation of IgA in some way.
The abnormalities of galactosylation and sialylation in IgA1 play an important role in the development of IgA ne- phropathy. Mesangial deposits of IgA contains high con- centrations of abnormally glycosylated IgA1, characterized by undergalactosylation.
35The GALK2 gene plays a key role in normal galactose metabolism by catalyzing the con- version of α-d-galactose to galactose 1-phosphate.
36Our re- sults showed its high expression of mRNA, and we may hypothesize that the increase in GALK2 induces the low concentration of galactose and results in the undergalacto- sylation of IgA.
Two other genes, PTPRN2 and IL1RAPL1, demonstrat- ed decreased H3K4me3. The protein encoded by PTPRN2 is a member of the protein tyrosine phosphatase (PTP) fam-
Fig. 3. The relationship between H3 lysine 4 trimethylation (H3K4me3) alter- ations and DNA methylation levels. DNA methylation index values are ex- pressed as the mean±SD compared to the healthy group. Assays were done in triplicate. *p<0.05 was considered statistically significant (indepen- dent samples t-test). Microarray changes of histone H3K4me3 are present- ed as upregulated (U) or downregulated (D) compared to the healthy group. IgAN, IgA Nephropathy.
0 0.25 0.5 0.75 1
Methylation index
FCRL 4 GALK2 PTPRN2 IL1RAPL1
Gene group
IgAN Controls
U* U
D*
D*
higher eukaryotic genes. Nat Cell Biol 2004;6:73-7.
13. Bannister AJ, Kouzarides T. Histone methylation: recognizing the methyl mark. Methods Enzymol 2004;376:269-88.
14. Bernstein BE, Kamal M, Lindblad-Toh K, Bekiranov S, Bailey DK, Huebert DJ, et al. Genomic maps and comparative analysis of histone modifications in human and mouse. Cell 2005;120:169-81.
15. Martin C, Zhang Y. The diverse functions of histone lysine meth- ylation. Nat Rev Mol Cell Biol 2005;6:838-49.
16. Fraga MF, Ballestar E, Villar-Garea A, Boix-Chornet M, Espada J, Schotta G, et al. Loss of acetylation at Lys16 and trimethylation at Lys20 of histone H4 is a common hallmark of human cancer. Nat Genet 2005;37:391-400.
17. Wu J, Smith LT, Plass C, Huang TH. ChIP-chip comes of age for genome-wide functional analysis. Cancer Res 2006;66:6899-902.
18. Opel M, Lando D, Bonilla C, Trewick SC, Boukaba A, Walfrids- son J, et al. Genome-wide studies of histone demethylation cata- lysed by the fission yeast homologues of mammalian LSD1. PLoS One 2007;2:e386.
19. Ren B, Robert F, Wyrick JJ, Aparicio O, Jennings EG, Simon I, et al. Genome-wide location and function of DNA binding proteins.
Science 2000;290:2306-9.
20. Weinmann AS, Yan PS, Oberley MJ, Huang TH, Farnham PJ. Iso- lating human transcription factor targets by coupling chromatin immunoprecipitation and CpG island microarray analysis. Genes Dev 2002;16:235-44.
21. Miao F, Wu X, Zhang L, Yuan YC, Riggs AD, Natarajan R. Ge- nome-wide analysis of histone lysine methylation variations caused by diabetic conditions in human monocytes. J Biol Chem 2007;282:13854-63.
22. Zhang L, Zhong K, Dai Y, Zhou H. Genome-wide analysis of his- tone H3 lysine 27 trimethylation by ChIP-chip in gastric cancer patients. J Gastroenterol 2009;44:305-12.
23. Kondo Y, Shen L, Cheng AS, Ahmed S, Boumber Y, Charo C, et al. Gene silencing in cancer by histone H3 lysine 27 trimethylation independent of promoter DNA methylation. Nat Genet 2008;40:
741-50.
24. Haas M. Histologic subclassification of IgA nephropathy: a clinico- pathologic study of 244 cases. Am J Kidney Dis 1997;29:829-42.
25. Lan K, Verma SC, Murakami M, Bajaj B, Robertson ES. Isolation of human peripheral blood mononuclear cells (PBMCs). Curr Protoc Microbiol 2007;Appendix 4:Appendix 4C.
26. Wu H, Ji H. JAMIE: joint analysis of multiple ChIP-chip experi- ments. Bioinformatics 2010;26:1864-70.
27. Kim S, Hu J, Oh Y, Park J, Choi J, Lee YH, et al. Combining ChIP-chip and expression profiling to model the MoCRZ1 medi- ated circuit for Ca/calcineurin signaling in the rice blast fungus.
PLoS Pathog 2010;6:e1000909.
28. Livak KJ, Schmittgen TD. Analysis of relative gene expression data using real-time quantitative PCR and the 2(-Delta Delta C(T)) Method. Methods 2001;25:402-8.
29. Luszczek W, Cheriyath V, Mekhail TM, Borden EC. Combina- tions of DNA methyltransferase and histone deacetylase inhibitors induce DNA damage in small cell lung cancer cells: correlation of resistance with IFN-stimulated gene expression. Mol Cancer Ther 2010;9:2309-21.
30. Durr ML, Mydlarz WK, Shao C, Zahurak ML, Chuang AY, Hoque MO, et al. Quantitative methylation profiles for multiple tumor suppressor gene promoters in salivary gland tumors. PLoS One 2010;5:e10828.
31. Liu Q, Gong Z. The coupling of epigenome replication with DNA
ergistically or antagonistically on gene expression.
42,43High levels of DNA methylation detected in IL1RAPL1 and PT- PRN2 suggested an inverse relationship between low H3K- 4me3 and high DNA methylation in IgAN patients. How- ever, GALK2 did not show significant DNA methylation.
We will have to carry out further research to study the cor- relation between alterant H3K4me3 and local changes in DNA methylation in IgAN.
In summary, we systematically and initially profiled H3K- 4me3 in PBMCs of IgAN patients. The present study sug- gests that H3K4me3 alterations of promoters might contrib- ute to the pathogenesis of IgAN.
ACKNOWLEDGEMENTS
We are deeply grateful to all the volunteers who donated blood.
This study was financially supported by Natural Science Fund of Guangxi, People’s Republic of China (Grant No:
2010GXNSFA013273).
REFERENCES
1. Eijgenraam JW, van Kooten C. IgA1 glycosylation in IgA ne- phropathy: as sweet as it can be. Kidney Int 2008;73:1106-8.
2. Lai KN. Pathogenic IgA in IgA nephropathy: still the blind men and the elephant? Kidney Int 2006;69:1102-3.
3. Julian BA, Novak J. IgA nephropathy: an update. Curr Opin Nephrol Hypertens 2004;13:171-9.
4. Novak J, Julian BA, Tomana M, Mestecky J. IgA glycosylation and IgA immune complexes in the pathogenesis of IgA nephropa- thy. Semin Nephrol 2008;28:78-87.
5. Zhu L, Tang W, Li G, Lv J, Ding J, Yu L, et al. Interaction be- tween variants of two glycosyltransferase genes in IgA nephropa- thy. Kidney Int 2009;76:190-8.
6. Narita I, Gejyo F. Pathogenetic significance of aberrant glycosylation of IgA1 in IgA nephropathy. Clin Exp Nephrol 2008;12:332-8.
7. Rifai A. IgA nephropathy: immune mechanisms beyond IgA me- sangial deposition. Kidney Int 2007;72:239-41.
8. Barratt J, Smith AC, Molyneux K, Feehally J. Immunopathogene- sis of IgAN. Semin Immunopathol 2007;29:427-43.
9. Baylin SB, Herman JG. DNA hypermethylation in tumorigenesis:
epigenetics joins genetics. Trends Genet 2000;16:168-74.
10. Esteller M. CpG island hypermethylation and tumor suppressor genes: a booming present, a brighter future. Oncogene 2002;21:
5427-40.
11. Santos-Rosa H, Schneider R, Bannister AJ, Sherriff J, Bernstein BE, Emre NC, et al. Active genes are tri-methylated at K4 of his- tone H3. Nature 2002;419:407-11.
12. Schneider R, Bannister AJ, Myers FA, Thorne AW, Crane-Robin- son C, Kouzarides T. Histone H3 lysine 4 methylation patterns in
lo family. J Biol Chem 1996;271:16712-9.
38. Bukowski RM. Tyrosine kinase inhibitors in advanced renal cell carcinoma: the evolving treatment paradigm. Clin Genitourin Cancer 2009;7:9-10.
39. Navis AC, van den Eijnden M, Schepens JT, Hooft van Huijsdui- jnen R, Wesseling P, Hendriks WJ. Protein tyrosine phosphatases in glioma biology. Acta Neuropathol 2010;119:157-75.
40. Guz J, Foksiński M, Oliński R. [Global DNA hipomethylation-- the meaning in carcinogenesis]. Postepy Biochem 2010;56:16-21.
41. Hahn WH, Cho BS, Kim SD, Kim SK, Kang S. Interleukin-1 cluster gene polymorphisms in childhood IgA nephropathy. Pedi- atr Nephrol 2009;24:1329-36.
42. Maunakea AK, Nagarajan RP, Bilenky M, Ballinger TJ, D’Souza C, Fouse SD, et al. Conserved role of intragenic DNA methylation in regulating alternative promoters. Nature 2010;466:253-7.
43. Kim DS, Kim MJ, Lee JY, Kim YZ, Kim EJ, Park JY. Aberrant methylation of E-cadherin and H-cadherin genes in nonsmall cell lung cancer and its relation to clinicopathologic features. Cancer 2007;110:2785-92.
replication. Curr Opin Plant Biol 2011;14:187-94.
32. Roh TY, Cuddapah S, Cui K, Zhao K. The genomic landscape of histone modifications in human T cells. Proc Natl Acad Sci U S A 2006;103:15782-7.
33. Heisler LE, Torti D, Boutros PC, Watson J, Chan C, Winegarden N, et al. CpG Island microarray probe sequences derived from a physical library are representative of CpG Islands annotated on the human genome. Nucleic Acids Res 2005;33:2952-61.
34. Kanamaru Y, Arcos-Fajardo M, Moura IC, Tsuge T, Cohen H, Es- sig M, et al. Fc alpha receptor I activation induces leukocyte re- cruitment and promotes aggravation of glomerulonephritis through the FcR gamma adaptor. Eur J Immunol 2007;37:1116-28.
35. Ding JX, Xu LX, Zhu L, Lv JC, Zhao MH, Zhang H, et al. Activi- ty of alpha2,6-sialyltransferase and its gene expression in periph- eral B lymphocytes in patients with IgA nephropathy. Scand J Im- munol 2009;69:174-80.
36. Thoden JB, Holden HM. The molecular architecture of human N- acetylgalactosamine kinase. J Biol Chem 2005;280:32784-91.
37. Fuchs M, Müller T, Lerch MM, Ullrich A. Association of human protein-tyrosine phosphatase kappa with members of the armadil-