http://e-nrp.org
Effect of a 12-week weight management program on the clinical characteristics and dietary intake of the young obese and the contributing factors to the successful weight loss
AeJin Lee
1, Kyeong Jin Jeon
1, Hye-Kyeong Kim
2and Sung Nim Han
1,31Department of Food and Nutrition, College of Human Ecology, Seoul National University, Seoul 151-742, Korea
2Department of Food Science and Nutrition, The Catholic University of Korea, Gyeonggi, 420-717, Korea
3Research Institute of Human Ecology, College of Human Ecology, Seoul National University, 1 Gwanak-ro, Gwanak-gu, Seoul 151-742, Korea
BACKGROUND/OBJECTIVES: The objectives were to investigate the effect of a 12-wk intervention with behavioral modification on clinical characteristics and dietary intakes of young and otherwise healthy obese and to identify factors for successful weight loss. The goal was to lose 0.5 kg per week by reducing 300-500 kcal/day and by increasing physical activities.
SUBJECTS AND METHODS: Forty four obese subjects (BMI > 25) and 19 normal weight subjects (BMI 18.5-23) finished the 12-week intervention. Obese subjects participated in 5 group educations and 6 individual counseling sessions. Normal weight subjects attended 6 individual counseling sessions for evaluations of dietary intake and exercise pattern. Anthropometric and clinical characteristics and 3-day dietary records were evaluated at baseline and week12.
RESULTS: Weight and serum triglyceride and free fatty acid concentrations in obese group decreased significantly with intervention.
Intakes of energy, fat, and cholesterol decreased significantly in the obese. Active participation, realistic weight loss goal setting, and weight gain after high school graduation not during childhood were identified as key factors for successful weight loss.
CONCLUSIONS: The 12-week intervention with behavioral modification resulted in reduced energy and fat intakes and led to significant weight loss and improvements of clinical characteristics in the obese. The finding that those who became obese during childhood lost less weight indicates the importance of ‘early’ intervention.
Nutrition Research and Practice 2014;8(5):571-579; doi:10.4162/nrp.2014.8.5.571; pISSN 1976-1457 eISSN 2005-6168
Keywords: Obesity, weight loss, clinical parameters, dietary intake, behavioral modification
INTRODUCTION
14)Obesity has become a pandemic and leads to many health problems, such as metabolic syndrome; Korean young adults also face the challenges of obesity. According to the Korean National Health and Nutrition Examination Survey conducted in 2010 [1], the prevalence of obesity was 20.5% in those aged between 19 and 29 years and 31.0% among those in their 30s.
Nelson et al. [2] noted that young adults, particularly those aged between 18 and 25, were vulnerable to obesity due to dramatic lifestyle changes, such as living alone, reduced physical activity, and declines in overall diet quality. Obesity at a young age may lead to serious health problems with advancing age.
Young people with a higher body mass index (BMI) have a significantly higher risk for coronary heart disease than their slender counterparts, and the risk for coronary heart disease increases by 3.3% for women and by 3.6% for men for every 1% increase in BMI above the desirable level [3]. In light of these statistics, weight control could be more vital in the earlier
stages of life for the prevention and management of metabolic syndrome [4].
Among the various weight management strategies, behavioral modification has been highlighted as a healthy and effective weight loss method because it can lead to overall changes in lifestyle. Milsom et al. [5] reported that 110 obese women aged 50 to 75 lost an average of 10.2% of initial weight through a 6-month lifestyle intervention using a 500-1,000 kcal deficit diet and individual counseling. After a 1-year lifestyle modifi- cation with a diet of 1,200-1,500 kcal per day and group educa- tion, a total of 55 middle-aged obese subjects had an average weight loss of 6.7 kg [6]. A 24-month intervention that provided group education and individual counseling sessions led to an average weight reduction of 5.1 kg in 138 middle-aged obese patients with at least one cardiovascular disease risk factor [7].
However, studies that have investigated the overall impact of behavioral modification on clinical characteristics and dietary intake among young obese subjects are relatively limited. It has been reported that subjects under 40 years of age and those
This research was supported by Basic Science Research Program through the National Research Foundation of Korea (NRF) funded by the Ministry of Science, ICT & Future Planning (grant number NRF-2009-0068320).
§Corresponding Author: Sung Nim Han, Tel. 82-2-880-6836, Fax. 82-2-884-0305, Email. [email protected] Received: January 23, 2014, Revised: April 7, 2014, Accepted: April 7, 2014
This is an Open Access article distributed under the terms of the Creative Commons Attribution Non-Commercial License (http://creativecommons.org/licenses/by-nc/3.0/) which permits unrestricted non-commercial use, distribution, and reproduction in any medium, provided the original work is properly cited.
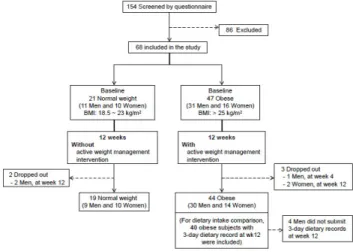
Fig. 1. Study design and subjects
without obesity-related complications were more likely to drop out from weight loss interventions [8-11]. These results indicate that young obese subjects might be less motivated. Weight-loss interventions often result in a wide range of weight-loss achievements even within the same study group [10]. Therefore, understanding key factors that contribute to better compliance and successful weight loss would help develop strategies for more effective weight-loss interventions.
In this study, we investigated the effect of a 12-week weight management program with behavioral modification on the clinical characteristics and dietary intakes of young and otherwise healthy obese adults. The program included dietary and physical activity aspects, intensive group education, and individual counseling sessions for effective behavioral modification. We tried to identify the traits of those who lost more weight to identify the key factors leading to a successful weight loss.
SUBJECTS AND METHODS Subjects
The study was conducted from September 2009 to June 2011.
One hundred fifty-four subjects aged 19 to 45 years were screened using questionnaires, and 86 subjects were excluded from the study (Fig. 1). Subjects who were taking dietary supple- ments or medications known to affect serum lipid profiles were excluded from the study. Subjects with a high Beck Depression Inventory (BDI) score or any chronic disease, including endocrine, hepatic, renal, thyroid, or cardiac dysfunction, were also excluded from the study. Subjects who did not submit a 3-day dietary record at baseline were excluded from the study as well.
Forty-seven subjects with a BMI over 25 kg/m
2were recruited into the obese group, and 21 subjects with a BMI between 18.5 and 23 kg/m
2were recruited into the normal weight group.
Of these, 63 subjects (44 obese and 19 normal weights) completed the study, and 59 subjects (40 obese and 19 normal weights) with complete dietary record data were included in the dietary intake analysis.
The protocol was approved by the Seoul National University Institutional Review Board (SNUIRB, IRB No. 0908/001-007), and written informed consent was obtained from all subjects.
The 12-week weight management program
At baseline, all subjects received information about the aims and schedule of the study. The 12-week weight management program included 5 group education sessions and 6 individual counseling sessions (baseline and week 2, 4, 6, 10, and 12) to induce dietary and behavioral modification in the obese subjects.
Subjects in the normal weight group attended 6 individual counseling sessions to evaluate their dietary intake and exercise patterns and were asked to keep their usual eating and exercise pattern to maintain body weight.
The topics of the group education sessions for the obese subjects were as follows: 1) planning for weight loss and how to write dietary records (baseline); 2) how to lose weight in a healthy way (week 2); 3) understanding the food exchange system and food labeling (week 4); 4) portion size control (week 6); and 5) strategies to maintain weight loss (week 12). During the individual counseling sessions, a registered dietitian evaluated 3-day dietary records and reinforced the incorporation of low-fat, low-sugar, low-salt, high-fiber, and low-energy diets.
The obese subjects were also encouraged to exercise regularly and to modify undesirable eating behaviors, such as late-night snacking or binge eating.
The overall weight reduction goal was to lose about 0.5 kg per week by reducing calorie intake by 300-500 kcal per day from the estimated energy requirements and increasing physical activity. Mean recommended energy intakes for weight loss were 1,715 kcal/d for obese men and 1,390 kcal/d for obese women. A personalized goal was set for each obese subject following an individual interview with a registered dietitian at baseline. The food exchange system from the Korean Diabetic Association was used for meal planning. Recommended servings of each food group based on caloric goals and the amount of carbohydrate, protein, and fat were provided to each subject. On average, energy from carbohydrate, protein, and fat were 60%, 21% and 19%, respectively, in the individual plans.
This recommendation was within the acceptable macronutrient distribution ranges (AMDR) for Koreans, in which carbohydrate comprises 55-70%, fat comprises 15-25%, and protein comprises 7-20% of the total calorie intake.
Anthropometric and blood pressure measurement
Body weight, waist and hip circumferences, and fat mass were measured using InBody 520 (Biospace, Korea). Standing height without shoes was measured using a stadiometer. BMI and waist-to-hip ratio (WHR) were calculated from the height and body weight and waist and hip circumferences, respectively.
Blood pressure was measured using an automatic blood pressure monitor (Jawon Medical, Korea) after subjects rested for more than 10 minutes.
Biochemical analysis
Blood was collected in serum separator tubes (BD vacutainer®
SST, Becton Dickinson, Flanklin Lakes, NJ) after a 12-hour fast.
The serum was separated by centrifugation and stored at -70°C
until analysis. Blood glucose, total cholesterol, HDL cholesterol,
and triglyceride concentrations were measured using Cobas
Integra® 400 plus (Roche, Switzerland). LDL cholesterol was
measured by elimination and an enzymatic assay (Green Cross
Characteristics Normal weight (BMI 18.5-23 kg/m2)
P value Obese (BMI > 25 kg/m2)
P value
Before After Before After
Subjects 19 44
Men [n (%)] 9 (47.4) 30 (68.2)
Women [n (%)] 10 (52.6) 14 (31.8)
Weight (kg) 60.1 ± 1.8 60.1 ± 1.9 NS 81.5 ± 1.4* 78.9 ± 1.3 < 0.001
Men 66.6 ± 2.1 66.4 ± 2.2 NS 84.7 ± 1.2* 81.7 ± 1.3 < 0.001
Women 54.3 ± 1.3 54.2 ± 1.4 NS 74.8 ± 2.8* 72.6 ± 2.7 0.014
BMI (kg/m2) 21.5 ± 0.3 21.5 ± 0.3 NS 28.1 ± 0.4* 27.1 ± 0.4 < 0.001
Men 22.1 ± 0.5 22.0 ± 0.4 NS 28.0 ± 0.4* 27.0 ± 0.4 < 0.001
Women 21.0 ± 0.3 21.0 ± 0.3 NS 28.2 ± 1.0* 27.4 ± 0.9 0.009
Waist circumference (cm) 75.1 ± 1.5 75.0 ± 1.6 NS 92.4 ± 1.1* 89.8 ± 1.1 < 0.001
Men 77.1 ± 1.7 76.9 ± 1.8 NS 92.7 ± 0.9* 90.0 ± 0.9 < 0.001
Women 73.3 ± 2.4 73.2 ± 2.6 NS 91.7 ± 2.9* 89.2 ± 2.9 0.035
Hip circumference (cm) 92.0 ± 2.3 91.6 ± 2.4 NS 103.1 ± 1.0* 101.2 ± 0.9 < 0.001
Men 91.1 ± 1.6 90.9 ± 1.7 NS 102.2 ± 0.7* 100.5 ± 0.7 < 0.001
Women 92.7 ± 4.3 92.2 ± 4.3 NS 105.2 ± 2.7* 102.8 ± 2.5 0.012
WHR (Waist-to-hip ratio) 0.819 ± 0.010 0.820 ± 0.009 NS 0.895 ± 0.006* 0.886 ± 0.006 < 0.001
Men 0.846 ± 0.008 0.846 ± 0.007 NS 0.907 ± 0.005* 0.896 ± 0.005 < 0.001
Women 0.794 ± 0.012 0.797 ± 0.012 NS 0.871 ± 0.012* 0.867 ± 0.013 NS
Fat mass (kg) 14.1 ± 0.8 14.0 ± 0.8 NS 25.4 ± 1.0* 23.0 ± 1.0 < 0.001
Men 12.9 ± 1.3 12.9 ± 1.3 NS 24.0 ± 0.9* 21.3 ± 0.9 < 0.001
Women 15.3 ± 0.7 15.0 ± 0.8 NS 28.4 ± 2.3* 26.6 ± 2.2 0.011
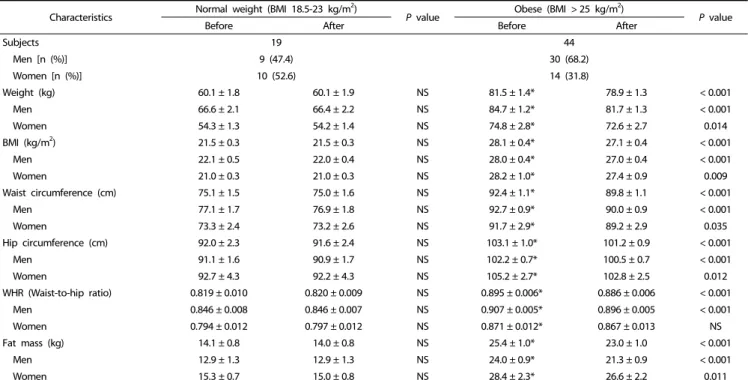
Values are the mean ± standard error. Variables were examined for normality, and values not normally distributed were analyzed using non-parametric tests. Significance was tested using a paired t-test or Wilcoxon’s signed-rank test based on normality; significance of weight, BMI, hip circumference, and fat mass were determined using Wilcoxon’s signed-rank test.
* Significant difference between the two weight groups at baseline (P< 0.05). NS: not significant (P> 0.05).
Table 1. Comparison of anthropometric characteristics before and after 12-week program participation.
Reference Lab, Korea). Nonesterified fatty acids (free fatty acids, FFA) in serum were measured using SICDIA NEFAZYME (Shinyang Chemical Co., Ltd., Korea). Serum leptin and high-molecular- weight-adiponectin (HMW-adiponectin) concentrations were determined using ELISA kits (Millipore, Billerica, MA) according to the manufacturer’s instructions. The HMW-adiponectin was measured after the pretreatment of serum samples with digestion solution to remove hexameric and trimeric adiponectins.
Dietary Intake Assessment
All subjects were asked to provide 3-day dietary records (2 weekdays and 1 weekend day) at baseline, 2-, 4-, 6-, 10-, and 12-week time points. The intake and amount of food consumed was confirmed with individual interviews using pictures of the food in actual size. Analysis of nutrient intake was conducted using CAN-Pro 3.0, a nutritional analysis program developed by the Korean Nutrition Society. To evaluate changes in dietary intake, 3-day dietary records at baseline and week 12 were used.
An average of the 3-day dietary intake was used as the daily intake of each subject.
Analysis of information from individual counseling
Information regarding exercise patterns, weight change history, family history of obesity and chronic diseases, goal weight, and weight control experiences of the subjects were collected through individual counseling. According to the weight change history, subjects who became obese after high school graduation were classified as having adult obesity.
Statistical analysis
Data were analyzed using SPSS software (version 19.0; SPSS Inc., Chicago, IL). Variables were examined for normality, and values that were not normally distributed were analyzed using non-parametric tests. Baseline characteristics, except dietary intake, were compared between the normal weight and obese groups using Student's t-test; baseline dietary intakes were tested using a 2-way ANOVA to evaluate the effects of sex and weight group.
To determine the effects of the 12-week program on anthropometric and clinical characteristics among obese subjects, subjects were divided into three subgroups based on the magnitude of weight loss: weight loss < 3 kg (< 50% of goal achievement), weight loss 3-6 kg (50-100%), and weight loss
> 6 kg (> 100%).
To test for changes in anthropometric and clinical chara- cteristics and dietary intakes before and after the program, the paired t-test or Wilcoxon’s signed-rank test was used. To identify key factors for successful weight loss, the chi-square test was used for categorical variables and the Student's t-test was used for continuous variables of obese subgroups. Data are reported as the mean ± standard error. Significance was set at P < 0.05.
RESULTS
Changes in anthropometric characteristics after 12-week program participation
The mean age of the normal weight group was 26.4 years,
and that of the obese group was 30.5 years. Although we tried
Characteristics Normal weight (BMI 18.5-23 kg/m2)
P value Obese (BMI > 25 kg/m2)
P value
Before After Before After
Subjects 19 44
Men [n (%)] 9 (47.4) 30 (68.2)
Women [n (%)] 10 (52.6) 14 (31.8)
Systolic blood pressure (mm Hg) 117.8 ± 2.8 118.4 ± 1.7 NS 130.3 ± 2.0* 127.7 ± 2.0 NS
Men 125.1 ± 3.5 123.4 ± 3.4 NS 132.2 ± 2.2 130.3 ± 2.3 NS
Women 112.0 ± 2.4 115.5 ± 2.5 NS 126.1 ± 3.8* 122.4 ± 3.6 NS
Diastolic blood pressure (mm Hg) 70.2 ± 2.5 68.3 ± 1.7 NS 78.1 ± 1.6* 75.5 ± 1.5 0.066
Men 73.0 ± 2.8 69.0 ± 2.0 NS 77.9 ± 1.6 75.6 ± 1.7 NS
Women 68.0 ± 3.3 68.5 ± 2.5 NS 78.6 ± 3.8# 75.5 ± 3.3 NS
Total cholesterol (mg/dL) 168.2 ± 7.6 166.1 ± 5.6 NS 197.9 ± 4.8* 192.0 ± 5.1 NS
Men 160.3 ± 11.0 165.4 ± 9.2 NS 198.7 ± 6.7* 193.0 ± 6.8 NS
Women 175.4 ± 10.6 166.7 ± 7.2 NS 196.3 ± 5.1# 189.7 ± 7.0 NS
LDL cholesterol (mg/dL) 93.1 ± 8.0 92.7 ± 5.9 NS 124.2 ± 4.2* 123.6 ± 4.7 NS
Men 85.9 ± 11.6 90.0 ± 8.7 NS 124.7 ± 5.7* 124.1 ± 6.3 NS
Women 99.5 ± 11.3 95.1 ± 8.4 NS 123.1 ± 5.7# 122.6 ± 6.2 NS
HDL cholesterol (mg/dL) 62.7 ± 2.4 63.9 ± 3.1 NS 50.5 ± 1.9* 53.4 ± 1.6 0.061
Men 61.9 ± 3.6 64.1 ± 5.5 NS 48.2 ± 2.0* 54.1 ± 1.7 0.001
Women 63.3 ± 3.5 63.6 ± 3.7 NS 55.4 ± 3.9 51.9 ± 3.6 NS
Triglyceride (mg/dL) 82.7 ± 5.6 86.9 ± 6.9 NS 139.9 ± 15.3* 108.4 ± 6.5 0.012
Men 85.3 ± 6.4 95.4 ± 10.6 NS 155.0 ± 21.8# 107.7 ± 8.7 0.008
Women 80.4 ± 9.2 78.0 ± 8.5 NS 107.6 ± 7.1* 109.9 ± 9.3 NS
Glucose (mg/dL) 92.1 ± 1.9 86.7 ± 1.4 0.004 95.9 ± 1.6 93.5 ± 1.5 NS
Men 94.3 ± 2.7 89.3 ± 1.9 NS 97.0 ± 2.0 93.2 ± 1.6 0.090
Women 90.0 ± 2.8 84.4 ± 1.9 0.030 93.6 ± 2.8* 94.3 ± 3.5 NS
Total:HDL cholesterol 2.77 ± 0.17 2.67 ± 0.13 NS 4.14 ± 0.18* 3.71 ± 0.13 0.024
Men 2.66 ± 0.25 2.68 ± 0.21 NS 4.33 ± 0.24 3.66 ± 0.16 0.003
Women 2.87 ± 0.25 2.70 ± 0.19 NS 3.74 ± 0.24* 3.82 ± 0.22 NS
LDL:HDL cholesterol 1.57 ± 0.16 1.53 ± 0.13 NS 2.62 ± 0.13* 2.40 ± 0.11 < 0.001
Men 1.46 ± 0.24 1.48 ± 0.18 NS 2.73 ± 0.17 2.37 ± 0.14 0.017
Women 1.66 ± 0.23 1.57 ± 0.17 NS 2.39 ± 0.20* 2.48 ± 0.18 NS
Serum free fatty acid (mEq/L) 198.2 ± 25.4 169.5 ± 20.5 NS 227.8 ± 15.7 187.6 ± 18.3 0.028
Men 167.3 ± 15.9 179.4 ± 28.9 NS 205.5 ± 18.6 197.3 ± 25.2 NS
Women 226.0 ± 45.5 160.6 ± 30.1 NS 273.9 ± 25.6 167.4 ± 21.0 0.005
Serum leptin (ng/mL) 4.08 ± 0.74 4.85 ± 0.85 0.022 7.74 ± 1.11* 6.61 ± 0.90 NS
Men 1.66 ± 0.42 2.19 ± 0.34 NS 4.94 ± 0.57* 3.60 ± 0.59 0.022
Women 6.26 ± 0.91 7.24 ± 1.14 NS 13.48 ± 2.65* 12.85 ± 1.43 NS
Serum adiponectin (μg/mL) 6.67 ± 1.41 9.47 ± 2.95 NS 9.04 ± 1.45 7.63 ± 0.93 NS
Men 6.78 ± 2.12 7.81 ± 2.64 NS 9.51 ± 2.01 7.56 ± 1.13 NS
Women 6.57 ± 2.00 10.95 ± 5.20 NS 8.04 ± 1.56 7.77 ± 1.67 NS
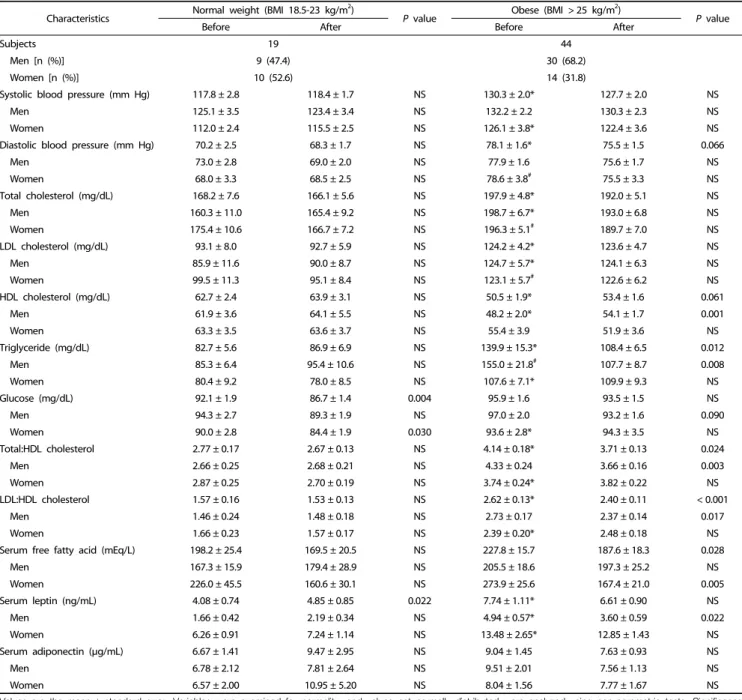
Values are the mean ± standard error. Variables were examined for normality, and values not normally distributed were analyzed using non-parametric tests. Significance was tested using a paired t-test or Wilcoxon’s signed-rank test based on normality; significance of triglyceride, glucose, Total:HDL cholesterol, LDL:HDL cholesterol, serum leptin, and serum adiponectin were determined using Wilcoxon’s signed-rank test. LDL:HDL cholesterol, ratio of LDL to HDL cholesterol; Total:HDL cholesterol, ratio of total to HDL cholesterol.
* Significant difference between the two weight groups at baseline (P< 0.05). NS: not significant (P> 0.05).
#A tendency towards a difference between the two weight groups at baseline (P< 0.1).
Table 2. Comparison of clinical characteristics before and after 12-week program participation.
to match demographic characteristics other than BMI between the two groups, subjects in the obese group were older than those in the normal weight group. However, most of the normal weight and obese subjects were in their 20s. The heights of the obese and normal weight groups were similar for both men (174.2 ± 1.7 cm in obese vs. 174.0 ± 0.7 cm in normal weight) and women (160.7 ± 1.4 cm in obese vs. 162.3 ± 1.1 cm in normal weight). The weight and BMI of the obese group were significantly higher than those of the normal weight group as
subjects were assigned to the groups according to their BMI (Table 1). The waist circumference of the obese group was also significantly higher than that of the normal weight group.
Body weight, BMI, waist circumference, WHR, and body fat
mass decreased significantly in the obese group after program
participation. In the normal weight group, there was no signi-
ficant change in weight, BMI, waist circumference, hip circum-
ference, or fat mass during the 12-week period.
Normal weight (BMI 18.5-23 kg/m2)
P value Obese (BMI 25 kg/m2)
P value
Before After Before After
Subjects 19 40
Men [n (%)] 9 (47.4) 26 (65.0)
Women [n (%)] 10 (52.6) 14 (35.0)
Energy (kcal) 1,855.3 ± 100.5 1,739.4 ± 128.0 NS 2,175.4 ± 115.7* 1,904.8 ± 77.7 0.031
Men 1,957.0 ± 186.1 1,961.8 ± 193.7 NS 2,342.9 ± 147.1 2,051.6 ± 99.4 0.088
Women 1,763.7 ± 93.1 1,539.2 ± 151.1 NS 1,864.5 ± 161.0 1,632.1 ± 87.3 NS
Protein (g) 77.4 ± 4.7 63.0 ± 4.6 0.024 92.6 ± 5.6# 83.0 ± 5.6 NS
Men 80.0 ± 7.9 69.8 ± 5.8 NS 99.1 ± 7.2 91.7 ± 7.8 NS
Women 75.1 ± 5.8 56.9 ± 6.7 0.059 80.7 ± 8.0 66.8 ± 4.4 NS
% of energy 16.9 ± 0.8 14.7 ± 0.7 0.047 17.1 ± 0.4 17.8 ± 1.3 NS
Animal protein (g) 45.4 ± 3.9 32.9 ± 3.8 NS 56.7 ± 4.2# 47.5 ± 4.7 NS
Fat (g) 62.4 ± 4.8 58.7 ± 6.6 NS 77.5 ± 5.1* 60.6 ± 3.5 0.007
Men 69.4 ± 8.8 67.2 ± 8.3 NS 82.6 ± 6.5 64.4 ± 4.5 0.030
Women 56.1 ± 4.2 50.9 ± 9.9 NS 67.9 ± 7.9 53.6 ± 5.5 NS
% of energy 29.9 ± 1.2 28.9 ± 1.6 NS 31.7 ± 1.0 28.4 ± 1.1 0.027
Animal fat (g) 34.4 ± 4.1 32.1 ± 5.1 NS 41.6 ± 3.7 32.6 ± 2.5 0.069
Carbohydrate (g) 238.2 ± 15.1 236.5 ± 15.1 NS 268.8 ± 13.6 245.4 ± 11.6 NS
Men 244.4 ± 27.2 264.7 ± 25.2 NS 287.8 ± 17.7 264.1 ± 15.8 NS
Women 232.6 ± 16.2 211.1 ± 14.2 NS 233.5 ± 17.7 210.9 ± 10.7 NS
% of energy 51.6 ± 1.9 55.8 ± 1.9 0.045 50.0 ± 0.9 51.9 ± 1.4 NS
Fiber (g) 15.2 ± 1.2 15.5 ± 1.1 NS 17.9 ± 1.0 17.8 ± 0.9 NS
Men 14.2 ± 2.0 15.3 ± 1.9 NS 18.1 ± 1.3 17.8 ± 1.1 NS
Women 16.1 ± 1.6 15.7 ± 1.3 NS 17.6 ± 1.5 17.8 ± 1.8 NS
Cholesterol (mg) 388.0 ± 38.2 317.7 ± 44.7 NS 433.1 ± 30.2 290.7 ± 22.0 0.001
Men 391.2 ± 53.0 331.0 ± 59.9 NS 440.0 ± 36.3 320.6 ± 28.9 0.017
Women 385.2 ± 57.4 305.7 ± 68.5 NS 420.3 ± 55.5 235.2 ± 28.2 0.018
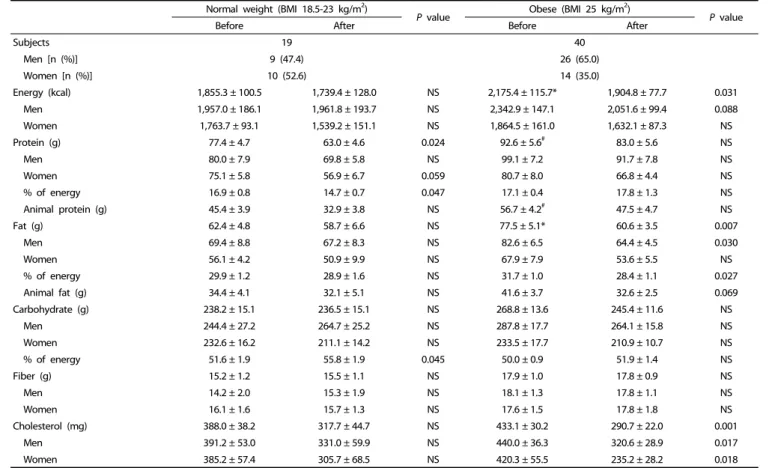
Four obese men did not submit 3-day diet records at week 12.
Values are the mean ± standard error. Variables were examined for normality, and values not normally distributed were analyzed using non- parametric tests. Significance was tested using a paired t-test or Wilcoxon’s signed-rank test based on normality. Significance of protein intake and percent calories from protein were determined using Wilcoxon’s signed-rank test.
* Significant difference between the two weight groups at baseline (P< 0.05).
#A tendency towards a difference between the two weight groups at baseline (P< 0.1).NS: not significant (P> 0.05).
Table 3. Comparison of energy, macronutrient, and cholesterol intakes estimated by 3-day diet records before and after 12-week program participation.
Changes in clinical characteristics after 12-week program partici- pation
A comparison of clinical characteristics before and after the 12-week program is shown in Table 2. The obese group had significantly higher total cholesterol, LDL cholesterol, and triglyceride concentrations and systolic and diastolic blood pressures than those of the normal weight group at baseline.
HDL cholesterol concentration was significantly lower in the obese subjects than the normal weight subjects at baseline.
There was no significant difference in fasting blood glucose between the two groups.
After 12 weeks, significant decreases in serum triglyceride and free fatty acid (FFA) concentrations were observed in the obese group. Diastolic blood pressure tended to decrease (P = 0.066), and HDL cholesterol tended to increase (P = 0.061) in the obese group.
There was no significant change in LDL cholesterol in either the normal weight or obese groups at the 12-week time point.
However, the large weight loss group (> 6 kg loss) showed a significant decrease in LDL cholesterol (from 128.3 ± 5.2 to 108.2
± 10.6 mg/dL, P = 0.029). Similarly, while the change in blood glucose concentration was not significant in the obese group, a significant decrease in blood glucose concentration was
observed in the large weight loss group (from 103.5 ± 6.6 to 90.0 ± 4.5 mg/dL, P = 0.027).
Obese subjects had significantly higher baseline serum leptin compared with normal weight subjects, and significant decreases in serum leptin concentrations in the intermediate (from 6.45 ± 0.94 to 4.76 ± 1.03 ng/mL, P = 0.017) and large weight loss groups (from 8.16 ± 3.43 to 4.45 ± 2.22 ng/mL, P
= 0.046) were observed after program participation. Serum leptin concentrations in the normal weight group increased significantly despite no significant weight change in the normal weight group. Serum high-molecular-weight (HMW)-adiponectin concentrations at baseline were not different between the two groups and did not change with weight loss.
Comparison of dietary intakes before and after 12-week program participation
Energy, macronutrients, and cholesterol intakes were estimated
by 3-day dietary records (Table 3). There was a significant
decrease in dietary intakes of energy, fat, and cholesterol in
the obese group after program participation. A significant
decrease in percent energy from fat and a tendency towards
decreased animal fat intake (P = 0.069) in the obese group were
also observed. The decline in cholesterol intake was significant
Normal weight (BMI 18.5-23 kg/m2)
P value3 Obese(BMI > 25 kg/m2)
P value
Before After Before After
Subjects 19 40
Men [n (%)] 9 (47.4) 26 (65.0)
Women [n (%)] 10 (52.6) 14 (35.0)
Vitamin A (μg RE) 679.8 ± 69.0 743.5 ± 111.0 NS 864.0 ± 95.0 784.3 ± 84.9 NS
Men 664.3 ± 137.7 873.4 ± 162.3 NS 834.3 ± 132.9 841.5 ± 125.2 NS
Women 693.8 ± 53.6 626.6 ± 150.0 NS 919.2 ± 117.9# 677.9 ± 66.5 0.048
Vitamin B1 (mg) 1.21 ± 0.13 1.14 ± 0.10 NS 1.45 ± 0.10 1.29 ± 0.08 0.090
Men 1.35 ± 0.27 1.19 ± 0.14 NS 1.60 ± 0.13 1.40 ± 0.09 NS
Women 1.07 ± 0.08 1.09 ± 0.15 NS 1.17 ± 0.13 1.10 ± 0.11 NS
Vitamin B2 (mg) 1.06 ± 0.06 1.00 ± 0.09 NS 1.36 ± 0.08* 1.17 ± 0.07 0.032
Men 1.03 ± 0.13 1.12 ± 0.11 NS 1.44 ± 0.11# 1.26 ± 0.10 NS
Women 1.09 ± 0.05 0.89 ± 0.13 NS 1.21 ± 0.10 1.00 ± 0.07 0.091
Vitamin B6 (mg) 1.85 ± 0.12 1.75 ± 0.12 NS 2.46 ± 0.16* 2.54 ± 0.41 NS
Men 2.02 ± 0.21 1.75 ± 0.17 NS 2.49 ± 0.16 2.32 ± 0.17 NS
Women 1.71 ± 0.11 1.74 ± 0.18 NS 2.40 ± 0.38 2.93 ± 1.14 NS
Niacin (mg) 16.4 ± 1.1 14.3 ± 1.1 0.078 20.5 ± 1.4* 20.6 ± 1.9 NS
Men 18.9 ± 1.7 16.1 ± 0.7 NS 22.9 ± 1.9 50.7 ± 0.9 NS
Women 14.2 ± 0.9 12.7 ± 1.9 NS 16.2 ± 1.3 16.4 ± 1.3 NS
Vitamin C (mg) 70.8 ± 8.5 67.7 ± 7.5 NS 74.4 ± 5.2 89.2 ± 8.1 0.071
Men 66.6 ± 15.6 68.6 ± 9.6 NS 74.6 ± 6.7 86.4 ± 9.1 NS
Women 74.5 ± 8.7 67.0 ± 11.9 NS 74.0 ± 8.6 94.5 ± 16.4 NS
Folate (mg) 195.2 ± 17.2 195.6 ± 14.8 NS 238.0 ± 17.2 237.9 ± 18.9 NS
Men 166.9 ± 24.9 213.5 ± 25.9 NS 242.4 ± 23.1# 243.6 ± 26.6 NS
Women 220.7 ± 21.9 179.5 ± 15.3 NS 229.9 ± 25.0 227.3 ± 22.8 NS
Vitamin E (mg) 16.0 ± 1.6 15.7 ± 1.7 NS 18.9 ± 1.3 15.4 ± 1.0 0.005
Men 15.9 ± 2.3 17.7 ± 3.3 NS 20.8 ± 1.8 16.5 ± 1.4 0.010
Women 16.1 ± 2.3 13.9 ± 1.4 NS 15.3 ± 1.0 15.5 ± 1.1 NS
Calcium (mg) 499.6 ± 42.6 460.9 ± 44.5 NS 609.5 ± 55.2 550.3 ± 36.3 NS
Men 413.3 ± 62.6 497.2 ± 63.2 NS 645.8 ± 78.1 592.8 ± 50.6 NS
Women 577.2 ± 48.5 428.3 ± 63.7 0.048 542.1 ± 61.9 471.2 ± 38.1 NS
Phosphorus (mg) 954.6 ± 58.6 859.8 ± 65.3 NS 1,172.7 ± 67.3* 1,013.8 ± 49.5 0.037
Men 947.7 ± 102.6 927.8 ± 83.3 NS 1,240.9 ± 89.0 1,076.9 ± 66.5 NS
Women 960.9 ± 68.0 798.6 ± 98.7 NS 1,046.1 ± 93.0 896.5 ± 59.9 NS
Iron (mg) 15.0 ± 1.9 12.2 ± 1.1 NS 16.4 ± 1.2 14.2 ± 1.2 0.078
Men 14.9 ± 3.4 11.5 ± 1.0 NS 17.3 ± 1.6 15.2 ± 1.7 NS
Women 15.1 ± 2.2 12.9 ± 1.8 NS 14.7 ± 1.8 12.4 ± 1.2 NS
Zinc (mg) 10.1 ± 1.6 7.5 ± 0.6 NS 10.8 ± 0.7 9.0 ± 0.5 0.010
Men 9.4 ± 1.0 8.1 ± 0.9 NS 11.7 ± 0.9 9.8 ± 0.7 0.036
Women 10.7 ± 2.9 7.0 ± 0.8 NS 9.0 ± 0.7 7.7 ± 0.5 NS
Sodium (mg) 3,360.7 ± 250.4 3,103.1 ± 270.5 NS 4,371.5 ± 239.6* 3,747.5 ± 213.8 0.027
Men 3,494.9 ± 384.5 3,598.2 ± 307.0 NS 4,718.3 ± 316.7* 3,946.0 ± 263.4 0.034
Women 3,239.8 ± 341.5 2,657.6 ± 395.0 NS 3,727.5 ± 291.2 3,379.0 ± 358.0 NS
Potassium (mg) 2,193.9 ± 123.2 2,063.5 ± 171.9 NS 2,594.1 ± 124.9# 2,492.1 ± 114.7 NS
Men 2,068.9 ± 218.7 2,230.4 ± 291.0 NS 2,756.8 ± 168.5# 2,524.9 ± 144.8 NS
Women 2,306.4 ± 128.0 1,913.4 ± 198.2 0.020 2,292.0 ± 146.6 2,431.1 ± 193.6 NS
Four obese men did not submit 3-day diet records at week 12.
Values are the mean ± standard error. Variables were examined for normality, and values not normally distributed were analyzed using non- parametric tests.Significance was tested using a paired t-test or Wilcoxon’s signed-rank test based on normality. Significance of intakes of vitamin A, vitamin B6, folate, iron, and zinc were determined using Wilcoxon’s signed-rank test.
* Significant difference between the two weight groups at baseline (P< 0.05).
#A tendency towards a difference between the two weight groups at baseline (P< 0.1). NS: not significant (P> 0.05).
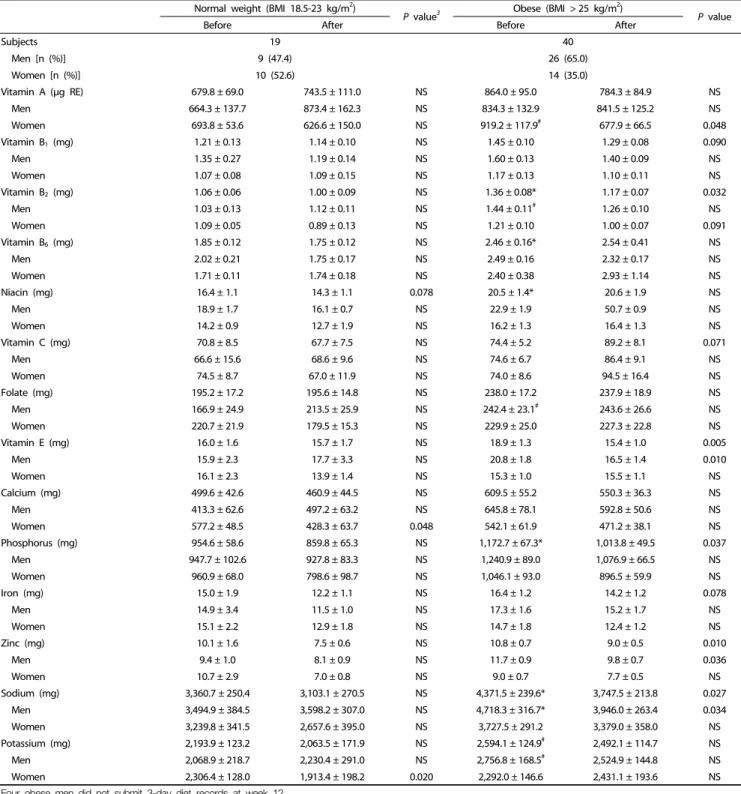
Table 4. Comparison of vitamin and mineral intakes estimated by 3-day diet records before and after 12-week program participation.
in all obese subgroups (data not shown). Carbohydrate and protein intakes of the obese group did not change significantly with program participation.
Dietary vitamin and mineral intakes assessed by 3-day dietary
records are presented in Table 4. At baseline, obese subjects
consumed significantly higher amounts of vitamin B
2, B
6, niacin,
phosphorus, and sodium than did normal weight subjects.
Significant decreases in phosphorus and sodium intakes were observed in the obese group after program participation. The obese group showed a tendency of increased vitamin C intake (P = 0.071) after program participation. While vitamin B
2, vitamin E, and zinc intakes decreased significantly in the obese group after the 12-week program, the intake levels still met Dietary Reference Intakes for Koreans (KDRIs; data not shown).
Comparison of obese subgroups divided according to weight loss magnitude
To identify factors for successful weight loss, we compared the characteristics of obese subgroups. Because all subjects in the large weight loss group (> 6 kg loss; > 100% of goal achievement) became obese in adulthood, participated in every individual counseling session, and submitted all 3-day dietary records, a statistical analysis between the large and small weight loss group was impossible for these values. Therefore, we compared the small weight loss group (< 3 kg loss; < 50% of goal achievement) with the intermediate and large weight loss groups combined (≥ 3 kg loss).
Subjects in the intermediate and large weight loss group were more diligent in submitting 3-day dietary records than those in the small weight loss group (4.9 / 5.0 vs. 4.3 / 5.0, respectively, P = 0.008; average of actual number of submissions/ number of submissions requested). In addition, those in the intermediate and large weight loss group tended to attend individual counseling more often than those in the small weight loss group (4.9 / 5.0 vs. 4.7 / 5.0, respectively, P = 0.074).
The proportion of subjects who became obese after gradua- ting high school was significantly higher in the intermediate and large weight loss group than that in the small weight loss group (93.7% vs. 46.4%, respectively, P = 0.003).
DISCUSSION
In this study, we examined the effect of a 12-week weight management program with group education and individual counseling sessions on clinical characteristics and dietary intakes in young obese but otherwise healthy adults; most of the subjects were in their 20s. Obese subjects lost an average of 2.7 kg (i.e., 3.3% of body weight), and BMI, waist and hip circumferences, WHR, and fat mass decreased after program participation. While the magnitude of weight loss seemed somewhat modest compared to the goal (> 6 kg loss), it was similar to what has been reported in previous studies [6,13].
In addition, 36% of obese subjects lost more than 3 kg (average loss of 5.5 kg and 6.6% of initial body weight).
Significant improvement in lipid profiles of the obese group, a decrease in triglyceride and FFA, was observed despite a modest weight loss. A significant decrease in serum glucose was observed only in the large weight loss group (> 6 kg loss).
These results are consistent with previous studies. Lang et al.
[12] reported that a 3.2% reduction in body weight through an 8-week program with exercise and nutrition education did not lead to a reduction in serum fasting glucose concentrations despite observed improvements in blood lipid profiles.
Dansinger et al. [13] showed that a 2-month calorie restriction
resulted in 3.5 kg of weight loss and a reduction in cardiac risk factors but no change in glucose concentrations. It seems that lipid profiles are more sensitive to modest weight loss than blood glucose concentration.
Leptin and adiponectin are adipose tissue-specific proteins, and obese people are reported to have higher leptin and lower adiponectin concentrations [14,15]. In the present study, serum leptin in the obese group decreased significantly in both intermediate (5.0% weight loss) and large weight loss groups (9.1% weight loss). This is consistent with the finding that at least 5% weight loss is required to decrease leptin concen- trations in obese people [15,16]. On the contrary, serum HMW- adiponectin concentration at baseline was not different between the obese and normal groups, which is inconsistent with findings from other studies [12,15]. However, the finding by Kuo et al. [17] that there was no significant correlation between plasma adiponectin and BMI in a healthy population is consistent with the results observed in this study. No change in serum HMW-adiponectin concentration following weight loss might indicate that adiponectin is less responsive than leptin to a moderate weight reduction. Elisabet et al. [18] also reported that 10-week hypoenergetic (-600 kcal/day) diets in obese but otherwise healthy subjects led to a significant reduction in leptin secretion but no significant change in adiponectin concen- tration with 7.5% weight loss.
It seems that a significant reduction in energy and fat intakes contributed to weight loss in the obese group in this study.
In addition, a significantly positive correlation between changes in percent calories from animal fat and BMI was observed in the obese group (r = 0.325, P = 0.041), which is consistent with the results from the study by Alison et al. [19]. The percent of calories from animal fat showed a positive association with weight gain in 41,518 women in the Nurses’ Health study. Obese subjects appeared to reduce animal based food intake during weight management program participation because significant decreases in cholesterol and sodium were observed. This may be the effect of nutrition education: in a study conducted by Dansinger et al. [13], obese subjects who were asked to maintain a restricted caloric intake (1,200-1,600 kcal) and received group education reduced intake by an average of 244 kcal per day and reduced intakes of carbohydrate, total and saturated fat, and cholesterol. Considering the positive association between fat intake and blood lipid profile, including triglyceride and cholesterol levels, the improvements in lipid profiles could be attributed to reduced fat intake, which was the main dietetic strategy in the 12-week education program. Decreased phosphorus intake might be explained by the reduced intake of processed foods and animal protein by the obese subjects, given that processed foods and animal protein usually contain high quantities of phosphorus. In addition, a significant decrease in sodium intake and a tendency towards increased vitamin C intake were observed in the obese subjects. Therefore, the 12-week program with nutrition education and personalized nutrition guidance in this study appeared to help obese subjects incorporate healthier eating patterns, as evidenced by reduced sodium and phosphorus intake and increased vitamin C intake.
Subjects who lost more than 6 kg participated more actively
in the program than subjects who lost less than 3 kg. Higher attendance at individual counseling sessions and more diligent submission of dietary records have been reported to result in more successful weight loss and better clinical outcomes [20].
Given that participation can mediate the relationship between autonomous motivation and weight loss [21], those who lost more weight may have been more motivated. Significantly more frequent submission of dietary records in those who lost more weight was observed (P = 0.008), and attendance at the scheduled individual counseling sessions tended to be higher (P = 0.074). In light of these results, the submission of 3-day dietary records seemed to be a more sensitive indicator of autonomous motivation than attendance because keeping a dietary record likely plays a role in self-monitoring [22], the centerpiece of behavioral modification for weight loss, by helping with self-assessment and providing evaluative informa- tion [23-25].
The age of obesity onset has been reported as a predictor of dropout [9] rather than as a key factor for successful weight loss. However, we identified the age subjects became obese as a key factor for successful weight loss; in this study, those who became obese after high school graduation achieved more successful weight loss compared with those who were obese during childhood despite no difference in the family history of being overweight. This result may be because those who have been obese since childhood are more likely to have deeply rooted behavioral factors related to weight gain, such as specific dietary patterns. In a study by Dunn et al. [26], of young adults in the highest or lowest intake quintiles for 13 nutrients at baseline, over 60% of the subjects remained in the same or adjacent quintiles after 7 years, which indicates that people tend to maintain their dietary habits.
There are some limitations to this study. The mean age of the obese group was significantly higher than that of the normal weight group, although we tried to match for factors other than BMI between the two groups. Additionally, the extrapolation of our results to a more heterogeneous popula- tion might be limited because the subjects included in our study were highly educated and comprised a fairly homogenous population.
In conclusion, the 12-week weight management program led to significant improvements in anthropometric and clinical characteristics, which seemed to be due to significant decreases in energy and fat intakes. Although obese subjects in this study were young and otherwise healthy, moderate weight loss resulted in beneficial effects on metabolic risk factors such as high triglyceride and FFA concentrations.
ACKNOWLEDGMENT
We thank Min Soo Kim for analysis of the FFA.
REFERENCES
1. Ministry of Health and Welfare, Korea Centers for Disease Control and Prevention. Korea Health Statistics 2010: Korea National Health and Nutrition Examination Survey (KNHANES V-1). Cheongwon:
Korea Centers for Disease Control and Prevention; 2011.
2. Nelson MC, Story M, Larson NI, Neumark-Sztainer D, Lytle LA.
Emerging adulthood and college-aged youth: an overlooked age for weight-related behavior change. Obesity (Silver Spring) 2008;16:
2205-11.
3. Anderson JW, Konz EC. Obesity and disease management: effects of weight loss on comorbid conditions. Obes Res 2001;9 Suppl 4:326S-334S.
4. Kim SJ, Lee J, Nam CM, Lee SY. Impact of obesity on metabolic syndrome among adolescents as compared with adults in Korea.
Yonsei Med J 2011;52:746-52.
5. Milsom VA, Middleton KM, Perri MG. Successful long-term weight loss maintenance in a rural population. Clin Interv Aging 2011;6:
303-9.
6. Wadden TA, Berkowitz RI, Womble LG, Sarwer DB, Phelan S, Cato RK, Hesson LA, Osei SY, Kaplan R, Stunkard AJ. Randomized trial of lifestyle modification and pharmacotherapy for obesity. N Engl J Med 2005;353:2111-20.
7. Appel LJ, Clark JM, Yeh HC, Wang NY, Coughlin JW, Daumit G, Miller ER 3rd, Dalcin A, Jerome GJ, Geller S, Noronha G, Pozefsky T, Charleston J, Reynolds JB, Durkin N, Rubin RR, Louis TA, Brancati FL. Comparative effectiveness of weight-loss interventions in clinical practice. N Engl J Med 2011;365:1959-68.
8. Dalle Grave R, Calugi S, Molinari E, Petroni ML, Bondi M, Compare A, Marchesini G; QUOVADIS Study Group. Weight loss expectations in obese patients and treatment attrition: an observational multicenter study. Obes Res 2005;13:1961-9.
9. Moroshko I, Brennan L, O'Brien P. Predictors of dropout in weight loss interventions: a systematic review of the literature. Obes Rev 2011;12:912-34.
10. Finkler E, Heymsfield SB, St-Onge MP. Rate of weight loss can be predicted by patient characteristics and intervention strategies. J Acad Nutr Diet 2012;112:75-80.
11. Inelmen EM, Toffanello ED, Enzi G, Gasparini G, Miotto F, Sergi G, Busetto L. Predictors of drop-out in overweight and obese outpatients. Int J Obes (Lond) 2005;29:122-8.
12. Lang HF, Chou CY, Sheu WH, Lin JY. Weight loss increased serum adiponectin but decreased lipid levels in obese subjects whose body mass index was lower than 30 kg/m(2). Nutr Res 2011;31:
378-86.
13. Dansinger ML, Gleason JA, Griffith JL, Selker HP, Schaefer EJ.
Comparison of the Atkins, Ornish, Weight Watchers, and Zone diets for weight loss and heart disease risk reduction: a randomized trial.
JAMA 2005;293:43-53.
14. Van Gaal LF, Mertens IL, De Block CE. Mechanisms linking obesity with cardiovascular disease. Nature 2006;444:875-80.
15. Klempel MC, Varady KA. Reliability of leptin, but not adiponectin, as a biomarker for diet-induced weight loss in humans. Nutr Rev 2011;69:145-54.
16. Varady KA, Tussing L, Bhutani S, Braunschweig CL. Degree of weight loss required to improve adipokine concentrations and decrease fat cell size in severely obese women. Metabolism 2009;58:1096- 101.
17. Kuo SM, Halpern MM. Lack of association between body mass index and plasma adiponectin levels in healthy adults. Int J Obes (Lond) 2011;35:1487-94.
18. Arvidsson E, Viguerie N, Andersson I, Verdich C, Langin D, Arner P. Effects of different hypocaloric diets on protein secretion from adipose tissue of obese women. Diabetes 2004;53:1966-71.
19. Field AE, Willett WC, Lissner L, Colditz GA. Dietary fat and weight gain among women in the Nurses' Health Study. Obesity (Silver Spring) 2007;15:967-76.
20. Bartfield JK, Stevens VJ, Jerome GJ, Batch BC, Kennedy BM, Vollmer WM, Harsha D, Appel LJ, Desmond R, Ard JD. Behavioral transitions and weight change patterns within the PREMIER trial. Obesity (Silver Spring) 2011;19:1609-15.
21. Webber KH, Tate DF, Ward DS, Bowling JM. Motivation and its relationship to adherence to self-monitoring and weight loss in a 16-week Internet behavioral weight loss intervention. J Nutr Educ Behav 2010;42:161-7.
22. Foster GD, Makris AP, Bailer BA. Behavioral treatment of obesity.
Am J Clin Nutr 2005;82:230S-235S.
23. Mockus DS, Macera CA, Wingard DL, Peddecord M, Thomas RG, Wilfley DE. Dietary self-monitoring and its impact on weight loss in overweight children. Int J Pediatr Obes 2011;6:197-205.
24. Burke LE, Wang J, Sevick MA. Self-monitoring in weight loss: a systematic review of the literature. J Am Diet Assoc 2011;111:92- 102.
25. Wilde MH, Garvin S. A concept analysis of self-monitoring. J Adv Nurs 2007;57:339-50.
26. Dunn JE, Liu K, Greenland P, Hilner JE, Jacobs DR Jr. Seven-year tracking of dietary factors in young adults: the CARDIA study. Am J Prev Med 2000;18:38-45.