ORIGINAL ARTICLE
경동맥화학색전술 불응성인 Child-Pugh Class A 간세포암 환자의 간기능 악화에 대한 위험인자
박강현, 김정한, 최원혁, 권소영, 유병철, 황진호 1 , 박상우 1 , 김영준 1 , 박희선 1 , 유미혜 1 , 전혜정 1
건국대학교 의학전문대학원 내과학교실, 영상의학교실1
Risk Factors for Liver Function Deterioration after Transarterial Chemoembolization Refractoriness in Child-Pugh Class A Hepatocellular Carcinoma Patients
Kang Hyun Park, Jeong Han Kim, Won Hyeok Choe, So Young Kwon, Byung Chul Yoo, Jin Ho Hwang1, Sang Woo Park1, Young Jun Kim1, Hee Sun Park1, Mi Hye Yu1 and Hae Jeong Jeon1
Departments of Internal Medicine and Radiology
1, Konkuk University School of Medicine, Seoul, Korea
Background/Aims: A switch to systemic therapy, such as sorafenib, should be considered for hepatocellular carcinoma (HCC) pa- tients refractory to transarterial chemoembolization (TACE). On the other hand, treatment changes are difficult if the liver function worsens to Child-Pugh B or C. Therefore, predicting the risk factors for non-responsiveness to TACE and deteriorating liver function may be helpful.
Methods: Newly diagnosed Child-Pugh A HCC patients who underwent TACE from January 2012 to June 2018 were included. After 1 year, this study evaluated whether there was a treatment response to TACE and whether the Child-Pugh class had worsened.
Results: Among 121 patients, 65 were refractory and 56 responded to TACE. In multivariable logistic regression analysis, the tu- mor size, tumor number, and albumin at the time of the diagnosis of HCC were significant prognostic factors for the treatment re- sponse to TACE. Among 65 patients who presented TACE-refractoriness, 27 showed liver function deterioration from Child-Pugh class A to class B or C after TACE. In multivariable logistic regression analysis, bilirubin at the diagnosis of HCC was a significant prognostic factor for liver function deterioration. A predictive algorithm based on the regression equations revealed a sensitivity, specificity, positive predictive value, and negative predictive value of 74.1%, 74.5%, 45.5%, and 90.9%, respectively, for TACE-re- fractoriness and liver function deterioration.
Conclusions: The prognostic model incorporating the tumor size, tumor number, albumin, and bilirubin at the diagnosis of HCC may help identify patients who show a poor response to TACE and aggravation of liver function after TACE, who may benefit from early switching into systemic therapy before liver function aggravation. (Korean J Gastroenterol 2020;75:147-156)
Key Words: Carcinoma, hepatocellular; Chemoembolization, therapeutic
Received October 22, 2019. Revised February 10, 2020. Accepted February 10, 2020.
CC
This is an open access article distributed under the terms of the Creative Commons Attribution Non-Commercial License (http://creativecommons.org/licenses/
by-nc/4.0) which permits unrestricted non-commercial use, distribution, and reproduction in any medium, provided the original work is properly cited.
Copyright © 2020. Korean Society of Gastroenterology.
교신저자: 김정한, 05029, 서울시 광진구 능동로 120, 건국대학교 의학전문대학원 내과학교실
Correspondence to: Jeong Han Kim, Department of Internal Medicine, Konkuk University School of Medicine, 120-1 Neungdong-ro, Gwangjin-gu, Seoul 05030, Korea.
Tel: +82-2-2030-7764, Fax: +82-2-2030-5029, E-mail: [email protected], ORCID: https://orcid.org/0000-0002-8383-8524 Financial support: This paper was supported by Konkuk University in 2019.
Conflict of interest: None.
INTRODUCTION
A majority of hepatocellular carcinoma (HCC) cases are of-
ten inoperable at the time of diagnosis because of the poor
liver function, portal hypertension, multiplicity of tumors, por-
tal vein tumor invasion, inability to secure a sufficient resection
Fig. 1. Patient flow diagram. HCC, hepatocellular carcinoma; TACE, transarterial chemoembolization; RFA, radiofrequency ablation.
margin, old age, and severe comorbidities.
1Transarterial che- moembolization (TACE) is the most commonly used non- surgical treatment modality for these patients, as shown in the global HCC BRIDGE ('bridge to better outcomes in HCC') study, which was a multiregional, large-scale, longitudinal co- hort study.
2Although many studies have demonstrated that TACE can increase survival compared to conservative treat- ment, TACE often has to be repeated, and it is difficult to obtain complete cure.
3-5The development of untreatable pro- gression of HCC, in which TACE can no longer be considered, is regarded as TACE refractoriness or failure.
6-8Recent prac- tice guidelines on HCC have defined TACE refractoriness in different ways.
6On the other hand, in the case of TACE re- fractoriness, the majority of guidelines recommend switching to another treatment, such as sorafenib.
6,9-12Among patients with TACE refractoriness, switching to an- other treatment would not be an issue if Child-Pugh class A could be maintained without a deterioration of the liver function. On the other hand, it is difficult to switch treatments if the liver function worsens to Child-Pugh class B or C after TACE. No clear recommendations for systemic therapy, such
as sorafenib, have been made for Child-Pugh class B or C patients, and poor outcomes were reported in the GIDEON trial.
13-15Therefore, this retrospective study examined the risk factors in patients who did not respond to TACE and had a deteriorated liver function to predict which patients will experi- ence these conditions using statistical methods.
SUBJECTS AND METHODS
1. Patients and methods
This was a retrospective cohort study. The Konkuk University Medical Center HCC registry was screened from January 2012 to June 2018. From this registry, 407 patients who received TACE as an initial treatment were identified. Among them, 286 patients who met the following exclusion criteria were ex- cluded: 1) patients treated with TACE at other hospitals; 2) patients who had a short-term follow-up period (<6 months);
3) patients who had double primary cancer; 4) patients who
were treated concurrently with radiofrequency ablation or hep-
atectomy; and 5) patients who were Child-Pugh class B or
C. Finally, 121 Child-Pugh class A patients were included in
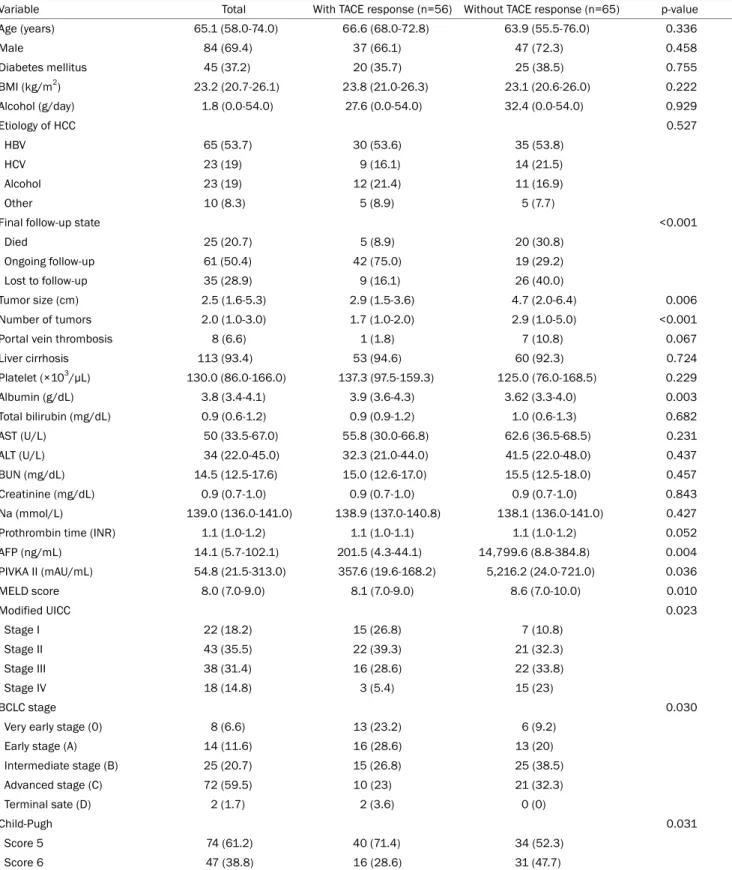
Table 1. Baseline Characteristics of All the Patients (n=121) with HCC and Child-Pugh Class A Liver Function First Treated by TACE and Comparisons of the Patients according to the TACE Response
Variable Total With TACE response (n=56) Without TACE response (n=65) p-value
Age (years) 65.1 (58.0-74.0) 66.6 (68.0-72.8) 63.9 (55.5-76.0) 0.336
Male 84 (69.4) 37 (66.1) 47 (72.3) 0.458
Diabetes mellitus 45 (37.2) 20 (35.7) 25 (38.5) 0.755
BMI (kg/m
2) 23.2 (20.7-26.1) 23.8 (21.0-26.3) 23.1 (20.6-26.0) 0.222
Alcohol (g/day) 1.8 (0.0-54.0) 27.6 (0.0-54.0) 32.4 (0.0-54.0) 0.929
Etiology of HCC 0.527
HBV 65 (53.7) 30 (53.6) 35 (53.8)
HCV 23 (19) 9 (16.1) 14 (21.5)
Alcohol 23 (19) 12 (21.4) 11 (16.9)
Other 10 (8.3) 5 (8.9) 5 (7.7)
Final follow-up state <0.001
Died 25 (20.7) 5 (8.9) 20 (30.8)
Ongoing follow-up 61 (50.4) 42 (75.0) 19 (29.2)
Lost to follow-up 35 (28.9) 9 (16.1) 26 (40.0)
Tumor size (cm) 2.5 (1.6-5.3) 2.9 (1.5-3.6) 4.7 (2.0-6.4) 0.006
Number of tumors 2.0 (1.0-3.0) 1.7 (1.0-2.0) 2.9 (1.0-5.0) <0.001
Portal vein thrombosis 8 (6.6) 1 (1.8) 7 (10.8) 0.067
Liver cirrhosis 113 (93.4) 53 (94.6) 60 (92.3) 0.724
Platelet (×10
3/µL) 130.0 (86.0-166.0) 137.3 (97.5-159.3) 125.0 (76.0-168.5) 0.229
Albumin (g/dL) 3.8 (3.4-4.1) 3.9 (3.6-4.3) 3.62 (3.3-4.0) 0.003
Total bilirubin (mg/dL) 0.9 (0.6-1.2) 0.9 (0.9-1.2) 1.0 (0.6-1.3) 0.682
AST (U/L) 50 (33.5-67.0) 55.8 (30.0-66.8) 62.6 (36.5-68.5) 0.231
ALT (U/L) 34 (22.0-45.0) 32.3 (21.0-44.0) 41.5 (22.0-48.0) 0.437
BUN (mg/dL) 14.5 (12.5-17.6) 15.0 (12.6-17.0) 15.5 (12.5-18.0) 0.457
Creatinine (mg/dL) 0.9 (0.7-1.0) 0.9 (0.7-1.0) 0.9 (0.7-1.0) 0.843
Na (mmol/L) 139.0 (136.0-141.0) 138.9 (137.0-140.8) 138.1 (136.0-141.0) 0.427
Prothrombin time (INR) 1.1 (1.0-1.2) 1.1 (1.0-1.1) 1.1 (1.0-1.2) 0.052
AFP (ng/mL) 14.1 (5.7-102.1) 201.5 (4.3-44.1) 14,799.6 (8.8-384.8) 0.004
PIVKA II (mAU/mL) 54.8 (21.5-313.0) 357.6 (19.6-168.2) 5,216.2 (24.0-721.0) 0.036
MELD score 8.0 (7.0-9.0) 8.1 (7.0-9.0) 8.6 (7.0-10.0) 0.010
Modified UICC 0.023
Stage I 22 (18.2) 15 (26.8) 7 (10.8)
Stage II 43 (35.5) 22 (39.3) 21 (32.3)
Stage III 38 (31.4) 16 (28.6) 22 (33.8)
Stage IV 18 (14.8) 3 (5.4) 15 (23)
BCLC stage 0.030
Very early stage (0) 8 (6.6) 13 (23.2) 6 (9.2)
Early stage (A) 14 (11.6) 16 (28.6) 13 (20)
Intermediate stage (B) 25 (20.7) 15 (26.8) 25 (38.5)
Advanced stage (C) 72 (59.5) 10 (23) 21 (32.3)
Terminal sate (D) 2 (1.7) 2 (3.6) 0 (0)
Child-Pugh 0.031
Score 5 74 (61.2) 40 (71.4) 34 (52.3)
Score 6 47 (38.8) 16 (28.6) 31 (47.7)
Values are presented as median (interquartile range) or n (%).
HCC, hepatocellular carcinoma; TACE, transarterial chemoembolization; BMI, body mass index; HBV, hepatitis B virus; HCV, hepatitis C virus; AST, aspartate transaminase; ALT, alanine transaminase; BUN, blood urea nitrogen; Na, sodium; INR, international normalized ratio; AFP, alpha-fetopro- tein; PIVKA II, protein induced by vitamin K absence-II; MELD, model for end-stage liver disease; UICC, Union for International Cancer Control;
BCLC, Barcelona Clinic Liver Cancer.
Table 2. Prognostic Factor Analysis for the TACE Refractoriness by Logistic Regression
Characteristic Univariable OR (95% CI) p-value Multivariable OR (95% CI) p-value
Age (years) 0.977 (0.945-1.010) 0.169
Male 0.746 (0.343-1.619) 0.458
BMI (kg/m
2) 0.936 (0.843-1.040) 0.221
Portal vein thrombosis 0.151 (0.018-1.265) 0.081
Tumor size (cm) 1.238 (1.067-1.437) 0.005 1.204 (1.018-1.424) 0.030
Number of tumors 1.642 (1.235-2.184) 0.001 1.503 (1.117-2.023) 0.007
Albumin (g/dL) 0.321 (0.142-0.686) 0.004 0.287 (0.120-0.685) 0.005
Platelet (×10
3/μL) 0.996 (0.990-1.003) 0.244
Na (mmol/L) 0.933 (0.838-1.040) 0.209
Prothrombin time (INR) 23.864 (0.870-654.732) 0.060
AFP (ng/mL) 1.000 (1.000-1.001) 0.232
PIVKA II (mAU/mL) 1.000 (1.000-1.000) 0.245
TACE, transarterial chemoembolization; OR, odds ratio; CI, confidence interval; BMI, body mass index; Na, sodium; INR, international normalized ratio; AFP, alpha-fetoprotein; PIVKA II, protein induced by vitamin K absence-II.
Non-response score
=0.186×(HCC size)+0.408×(HCC No.)-1.25×(Alb)+3.298
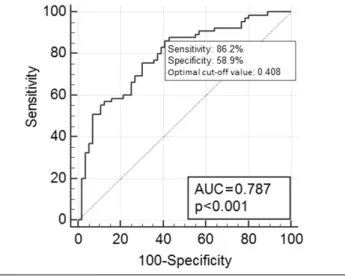
Fig. 2. ROC curves and equations of the multivariable logistic regression of TACE refractoriness. AUC, area under the curve; HCC, hepatocellular carcinoma; Alb, albumin; ROC, receiver operating characteristic; TACE, transarterial chemoembolization.
this study (Fig. 1).
The Institutional Review Board of the Konkuk University Medical Center reviewed and approved this study (IRB No:
2019-08-038). Because the study was based on the retro- spective analysis of existing administrative and clinical data, the Institutional Review Board waived the requirement of in- formed patient consent.
2. TACE response evaluation and follow-up
One year after TACE, this study evaluated the response ac- cording to the 2018 Korean guidelines for the management of HCC and the modified Response Evaluation Criteria in Solid Tumors (mRECIST).
6,16The 2018 Korean Liver Cancer Association- National Cancer Center Korea practice guidelines for the man- agement of HCC evaluated TACE refractoriness are as follows.
After two or more on-demand sessions of TACE within 6 months after the first session of TACE, 1) an objective re- sponse was absent (complete or partial response), or 2) there was a new appearance of vascular invasion or extrahepatic spread.
6According to the mRECIST criteria, a complete re- sponse was defined as the disappearance of any intratumoral arterial enhancement in all target lesions, and a partial re- sponse was defined as at least a 30% decrease in the sum of the diameters of the viable (contrast-enhanced in the arte- rial phase) target lesions.
16In addition to evaluating the TACE response, laboratory and clinical data were also collected 1 year after TACE. Using these data, the Child-Pugh score 1 year after TACE was calculated.
3. Statistical analysis
According to the response to TACE, comparisons were per- formed using an independent t-test or Mann-Whitney U-test for the continuous variables, and a chi-square test or Fisher’s exact test for the categorical variables, where appropriate. The prognostic factors for TACE refractoriness and liver function deterioration after TACE were selected by logistic regression.
Covariates with a p-value <0.25 from univariate analysis were
included in multivariable analysis. A prognostic model was
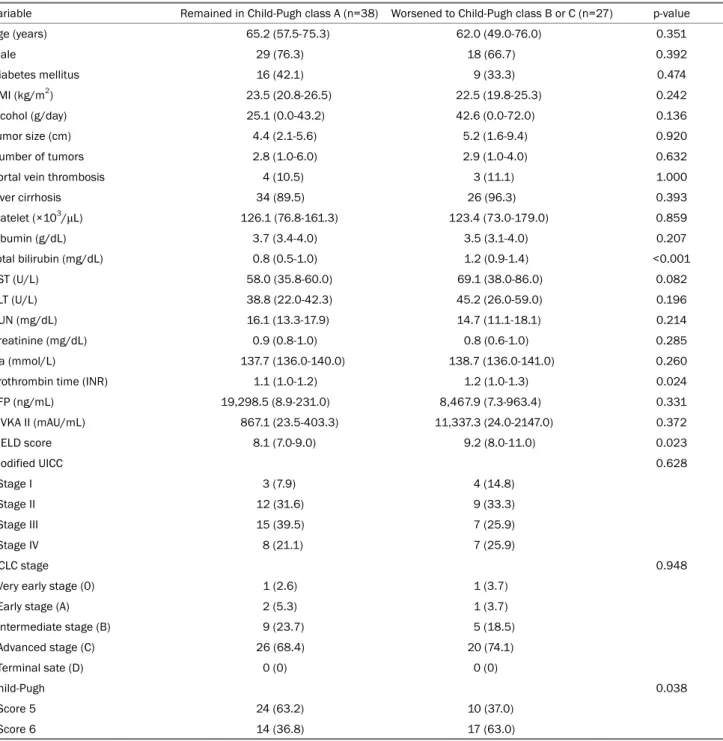
Table 3. Baseline Clinical and Tumor Characteristics according to Liver Function Deterioration after TACE among the Patients Who Showed TACE Refractoriness
Variable Remained in Child-Pugh class A (n=38) Worsened to Child-Pugh class B or C (n=27) p-value
Age (years) 65.2 (57.5-75.3) 62.0 (49.0-76.0) 0.351
Male 29 (76.3) 18 (66.7) 0.392
Diabetes mellitus 16 (42.1) 9 (33.3) 0.474
BMI (kg/m
2) 23.5 (20.8-26.5) 22.5 (19.8-25.3) 0.242
Alcohol (g/day) 25.1 (0.0-43.2) 42.6 (0.0-72.0) 0.136
Tumor size (cm) 4.4 (2.1-5.6) 5.2 (1.6-9.4) 0.920
Number of tumors 2.8 (1.0-6.0) 2.9 (1.0-4.0) 0.632
Portal vein thrombosis 4 (10.5) 3 (11.1) 1.000
Liver cirrhosis 34 (89.5) 26 (96.3) 0.393
Platelet (×10
3/μL) 126.1 (76.8-161.3) 123.4 (73.0-179.0) 0.859
Albumin (g/dL) 3.7 (3.4-4.0) 3.5 (3.1-4.0) 0.207
Total bilirubin (mg/dL) 0.8 (0.5-1.0) 1.2 (0.9-1.4) <0.001
AST (U/L) 58.0 (35.8-60.0) 69.1 (38.0-86.0) 0.082
ALT (U/L) 38.8 (22.0-42.3) 45.2 (26.0-59.0) 0.196
BUN (mg/dL) 16.1 (13.3-17.9) 14.7 (11.1-18.1) 0.214
Creatinine (mg/dL) 0.9 (0.8-1.0) 0.8 (0.6-1.0) 0.285
Na (mmol/L) 137.7 (136.0-140.0) 138.7 (136.0-141.0) 0.260
Prothrombin time (INR) 1.1 (1.0-1.2) 1.2 (1.0-1.3) 0.024
AFP (ng/mL) 19,298.5 (8.9-231.0) 8,467.9 (7.3-963.4) 0.331
PIVKA II (mAU/mL) 867.1 (23.5-403.3) 11,337.3 (24.0-2147.0) 0.372
MELD score 8.1 (7.0-9.0) 9.2 (8.0-11.0) 0.023
Modified UICC 0.628
Stage I 3 (7.9) 4 (14.8)
Stage II 12 (31.6) 9 (33.3)
Stage III 15 (39.5) 7 (25.9)
Stage IV 8 (21.1) 7 (25.9)
BCLC stage 0.948
Very early stage (0) 1 (2.6) 1 (3.7)
Early stage (A) 2 (5.3) 1 (3.7)
Intermediate stage (B) 9 (23.7) 5 (18.5)
Advanced stage (C) 26 (68.4) 20 (74.1)
Terminal sate (D) 0 (0) 0 (0)
Child-Pugh 0.038
Score 5 24 (63.2) 10 (37.0)
Score 6 14 (36.8) 17 (63.0)
Values are presented as median (interquartile range) or n (%).
TACE, transarterial chemoembolization; BMI, body mass index; AST, aspartate transaminase; ALT, alanine transaminase; BUN, blood urea nitrogen; Na, sodium; INR, international normalized ratio; AFP, alpha-fetoprotein; PIVKA II, protein induced by vitamin K absence-II; MELD, model for end-stage liver disease; UICC, Union for International Cancer Control; BCLC, Barcelona Clinic Liver Cancer.
made for both clinical outcomes using a regression equation, respectively, and the optimal cut-off values for the above clin- ical two outcomes were calculated on the area under the re- ceiver operating characteristic curve (AUROC). Finally, these two prognostic models were applied sequentially to select the
poor prognosis group, in which the patients were likely to show
not only TACE-refractoriness but also liver function deterio-
ration after TACE. Statistical analyses were performed using
SPSS, version 17.0 (SPSS Inc., Chicago, IL, USA) and SAS ver-
sion 9.4 (SAS Institute Inc., Cary, NC, USA). In the statistical
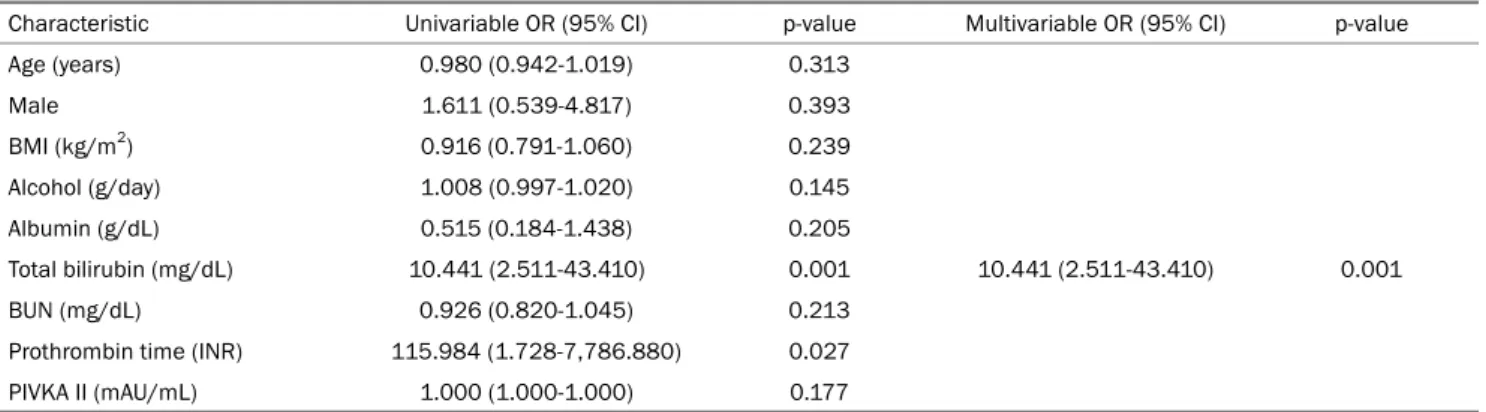
Table 4. Prognostic Factor Analysis for Liver Function Deterioration after TACE by Logistic Regression
Characteristic Univariable OR (95% CI) p-value Multivariable OR (95% CI) p-value
Age (years) 0.980 (0.942-1.019) 0.313
Male 1.611 (0.539-4.817) 0.393
BMI (kg/m
2) 0.916 (0.791-1.060) 0.239
Alcohol (g/day) 1.008 (0.997-1.020) 0.145
Albumin (g/dL) 0.515 (0.184-1.438) 0.205
Total bilirubin (mg/dL) 10.441 (2.511-43.410) 0.001 10.441 (2.511-43.410) 0.001
BUN (mg/dL) 0.926 (0.820-1.045) 0.213
Prothrombin time (INR) 115.984 (1.728-7,786.880) 0.027
PIVKA II (mAU/mL) 1.000 (1.000-1.000) 0.177
TACE, transarterial chemoembolization; OR, odds ratio; CI, confidence interval; BMI, body mass index; BUN, blood urea nitrogen; INR, international normalized ratio; PIVKA II, protein induced by vitamin K absence-II.
hypothesis test, a p-value <0.05 was considered significant.
RESULTS
1. Baseline characteristics
Table 1 lists the baseline characteristics of the included patients. Of the 121 patients, 69.4% were male, and the me- dian age was 65.1 years. The major cause of the underlying liver disease was a HBV infection (53.7%). The HCC classi- fication was performed according to the Barcelona Clinic Liver Cancer (BCLC) staging; 6.6% of patients were classified as BCLC 0, 11.6% as BCLC A, 20.7% as BCLC B, 59.5% as BCLC C, and 1.7% as BCLC D. Sixty-one percent of the patients had a Child-Pugh score of 5 points; the other 38.8% of pa- tients had a score of 6 points.
2. Risk factors for TACE refractoriness
Among the 121 patients with Child-Pugh class A, 56 pa- tients were evaluated as having a treatment response to TACE;
the other 65 patients did not. Table 1 lists the characteristics of the patients with and without a TACE response. The pa- tients without response to TACE had larger tumor sizes (p=0.006), greater tumor numbers (p<0.001), poorer liver function (more patients had a Child-Pugh score of 6 and a lower albumin level), higher AFP levels (p=0.04), and higher protein induced by vitamin K absence-II (p=0.036) than those with no response to TACE.
Univariate logistic regression analysis for predicting the re- fractoriness to TACE showed that the tumor size, tumor num- ber, and albumin level at the initial diagnosis of HCC were statistically significant predictive factors. Multivariable analy-
sis was performed and included all covariates with p<0.25 from univariate analysis; these were age, gender, BMI, portal vein thrombosis, platelet count, sodium, INR, tumor size, tu- mor number, and albumin level. Among these variables, the tumor size, number of tumors, and albumin levels were identi- fied as significant factors predicting the TACE refractoriness (Table 2). Based on predictive factor analysis, a regression equation was constructed, and the non-response risk was calcu- lated as follows: non-response score=0.186×(tumor size [cm]) +0.408×(tumor number)-1.25×(albumin [g/dL])+3.298. This predictive model for the TACE refractoriness showed an AUROC value of 0.787 and an optimal cut-off value of 0.408.
According to this cut-off value, the TACE refractoriness could be predicted, showing a sensitivity and specificity of 86.2%
and 58.9%, respectively (Fig. 2).
3. Liver function deterioration after TACE refractoriness in Child-Pugh class A HCC patients
Of the 65 patients, who did not respond to TACE, 38 pa- tients remained in Child-Pugh class A, and 27 patients wors- ened to Child-Pugh class B and C (Fig. 1). The patients with a liver function that deteriorated to Child-Pugh class B or C had significantly higher values for the following variables com- pared to the Child-Pugh class A patients: total bilirubin (p<0.001), PT (INR) (p=0.024), Child-Pugh score (more pa- tients had a Child-Pugh score of 6, p=0.038), and model for end-stage liver disease (MELD) score (p=0.023) (Table 3).
Univariate logistic regression analysis for predicting a dete- rioration in the liver function showed that the total bilirubin and INR were statistically significant prognostic factors.
Multivariable analysis, which included all covariates with
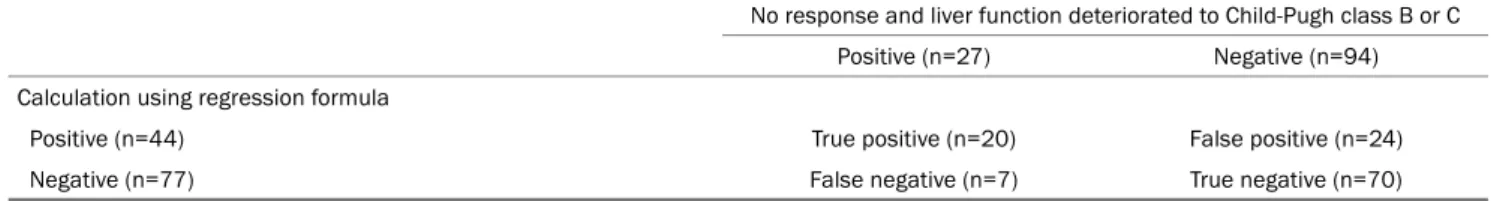
Table 5. Calculation of the Prediction of Patients with Reduced Liver Function without a Response after TACE Using the Regression Formula No response and liver function deteriorated to Child-Pugh class B or C
Positive (n=27) Negative (n=94)
Calculation using regression formula
Positive (n=44) True positive (n=20) False positive (n=24)
Negative (n=77) False negative (n=7) True negative (n=70)
Sensitivity=74.1%, specificity=74.5%, positive predictive value=45.5%, negative predictive value=90.9%.
TACE, transarterial chemoembolization.
Fig. 4. Prediction of patients with reduced liver function without a response after TACE using the regression formula. HCC, hepatocellular carcinoma; TACE, transarterial chemoembolization.
Fig. 3. Total bilirubin ROC curves of the univariable logistic regression of liver function deterioration. AUC, area under the curve;
ROC, receiver operating characteristic.
p<0.25 from univariate analysis, was performed; these were age, gender, BMI, alcohol (g/day), albumin, BUN, protein induced by vitamin K absence-II, total bilirubin, and INR. Of these, only the total bilirubin was identified as a significant prog-
nostic factor of a deterioration in the liver function (Table 4).
The predictive model, including total bilirubin, presented an AUROC value of 0.774 and an optimal cut-off value of 0.82 mg/dL. According to this cut-off value, liver function deterio- ration could be predicted with a sensitivity and specificity of 81.5% and 68.4%, respectively (Fig. 3).
4. Prediction of nonresponsive patients with reduced liver function
Using the above two predictive models, this study could determine how predictable the TACE refractoriness and the deterioration to Child-Pugh class B and C after TACE. Among the 121 patients, 44 patients were expected to have no TACE response and liver function deterioration (Fig. 4). The sensi- tivity, specificity, positive predictive value, and negative pre- dictive value were 74.1%, 74.5%, 45.5%, and 90.9%, re- spectively (Table 5).
5. Subgroup analysis