Vol. 13, No. 4 pp. 1480-1487, 2012
Failure Load Prediction of Tunnel Support using DOE and Optimization Algorithm
DONG-WOO LEE
1and SEOK-SWOO CHO
2*1Division of Automotive & Mechanical Engineering, Changwon Moonsung University
2Dept. of Vehicle Engineering, Kangwon National University
실험계획법과 최적화알고리듬을 이용한 터널지보의 파손하중 예측
이동우
1, 조석수
2*1창원문성대학 자동차기계학부, 2강원대학교 자동차공학과
Abstract Recently, the safety of the coal-mining tunnels has been improved greatly, but accidents occur continually. Most tunnel support failures occur because the fish plate part that connects the I-beams is unable to withstand ground pressure. In the case of XX coal mine, the arch part of tunnel support bends to the upper direction. In such a case, excessive horizontal load as well as vertical load acts on the tunnel support.
Horizontal load is caused by the sudden loosing of underground rock mass or the leakage of underground water, so it is fairly complex to predict horizontal loading on a tunnel support. To predict the horizontal load on this component is defined as the problem that determines the horizontal load conditions in wedges of tunnel support. This is an optimization problem in which maximum bending stress and horizontal load are considered by an objective function and design variables, respectively. Therefore, in this study, design of experiments and optimization algorithm were applied to identify the horizontal load in tunnel support.
요 약 최근, 국내 탄광의 안전성이 향상되고 있으나 사고는 꾸준히 발생하고 있다. 대부분의 터널 지보는 I빔과 I
빔을 연결하는 이음판 부분에서 지압을 견디지 못하고 파손이 발생한다. XX 탄광의 경우, 터널지보의 아치부가 일반
적인 굽힘 거동이 아닌, 위쪽 방향으로 굽힘이 발생하고 있다. 이러한 경우는 터널지보에 수직하중 이외에 수평하중
이 과대하게 작용하는 경우로 볼 수 있으며 이러한 수평하중은 지하암반의 급격한 변화에 의한 암반의 이완범위의
증가나 지하수의 누출 등으로 인한 수리학적인 요인 등의 복합적인 문제가 작용하여 나타난다. 따라서 본 연구에서는
위쪽 방향으로 굽힘을 일으키는 수평하중의 크기를 추정하기 위하여 실험계획법과 최적화 알고리듬을 적용하여 터널
지보의 굽힘거동을 규명하였다.
Key Words : Design of experiments(DOE), Desirability function, Fish plate, I-beam, Stability, Tunnel support
*Corresponding Author : Seok-Swoo Cho
Tel: +82-10-6374-6394 email: [email protected]
Received February 6, 2012 Revised February 28, 2012 Accepted April 12, 2012
1. Introduction
The Korean coal industry originated in Gyeongwongun County and Jongsunggun County, Hamgyong-bukdo Province in 1896. Recently, the safety of the coal-mining tunnels has been improved greatly, but accidents occur continually. How a tunnel is supported is very important
because the stability of a tunnel is directly connected with human life in the coal manufacturing process. Most Korean coal-mine tunnels are supported by I-beam steel supports. Most tunnel support failures occur because the fish plate part that connects the I-beams is unable to withstand ground pressure. In the case of XX coal mine, the arch part of tunnel support bends to the upper
direction.[1] In such a case, excessive horizontal load as well as vertical load acts on the tunnel support. Horizontal load is caused by the sudden loosing of underground rock mass or the leakage of underground water, so it is fairly complex to predict horizontal loading on a tunnel support.
To predict the horizontal load on this component is defined as the problem that determines the horizontal load conditions in wedges of tunnel support. This is an optimization problem in which maximum bending stress and horizontal load are considered by an objective function and design variables, respectively. In this study, the response surface was constructed by the face centered central composite experimental design, and the horizontal load that induced upper direction bending was determined by the desirability function. The optimization algorithm was applied to identify the loading conditions.
2. Basic study on tunnel support
2.1 Tunnel support
Fig. 1 shows the shape and size of a tunnel support.
The I-beams of the tunnel support are connected by a fishplate. A wedge is fixed between the support and a rock. The ground pressure is delivered uniformly to the tunnel support, and the loosing of the underground rock mass is prevented by wedge. Fig. 2 shows a cross section of the I-beam and a fishplate in a tunnel support.
Specification of the beam is 10080 I-beam.[1]
[Fig. 1] Schematic illustration for structure of tunnel support
[Fig. 2] Section of tunnel support
2.2 Bending failure accident of tunnel support
In some domestic coal mines, the fishplate that connects the I-beams was bent by ground pressure.
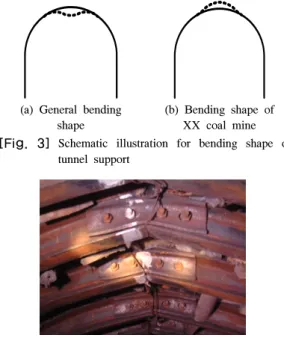
Usually, most excessive support condition of tunnel support is the vertical loading that acts on the tunnel ceiling just before a shotcrete is placed.[2] Therefore, the tunnel support arch bends downward because the maximum bending moment occurs in the tunnel arch ceiling. But, the tunnel support arch often bends upward in some domestic coal mines. Fig.3 explains these phenomena. Fig. 4 shows that the tunnel support fishplate in XX coal mine was bent by ground pressure. The probability of bending failure of a tunnel support fishplate was 2% at this worksite.[1] Tunnel support failure accidents result in increase of replacement cost and loss of human lives. Therefore, the mechanical analysis for the bending failure of tunnel support fishplate needs to be carried out to solve this problem.
(a) General bending shape
(b) Bending shape of XX coal mine [Fig. 3] Schematic illustration for bending shape of
tunnel support
[Fig. 4] Photograph for bending of tunnel support
3. Load estimation of tunnel support
3.1 Material test
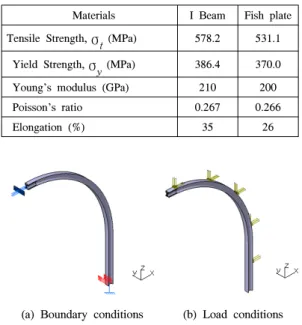
A tensile test was performed by the universal testing machine (Shimadzu, UH-F100A : 980 kN) to obtain the mechanical properties of the I-beam and the fishplate.
Table 1 shows tensile test results.
3.2 FEA for tunnel support 3.2.1 Finite element model
Structural analysis for the tunnel support was carried out by CATIA V5 R14.[3] Only half of the tunnel support was modeled because a tunnel support is symmetrical.
The finite element in the model was a 3-D ten-node tetrahedron element. The number of elements was 39,231 and the number of nodes was 69,289. The I-beam was a hot rolled beam and the fishplate was made with rolled steel used for general structure.
[Table 1] Material properties of steel arch tunnel support Materials I Beam Fish plate Tensile Strength,
σ
t (MPa) 578.2 531.1 Yield Strength,σ
y (MPa) 386.4 370.0 Young's modulus (GPa) 210 200
Poisson's ratio 0.267 0.266
Elongation (%) 35 26
(a) Boundary conditions (b) Load conditions [Fig. 5] Boundary and load conditions of tunnel support
3.2.2 Boundary conditions
The tunnel support consisted of a I-beam and fishplate.
The I-beam and fishplate were joined by a round-head bolt and nut. The I-beam and fishplate were considered as a part because the tunnel support bent in the fishplate.
That is, linear contact conditions were applied on the
contact surface between the I-beam and fishplate. The 1/2 symmetrical plane of tunnel support was constrained in the x direction because of the symmetry of the tunnel support. The tunnel support part was constrained in the x and y directions. The plane under the tunnel support was constrained in all directions. Fig. 5 (a) shows the boundary conditions of the tunnel support.
3.2.3 Loading conditions
Tunnel support was loaded according to the condition determined by the face centered central composite experimental design in Table 4. Fig. 5 (b) shows the loading conditions of the tunnel support. Horizontal load and vertical load were loaded on the wedge between the tunnel support and underground rock mass.
3.3 Prediction of tunnel support loads Tunnel support arch bent upwards; that is, the horizontal load as well as the vertical load was loaded excessively to the tunnel support. A horizontal load occurs because of the sudden loosing of the underground rock mass or the leakage of underground water.
Therefore, it is very difficult to predict the horizontal load in a tunnel support.
The horizontal load in tunnel support can be obtained by evaluating the loading conditions of the tunnel support.
This is an optimization problem in which the maximum bending stress and horizontal load are considered by an objective function and variable, respectively. Therefore, the optimization of tunnel support bending was formulated to predict the horizontal load in the tunnel support.
Fig. 6 shows the work flowchart for the estimation of the horizontal load in a tunnel support. First, the load is determined by Terzaghi's rock classification method.
Second, the maximum stress and maximum displacement are obtained by use of an orthogonal array. Third, the maximum stress and maximum displacement are regressed by the tunnel support load. Fourth, the horizontal load in tunnel support is predicted by the desirability function in the maximum stress and maximum displacement regression equation.
3.3.1 Determination of tunnel support load Tunnel support load is produced when underground
Rock condition RQD Rock load
Hp (m) Remarks
1. Hard and intact 95 - 100 Zero
Light lining required only if spalling or popping occures.
2. Hard stratified or schistose
90 - 99
0
~ 0.5B
Light support, mainly for protection against
spalls.
3.
Massive, moderately
jointed
85 - 95
0
~ 0.25B
Load may change erratically from point
to point.
4.
Moderately blocky and
seamy
75 - 85
0.25B
~ 0.20(B+Ht)
No side pressure.
5. Very blocky and seamy
30 - 75
0.20
~ 0.20(B+Ht)
Little or no side pressure.
6.
Completely crushed and chemically intact
3 - 30
0.60
~ 1.10(B+Ht)
Considerable side pressure.
Softening effects of seepage towards
requires either.
7. Squeezing rock, moderate depth NA
1.10
~ 2.10(B+Ht)
Heavy side pressure.
Invert struts required.
Circular ribs are recommended.
8. Squeezing rock, great depth NA
2.10
~ 4.50(B+Ht)
9. Swelling rock NA Up
~ 75m irrespective of (B+Ht)
Circular ride are required.
In extreme cases use ielding support.
rock mass is dug. Rock load is calculated by the Terzaghi's rock classification method(see Table 2 and Fig.
7.[4] The classification is based on two conditions: first, only the vertical load is considered, and second, vertical load and horizontal load are considered at the same time.
In this study, the tunnel support load is the Terzaghi's rock load, which was modified by Rose. The underground rock consisted of crush sandstone and mantle underground rock mass in this coal mine shale.[5-7] Therefore, this rock was classified as 5 or 6 grade rock according to the rock condition. Table 3 shows the tunnel support load by the Terzaghi's rock load. Specific weight of rock(g), tunnel height(Ht) and tunnel width(B) are 26.46 kN/m3, 3.8m and 2.8m respectively.
[Fig. 6] Flow chart of optimization
[Table 2] Rock classification of Terzaghi modified by Rose
B : Tunnel width, Ht : Tunnel height, Hp : Rock load, H > 1.5(B + H)
[Fig. 7] Schematic illustration of rock load by Terzaghi theory
[Table 3] Load conditions of tunnel support Rock condition Rock load
Hp(m) pv(Pa) ph(Pa) 5. Very blocky and
seamy 2.31 61122.6 -
6. Completely crushed
and chemically intact 7.26 192099.6 68743.1 Hp : Rock load, pv: Vertical load, ph : Horizontal load
FEA for tunnel support was performed under the load conditions in Table 3. In the case of rock condition 5, the maximum stress(163 MPa) in tunnel support occurred at yielding strength(370 MPa). Therefore, rock condition 5 did not lead to a safety problem. In the case of rock condition 6, the maximum stress (345 MPa) in the tunnel
support occurred at yielding strength(370 MPa). Therefore, rock condition 6 did not lead to a safety problem, but the maximum stress approached the yielding strength. If the loading conditions had deteriorated much more due to uncertain factors, the stability of the tunnel support would not have been secured. It is thought that the bending failure for a tunnel support is due to the increase of horizontal load by the loosing of the rock mass.
3.2.2 Regression equation by DOE (Face centered central composite) The tunnel support stress due to discrete horizontal load is determined by each FEA. But, this method is not suitable to the problem that requires a lot of analyses because FEA is time consuming. Therefore, to shorten the analysis time, the regression equations for response factors should be considered.
The constant vertical load is assumed with respect to the shape of the bending failure in a tunnel support. The load is defined by rock condition 6 in Table 3. The level of horizontal load is 4427.06 N, 16621 N and 28814.94 N. Fig. 8 shows the loading positions in the tunnel support. Each load acts on the tunnel surfaces are as followings.
= -664.437872-0.002909A+0.01091B +0.022556C+0.015812D+0.005788E -0.0000001AD-0.0000001BE-0.0000002CD (1)
= -8.30787-0.000012A+0.000077B+0.00027C+0.00026D+0.000087E (2)
The determination coefficient R2 and adjusted determination coefficient R2adj of the regression equation for maximum stress are support wedge. Table 4 shows the orthogonal array matrix. This matrix is used to obtain the regression equations for maximum stress and maximum displacement. Their response 98.6 and 98.0, respectively, in eq. (1). The determination coefficient R2 and adjusted determination coefficient R2adj of the regression equation for maximum displacement are 97.9 and 97.4, respectively, in eq. (2).
[Table 4] Experiment design and results for tunnel support
Exp.
No.
Factors Responses
A B C D E σmax
(MPa) δmax
(mm) 1 4427.1 4427.1 4427.1 4427.1 28814.9 -301.034 -3.37 2 28814.9 4427.1 4427.1 4427.1 4427.1 -454.503 -5.39 3 4427.1 28814.9 4427.1 4427.1 4427.1 -191.204 -3.33 4 28814.9 28814.9 4427.1 4427.1 28814.9 -206.681 -1.67 5 4427.1 4427.1 28814.9 4427.1 4427.1 95.2 1.35 6 28814.9 4427.1 28814.9 4427.1 28814.9 137 2.85 7 4427.1 28814.9 28814.9 4427.1 28814.9 394.189 4.91 8 28814.9 28814.9 28814.9 4427.1 4427.1 295.669 2.89 9 4427.1 4427.1 4427.1 28814.9 4427.1 -106 -2.13 10 28814.9 4427.1 4427.1 28814.9 28814.9 121 3.84 11 4427.1 28814.9 4427.1 28814.9 28814.9 275.274 4.67 12 28814.9 28814.9 4427.1 28814.9 4427.1 176.754 2.76 13 4427.1 4427.1 28814.9 28814.9 28814.9 442.9 9.18 14 28814.9 4427.1 28814.9 28814.9 4427.1 344.379 7.17 15 4427.1 28814.9 28814.9 28814.9 4427.1 598.88 9.22 16 28814.9 28814.9 28814.9 28814.9 28814.9 643.368 10.9 17 4427.1 16621 16621 16621 16621 185.237 2.93 18 28814.9 16621 16621 16621 16621 158.221 2.75 19 16621 4427.1 16621 16621 16621 50 2.18 20 16621 28814.9 16621 16621 16621 285.471 3.78 21 16621 16621 4427.1 16621 16621 -156.858 -0.886 22 16621 16621 28814.9 16621 16621 369.284 6.04 23 16621 16621 16621 4427.1 16621 -106.481 -0.385 24 16621 16621 16621 28814.9 16621 309.827 5.92 25 16621 16621 16621 16621 4427.1 135.977 1.92 26 16621 16621 16621 16621 28814.9 207.481 3.76 27 16621 16621 16621 16621 16621 171.729 2.84
G I B e a m
W e d g e A
B
C
D
E v
h
v : vertical load h : horizontal load [Fig. 8] Schematic illustration for factor
3.3 Applied load by regression equation and desirability function
The upward bending failure of the tunnel support is directly related with the horizontal load in each wedge.
The bending failure of the tunnel support can be defined as a problem to determine horizontal load size in each wedge. Therefore, this failure is an optimization problem, in which a horizontal load is considered by a variable. In these optimization problems, the maximum
displacement is defined as the objective function.
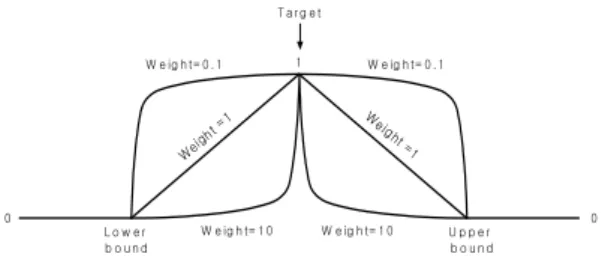
Therefore, the loading condition that results in the maximum displacement should be found. Response optimization is achieved by the commercial statistical software, MINITAB R13. Desirability function represents the satisfaction of each response. That is, a desirability function represents how each response satisfies the objective function. Fig. 9 shows the minimization of the desirability function. If the response approaches the objective function or target value, the desirability function will approach 1. If response moves away from the objective function or target value, the desirability function will approach 0.[8]
The response optimization procedure in MINITAB R13 is as follows. First, each desirability function is calculated by each function objective. Second, a composite desirability function is determined by combining each desirability function. Third, an optimized variable is obtained by the composite desirability function. A composite desirability function by response optimization is the weighted geometric average of the desirability functions.[9]
[Fig. 9] Desirability function for minimization of response
Fig.10 shows the desirability function in response optimization. Objective function has a target value in this figure. Weight value ranges from 0 to 10. If the importance of the function objective is equal, each weight value is set to 1.
Displacement can be measured in actual bending failure. This displacement is determined by an optimization algorithm in the prediction of the horizontal load. Fig. 11 shows a bending failure accident. Vertical displacement is 9.3mm in this figure.
Therefore, the optimization formulation for the tunnel support of Fig. 8 is defined as follows :
Find A, B, C, D, E
Target Maximum displacement = 9.3mm subject to
4427.1N ≤ A,B,C,D,E ≤ 28814.9N
Fig . 12 and Tables 5 show the optimization results by MINITAB R13. Fig.13 shows the FEA results for the optimization result in Table 5. There is no difference between the analytical bending displacement in Fig. 13 and the actual bending displacement in Fig. 11.
Weig ht =1 Weight =1
W e ig h t= 0 . 1
W e ig h t= 1 0 W e ig h t= 1 0 T a r g e t
1
0 0
W e ig h t= 0 . 1
L o w e r b o u n d
U p p e r b o u n d
[Fig. 10] Schematic illustration of desirability function for target value
2900.0 2909.3
2900.0 2909.3
[Fig. 11] Dimension of bending point
[Fig. 12] Optimization results of tunnel support using MINITAB
[Table 5] Analysis results of boundary conditions for bending shape of tunnel support
Factors Responses
Remark A
(N) B (N)
C (N)
D (N)
E (N)
σmax
(MPa) δmax
(mm) 16580.
72 17841.
09 25434.
82 28814.
93 28814.
94
507.65 9.3 Regression 499.8 9.24 FEA
Therefore, the horizontal load that caused the actual bending displacement in the wedge of the tunnel support is assumed as follows.
A = 16580.72N, B = 17841.09N, C = 25434.82N, D
= 28814.93N, E = 28814.94N
Also, the maximum stress that brought out the maximum bending displacement was 499.8 MPa. The tunnel support had the unstable boundary condition because maximum bending stress in the tunnel support exceeded yield strength (370 MPa). The bending failure in tunnel support occurred by a horizontal load of 117486.50N. Therefore, the horizontal load in the tunnel support should be reconsidered by using the failure load according to the rock condition.
(a) Maximum stress (
= 499.8 MPa)(b) Maximum displacement (
=9.24mm) [Fig. 13] FEA Results of tunnel support4. Conclusions
The bending failure in a tunnel support was examined closely by DOE and an optimization algorithm. The conclusions obtained in this study are as follows.
1. Maximum bending stress and horizontal load were considered by an objective function and variables in the optimization process for the bending failure load.
2. The horizontal load that caused the actual bending displacement in the wedge of the tunnel support was assumed as follows.
A=16580.72N, B=17841.09N, C=25434.82N, D=28814.93N, E=28814.94N
(The upward bending failure load obtained by DOE and the optimization algorithm was 117486.50N in the tunnel support.)
3. A complex loading condition problem, such as the tunnel support failure, can be analyzed by DOE and the optimization algorithm.
References
[1] XX Coal Mine Co., "Maintenance of Tunnel Support", 2001.
[2] C. S. Yoo, et al., "An Exerimental Study on Load Bearing Capacity of Lattice Girder as a Steel Support in Tunnelling", Korean Geo- technical Society, Vol. 13, No. 8, pp. 163-175, 1997.
[3] Dassault system Inc., "CATIA Generative Structure Analysis", CATIA V5R14.
[4] Terzaghi K., "Rock Defects and Loads on Tunnel Supports in Rock Tunneling with Steel Support", R. V.
proctor and T. white Eds, Commercial Shearing and Stamping Co., Youngstown, pp. 15-99, 1946.
[5] J. W. Kim, et al., "Numerical Analysis of Tunnel Stability for Excavation near Coal Mine", Proceedings of the KSRM 2002 Spring Annual Meeting, pp. 27-36, 2002.
[6] Y. I. Kim, et al., "A Case Study on Construction of Long Tunnel in the Youngdong Railroad (Mt. Dongbaek - Dokye)", Proceedings of the KSRM 2002 Fall Annual Meeting, pp. 16-30, 2002.
[7] T. N. Lee, et al., "The Case Study on Application of
SWELLEX & SWELLEX Cable Bolt to Support Drifts in Soft Rock of the Coal Mine", Korea Society for Rock Mechanics, Vol.3, pp. 1-10, 1993.
[8] Minitab Inc., "MINITAB Response Optimizer", Minitab R13.
[9] Eretec Inc., “MINITAB Practical Affairs”, Eretec, pp.
16-27, 2000.
Dong-Woo Lee
[Regular member]• Feb. 1995 : Dong-A Univ., Mechanical Eng., BE
• Feb. 1997 : Dong-A Univ., Mechanical Eng., MS
• Aug. 2003 : Dong-A Univ., Mechanical Eng. Ph.D.
• Sep. 2011 ~ current : Changwon Moonsung Univ., Dept. of Automobile, Professor
<Research Interests>
Fracture, Fatigue, Optimal Design
Seok-Swoo Cho
[Regular member]• Feb. 1991 : Dong-A Univ., Mechanical Eng., BE
• Feb. 1993 : Dong-A Univ., Mechanical Eng., MS
• Feb. 1997 : Dong-A Univ., Mechanical Eng. Ph.D.
• Sep. 1997 ~ current : Kagnwon National Univ., Dept. of Vehicle, Professor
<Research Interests>
Fracture, Fatigue, Optimal Design