1. Introduction
High-carbon high-chromium martensitic stainless steels (MSS) such as AISI 440C are being used in the aerospace industry for bearing applications owing to its high hard- ness; good wear resistance and dimensional stability1-4). Although the chromium content is equal to SS304, the lack of corrosion resistance and passivity in this steel is due to the presence of high carbon which forms carbides such as M23C6 and M7C35)
. Hence the corrosion resistance of this steel depends on the size and distribution of carbide phases as well as retained austenite content present in the steel after hardening and tempering treatments. Kwok et al.6), utilized laser surface melting (LSM) and found sig- nificant improvement in the corrosion resistance with in- creased pitting potential (Epit). They have attributed this due to the refined carbide particle size and retained austen- ite due to laser surface melting. Plasma nitriding on steel similar to AISI 440C although showed good improvement in hardness and wear resistance, the corrosion resistance
was found to be poor due to the presence of carbide and nitride phases which formed even after using low temper- ature nitriding process7). Nitrogen addition is known to impart good corrosion resistance in the case of austenitic stainless steels8). However, its effect on martensitic steels is not clear and not widely studied. Limited results on nitrogen addition (0.6%) using pressurized melting fur- nace reported good improvement in corrosion resistance of martensitic steels as compared to conventional marten- sitic steels. According to them, the improvement in corro- sion resistance was due to nano-sized N-enriched regions as revealed by small angle neutron and x-ray scattering techniques9). Earlier, one of the authors reported 0.17 wt%
nitrogen addition along with reduction in carbon content significantly improved the microstructure of the steel re- sulting in good hardness and mechanical properties10). However, the influence of nitrogen on the corrosion resist- ance was not studied and reported. Hence the aim of the present investigation is to examine the corrosion behavior of nitrogen containing martensitic steel using potentiody- namic polarization and impedance test methods. In addi- tion, the mechanical properties such as hardness and wear
Corrosion and Nanomechanical Behaviors of 16.3Cr-0.22N-0.43C-1.73Mo Martensitic Stainless Steel
Rahul Ghosh†, S. Chenna Krishna, A. Venugopal, P. Ramesh Narayanan, Abhay K. Jha, P. Ramkumar, and P. V. Venkitakrishnan
Materials and Mechanical Entity, Vikram Sarabhai Space Centre (ISRO), Trivandrum-695022, Kerala, India (Received November 25, 2016; Revised November 25, 2016; Accepted December 15, 2016)
The effect of nitrogen on the electrochemical corrosion and nanomechanical behaviors of martensitic stainless steel was examined using potentiodynamic polarization and nanoindentation test methods. The results indicate that partial replacement of carbon with nitrogen effectively improved the passivation and pitting corrosion resistance of conventional high-carbon and high- chromium martensitic steels. Post-test observation of the samples after a potentiodynamic test revealed a severe pitting attacks in conventional martensitic steel compared with nitrogen- containing martensitic stainless steel. This was shown to be due to (i) microstructural refinement results in retaining a high-chromium content in the matrix, and (ii) the presence of reversed austenite formed during the tempering process. Since nitrogen addition also resulted in the formation of a Cr2N phase as a process of secondary hardening, the hardness of the nitrogen- containing steel is slightly higher than the conventional martensitic stainless steel under tempered conditions, even though the carbon content is lowered. The added nitrogen also improved the wear resistance of the steel as the critical load (Lc2) is less, along with a lower scratch friction coefficient (SFC) when compared to conventional martensitic stainless steel such as AISI 440C.
Keywords : martensitic stainless steel, potentiodynamic polarization, impedance spectroscopy, pitting corrosion, nanomechanical
†Corresponding author: [email protected]
resistance of the steel was evaluated using nanoindentation and scratch tests and compared with that of conventional AISI 440C steel.
2. Experimental 2.1 Materials
For the present study, nitrogen substituted martensitic stainless steel (NMSS) and conventional martensitic stain- less steel (MSS) were used in the form of hot rolled plates of 6 mm thickness. They were hardened, cryo treated and tempered at 500 °C and will be referred as NMSS-T and MSS-T respectively throughout the text. The chemical composition the alloys are presented in Table 1. Hardening was performed at 1050 °C for 0.5 h and air cooled. Cryo treatment was performed using a cryo chamber at -80 °C for holding time of 2 h and warmed in the same chamber to reach ambient temperature followed by tempering at 500 °C for 2 h.
2.2 Microstructure and phase analysis
For microstructural observations, the samples were sec- tioned and polished down to 1 µm diamond finish fol- lowed by etching in freshly prepared Vilella’s reagent and were examined under an Olympus GS 71 optical micro- scope (Olympus America, Center Valley, PA) and a Carl Zeiss EVO-50 scanning electron microscope (SEM; Carl Zeiss, Oberkochen, Germany) with an EDS attachment.
X-ray diffraction (XRD) analysis of the samples was car- ried out on a PANalytical model X-ray diffractometer, with Cu Kα radiation. Continuous mode with a scan rate of 2 deg/min and 2θ ranging from 40 to 90 deg was ap- plied to analyze the crystalline phases of each specimen.
2.3 Nanoindentation tests
Elastic modulus (E) and hardness (H) of the steels was obtained by nanoindentation tests in which a Berkovich diamond indenter with a tip radius of 100 nm was mount- ed in order to carry out the indentations on the polished surface of the steel samples. A Nanoindenter supplied by CSM instruments with a resolution of 50 nN in force and 0.01 nm in displacement was used. The loading and un- loading time of 30 s, with 10 s hold at maximum load (20 mN) was adopted. For each depth levels, 10 micro-in-
dents were made and the hardness and reduced modulus values were extracted from the load-displacement curves using the Oliver and Pharr analysis11). Prior to making the tests on the samples, a calibration procedure was car- ried out on a commercial silica block provided by the supplier in which at least 10 indentations were made using the same Berkovich diamond indenter and the obtained elastic modulus (E) was compared with the nominal elastic modulus of silica.
2.4 Scratch tests
The scratch tests were performed at room temperature using a micro scratch tester (CSM Instruments) containing optical microscope, a tangential friction force and a pene- tration depth sensor. In this test, the load on a diamond Rockwell indenter with a tip radius of 100 µm was linearly increased from 0.1 N to 25 N with a scratch length of 2 mm and with a constant speed of 1 mm/min. The scratch tests were carried out in three steps. First, a “pre-scan was performed with same direction at a very low load (0.1 N) to determine the profile of the samples. Secondly, the “true” scratch test was performed. Finally, a “post scan” was performed to determine the residual depth after elastic recovery. For each scratch test, the indenter dis- placement, the applied normal force (Fn), the frictional force (Ft), the penetration depth (Pd), the residual pene- tration depth (Rd) and the specimen profile were obtained to determine the critical loads (Lc1 and Lc2) and the scratch friction coefficient (SFC). The critical loads corre- spond to cohesive or plastic deformation of the material.
Tests were repeated for three times for reproducibility.
2.5 Electrochemical corrosion tests
The electrochemical corrosion (potentiodynamic and electrochemical impedance spectroscopy) of the alloy in different heat treated conditions was evaluated using a computer-controlled Zhaner IM6ex make electrochemical workstation. Samples were taken from the heat treated plates to make specimens of 0.5 cm2 area. The samples were then ground with SiC papers up to 1000 grit followed by cleaning in acetone and water. The corrosion behaviour of the samples was examined in neutral 3.5% NaCl sol- ution prepared using reagent-grade NaCl salt and de- ionised water. The tests were carried out using a standard three-electrode setup with platinum as the counter elec- Table 1. Chemical composition (wt%) of NMSS and MSS
Alloy C Cr N Mo Mn Si Ni Nb Fe
NMSS-T 0.43 16.32 0.22 1.73 0.20 0.21 0.20 0.14 Balance
MSS-T 1.00 16.80 - 0.75 0.52 0.33 - - Balance
Fig. 1. Optical micrographs of NMSS-T (a) and MSS-T (b) showing the morphology of primary eutectic carbides (denoted by black arrows).
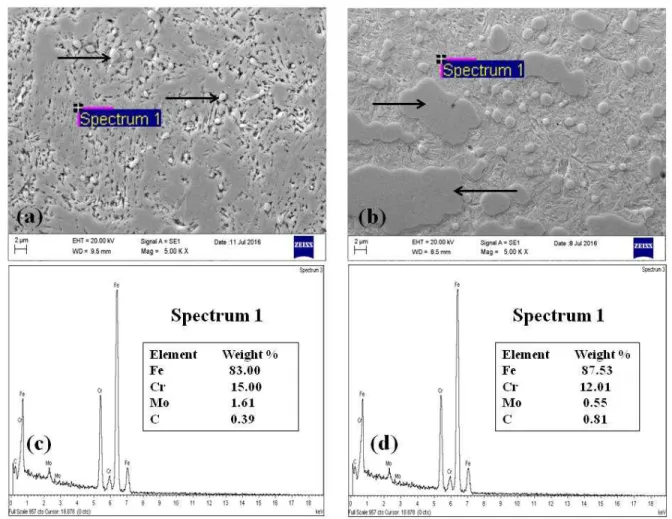
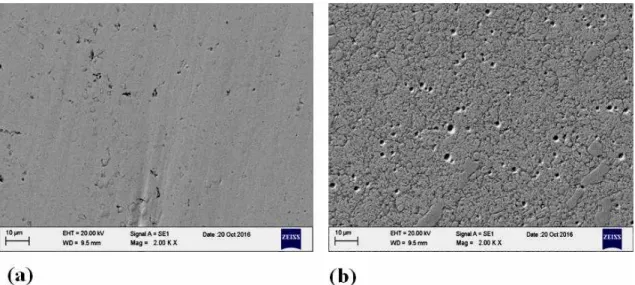
Fig. 2. SEM micrographs of (a) NMSS-T, (b) MSS-T and EDS results corresponding to the matrix composition of NMSS-T (c) and MSS-T (d) (Black arrows denote the size and morphology of the primary eutectic carbides).
trode, saturated calomel electrode (SCE) as a reference, and the test specimen as working electrode. A scan rate of 0.5 mV/s was used for potentiodynamic polarization test. All the scans were started from a potential 300 mV below the corrosion potential (Ecorr). After potentiody- namic test, the specimen surfaces were cleaned under run- ning water and finally dried with stream of cold air. The surface morphology of the specimens was analyzed using optical profilometry (NANOVEA, USA). With the assis- tance of 3D-Mountain software package, the parameters such as pit depth and pit density were compared between the two alloys. Impedance measurements were carried out in the frequency range of 10−2 - 105 Hz with an amplitude
±10 mV.
3. Results and Discussion 3.1 Microstructure and Phase Analysis
The optical micrographs of NMSS-T and MSS-T sam- ples shown in Fig. 1 revealed typical tempered martensitic structure with primary eutectic carbides (indicated by ar- rows). The carbides are found to be much finer and small in number in the case of NMSS-T (Fig. 1a) when com- pared to MSS-T (Fig. 1b). The size of the carbide particles are in the range of 1-2 µm for NMSS-T steel as compared to 8-10 µm for MSS-T steel as seen from the SEM micro- graphs (Fig. 2a and Fig. 2b). The elemental analysis (SEM-EDS) performed on the carbide particles confirms that they are chromium rich carbides (not shown here).
Further the matrix chromium content of MSS-T was ana- lyzed to be 12.01 wt% when compared to 15.0 wt% of NMSS-T steel (Fig. 2c and Fig. 2d). The loss in matrix chromium content in the case of MSS-T can be attributed due to the formation of numerous chromium carbides as
seen in the microstructure (Fig. 1).
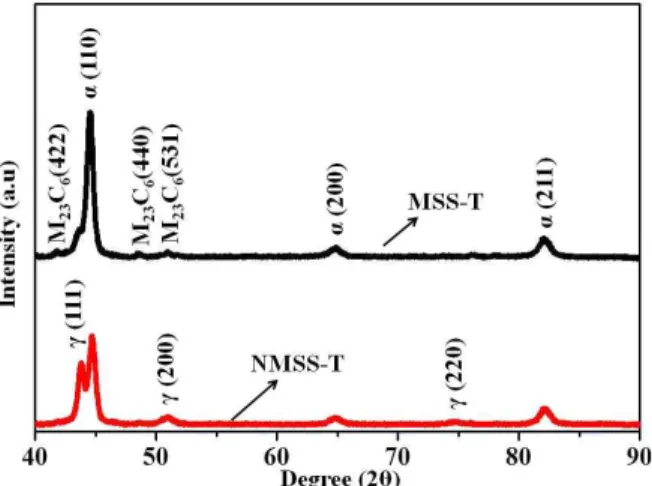
X-ray diffraction patterns obtained for NMSS-T and MSS-T steels are presented in Fig. 3. Analysis of XRD patterns revealed predominant peaks of α-Fe (martensite) and M23C6 (Cr-rich carbides) typical of tempered marten- sitic steel. It can be noted that in addition to the above phases γ-Fe peaks are detected for NMSS-T. This could be primarily due to austenite reversion aided by the nitro- gen present in this steel which is known to be an austenite stabilizer and causes depression of the martensite start (Ms) temperature12). It is also possible due to the presence of 0.2 wt% Ni in this alloy as Ni also causes austenite reversion by diffusing to martensite lath boundaries favor- ing nucleation and grown of reversed austenite13). The ab- sence of γ-Fe peaks in the MSS-T could be due to the lower volume fraction of reversed austenite. Similar ob- servations were made and reported on other martensitic steels without nitrogen as an alloying element14). 3.2 Nanomechanical properties
Typical load-displacement curves for NMSS-T and MSS-T obtained from depth sensing indentation measure- ments are shown in the Fig. 4. It can be seen that the elastic recovery of the NMSS-T sample is comparatively higher than the MSS-T as indicated by the shift in the indentation depth after the test. The hardness was calcu- lated from the load and indentation depth data, and the modulus was determined from the unloading response us- ing the standard Oliver and Pharr technique11). The in- dentation hardness and elastic modulus of NMSS-T were determined as 12.8 ±0.3 GPa and 270 ± 15 GPa respectively. Similar values obtained for MSS-T were 10.6 GPa and 269 GPa. Although the elastic modulus of the steels are comparable, indentation hardness is better for
Fig. 3. XRD pattern of NMSS-T and MSS-T steels.
0 50 100 150 200 250 300 350 400 0
5 10 15 20 25
MSS-T NMSS-T
In d en ta ti o n L o a d ( m N )
Indentation Depth (Nm)
Fig. 4. Typical load-depth data obtained during indentation tests on NMSS-T and MSS-T.
NMSS-T (12.8 GPa) than that of MSS-T (10.6 GPa) even though the former had austenite content (Fig. 3) which is expected to decrease the hardness. This can be attributed to the refined carbide structure and also secondary harden- ing due to the precipitation of Cr2N and Mo2C at the tem- pering temperature of 500°C, as reported by one of the authors10). The nano-mechnical properties in general in- dicate that addition of 0.22 wt% N improved the in- dentation hardness of conventional MSS steel after tem- pering treatment at 500 °C.
3.3 Scratch tests
In order to further determine the wear resistance of the alloys, a normal force is imposed on a scratch tip to indent the material and is allowed to slide on its surface at a given velocity. The optical image of the scratch and the scratch test results such as frictional force, penetration depth and residual depth, for NMSS-T and MSS-T, are shown in Fig. 5. The critical loads Lc1 and Lc2 were calculated from the scratch according to ASTM C1624.
The lower critical load (Lc1) is the point where the plastic deformation occurs and the residual plastic groove in- creases as the progressive load increases. The similar Lc1 values for both the alloys indicate that the elastic to plastic transition occurs at the same normal load. The second crit- ical load (Lc2) is the parameter which will show the wear behavior of the alloys. Lc2 is determined at the inflexion point of the variation in penetration depth with load as shown in Fig. 5a and Fig. 5b. It is understood that Lc2 values increase with decrease in hardness since it is capa- ble of absorbing much larger quantities of energy before failure. Lc2 value for NMSS-T is lower (12 N) than the MSS-T (17.5 N), indicating higher hardness for the former than the later. The Lc2 values for the alloys are in line with the nanomechanical properties as shown in Fig. 4.
Close observation of the scratch track in Fig. 5a and Fig.
5b reveals materials removal and micro-cracks extending laterally from the edges of the scratch, indicating chipping occurred during the scratch test for the alloys. Dalmau et al.15), reported similar behavior of the scratch track for other martensitic stainless steels.
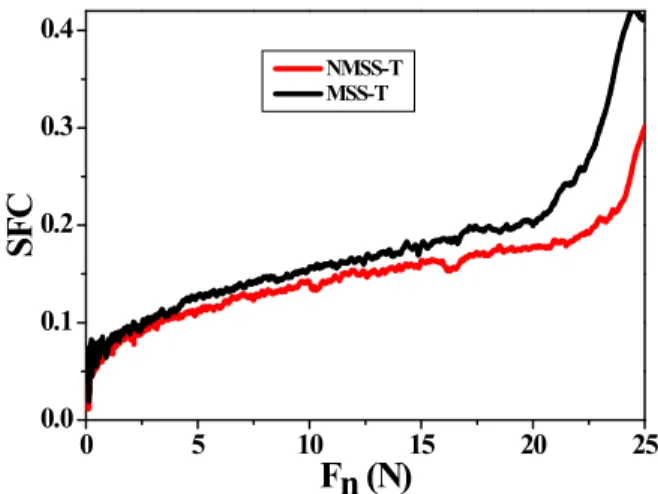
The scratch friction coefficient (SFC) was also calcu- lated by dividing the tangential force (Ft) by the applied normal force (Fn), which allowed to compare the scratch resistance of the alloys. Fig. 6 shows the variation of SFC as a function applied normal force for the alloys. In gen- eral lower SFC contributes to higher scratch resistance16). The SFC increases with the load for NMSS-T and MSS-T due to the resistance which the material opposes while the tip moves. Both the alloys show three zones in Fig.
6: (i) a sudden increase in SFC at the start of the test to around 1 N, (ii) a slow increase until 20 N and (iii) a fast increase after 20 N due to materials failure with increase in applied load. However, the SFC for NMSS-T Fig. 5. Optical micrograph and measured scratch performance of
NMSS-T (a) and MSS-T (b) indicating critical loads.
0 5 10 15 20 25
0.0 0.1 0.2 0.3 0.4
NMSS-T MSS-T
S F C
Fn (N)
Fig. 6. Scratch friction coefficients (SFC) as a function of the applied normal force (Fn) for NMSS-T and MSS-T.
is lower than MSS-T throughout the scratch test as shown in Fig. 6, indicating higher scratch resistance for NMSS-T17).
3.4 Potentiodynamic Polarization
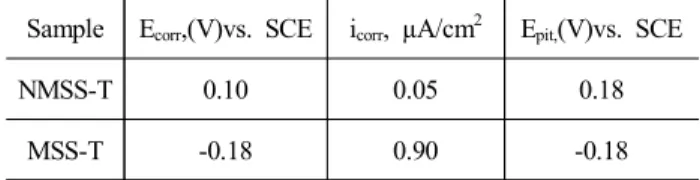
The potentiodynamic polarization plots obtained for NMSS-T and MSS-T steels in 3.5% NaCl are presented in Fig. 7. The electrochemical parameters such as corro- sion potential (Ecorr), corrosion current density (icorr) and pitting potential (Epit) obtained from the polarization plots are shown in Table 2. An examination of the polarization plots indicates that NMSS-T exhibited passive behavior and its absence in the case of MSS-T. The absence of passivity in the case of MSS-T is due to the precipitation of chromium carbides as seen in the microstructure (Fig.
1 and Fig. 2). As a result of this, the icorr value is high (0.90 µA/cm2) for MSS-T when compared to NMSS-T (0.05 µA/cm2). The pitting potential (Epit) also found to be higher (0.18V) than that of MSS-T (-0.18V) Since the carbide phases are more and coarse in the case of MSS-T, the intensity of corrosion is more for MSS-T.
The surface morphologies of samples observed after po- tentiodynamic tests are displayed in Fig. 8. It can be seen that the surface is passive with less number of pits in the case of NMSS-T when compared to MSS-T sample.
Since carbide phases are much less in NMSS-T, the steel exhibits passivity and the observed icorr was less as seen from the polarization results. Since MSS-T had more car- bide phases, it underwent active dissolution with higher icorr value and suffered severe pitting attack (Fig. 8b). The representative 3D images (Fig. 9) observed using non-con- tact optical profilometer further indicate that the pit depth and density was much higher for MSS-T than NMSS-T.
The maximum pit depth for NMSS-T and MSS-T is 8 µm (Fig. 9a) and 52 µm (Fig. 9b), respectively. This shows that the pitting corrosion resistance of NMSS-T is better than MSS-T. This in general implies that the add- ed nitrogen (0.22 wt%) influences the passiviation behav- ior of the alloy significantly.
3.5 Impedance Spectroscopy
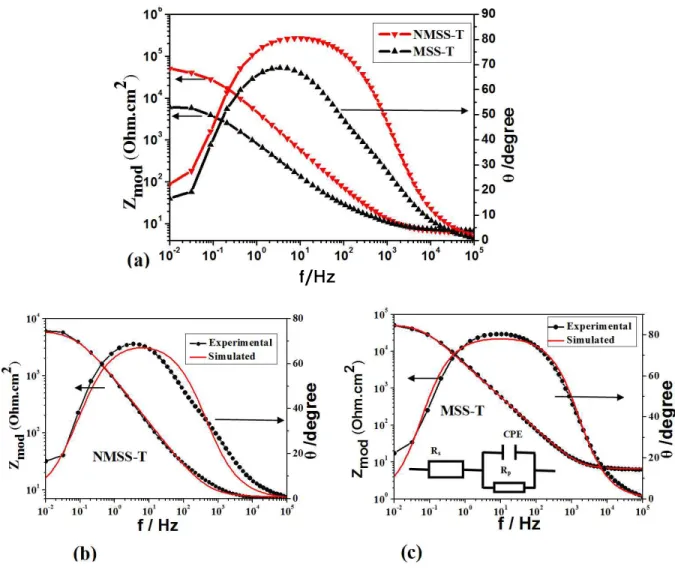
In order to further understand the passivation behavior of the steel in the different heat treated conditions, im- pedance spectroscopy was performed at open circuit po- tential (OCP). The impedance curves obtained for the steels after an immersion time of 1 hr in 3.5% NaCl are presented in Fig. 10 in the form of Bode representation.
The Bode plots shown in Fig. 10a indicate that the im- pedance values of the steels as seen from the low fre- quency end of the spectra are higher for the NMSS-T than for MSS-T. This demonstrate that the added nitrogen (0.22 wt%) improved the corrosion resistance of the alloy steel (NMSS-T). These results are in line with the po- tentiodynamic polarization results shown earlier. The ob- served phase angle maxima are significantly high for the nitrogen containing steel than the steel without nitrogen.
The impedance results are further interpreted by fitting the EIS data with valid equivalent circuits. In this work, a single R-C element based on El-Egamay and Badaway's work18) was used (Fig. 10b and Fig. 10c). The fitting re- sults obtained from the impedance plots within the limits of experimental error (less than 5%) are summarized in Table 3. The equivalent circuit model consists of the sol- ution resistance (Rs) connected in series with single time constant (CPE/Rp), where CPE is the capacitance of the passive film and Rp is the polarization resistance. An ex- amination of the Table 3 shows that the nitrogen contain- ing steel (NMSS-T) exhibits higher impedance value (53.26 KΩ.cm2) than the steel (MSS-T) without nitrogen Fig. 7. Potentiodynamic polarization curves for NMSS-T and
MSS-T in 3.5% NaCl solution.
Table 2. Fitting results obtained from potentiodynamic polarization curves
Sample Ecorr,(V)vs. SCE icorr, µA/cm2 Epit,(V)vs. SCE
NMSS-T 0.10 0.05 0.18
MSS-T -0.18 0.90 -0.18
Table 3. Fitting results obtained from EIS measurements Sample Rs,Ωcm2 CPE (µF ) n RP,KΩcm2
MSS-T 7.57 39.51 0.78 6.25
NMSS-T 6.59 15.78 0.88 53.26
(6.25 KΩ.cm2). This shows that the passive film formed on NMSS-T is stronger and more corrosion resistant than that of MSS-T. This can be attributed due to the higher matrix chromium content of the former than the later.
The above results indicates that partial replacement of carbon with nitrogen (0.22 wt%) to the conventional MSS could improve the corrosion resistance of the alloy after tempering at 500 oC. The higher Epit value obtained for the alloy NMSS-T than that of MSS-T clearly demon- strates that the pitting corrosion resistance greatly im- proved by the added nitrogen. The reduction in carbon content reduced the carbide phases in the alloy matrix and the presence of nitrogen favours the formation of reversed austenite during tempering treatment. As a result of the above changes, the alloy exhibits good passivation and corrosion resistance. The loss of passivity and increased
icorr value of MSS-T is due to numerous carbide phases which reduced the matrix chromium content. The above results are in agreement with other published data on aus- tenitic steels containing nitrogen as an alloying element8), where the pitting resistance equivalent (PRE= % Cr + 3.3
% Mo + 16x % N) gives an indication of the relative effectiveness of the elements. Moreover, the presence of reversed austenite (as seen in XRD patterns) for NMSS-T is also beneficial to the pitting resistance of the alloy.
It is reported that the presence of reversed austenite re- duces the extent of Cr depletion and increases the stability of the passive film6,19), and therefore NMSS-T exhibits better pitting resistance than MSS-T. A question can be raised on what causes the improved hardness of NMSS-T even after decreasing the carbon content of the steel. It is due to the secondary hardening aided by nitrogen addi- Fig. 8. Pitting morphologies of NMSS-T (a) and MSS-T (b) after potentiodynamic tests.
Fig. 9. 3D optical profilometer images of NMSS-T (a) and MSS-T (b) showing the pit depth and pit density.
tion which forms Cr2N and Mo2C as has been reported by one of the authors earlier through TEM inves- tigations10). The lower SFC and higher Lc2 values of NMSS-T further indicate higher scratch resistance when compared to MSS-T.
4. Conclusions
AISI 440C is a high carbon high chromium martensitic steel widely used for bearing applications. This work ex- amined the effect of partial replacement of carbon with nitrogen and their effect on the corrosion and nano- mechanical behaviors of conventional AISI 440C steel.
The significant findings are given below:
(1) 0.22 % nitrogen addition along with reduction in carbon content effectively improved the passivation and corrosion resistance of martensitic steel. This was shown to be due to the microstructural refine- ment in which the high chromium content of the matrix of NMSS-T is retained along with the pres- ence of reversed austenite formed during tempering at 500 ºC.
(2) Post test observation of the steel after potentiody- namic test revealed severe pitting corrosion attack of the conventional AISI 440C steel with greater depth of attack and their absence in the case of ni- trogen containing martensitic stainless steel.
f/Hz
Fig. 10. Typical Bode impedance plots obtained for the experimental steels (a); Impedance Vs. Frequency and Phase angle Vs. Frequency.
10b and 10c shows fit results of Bode plot for NMSS-T and MSS-T respectively, validating the adequacy of the model.
(3) The refined carbide phases and the formation of phases such as Cr2N and Mo2C during secondary hardening of nitrogen containing martensitic stain- less steel resulted in slightly higher hardness even though the carbon content is reduced.
(4) The lower Lc2 and lower friction coefficient (SFC) values obtained for NMSS-T during scratch test demonstrated that the hardness and wear resistance is better when compared to conventional MSS-T.
Acknowledgments
The authors express their sincere thanks to Director, VSSC for permitting to publish the paper.
References
1. H. K. D. H. Bhadeshia, Prog. Mater. Sci., 57, 268 (2012).
2. K. Clemons, C. Lorraine, G. Salgado, and J. Ogren, J.
Mater. Eng. Perform., 16, 515 (2007).
3. X. P. Ma, L. J. Wang, C. M. Liu, and S. V Subramanian, Mater. Sci. Eng. A, 539, 271 (2012).
4. D. Thibault, P. Bocher, and M. Thomas, J. Mater. Process.
Tech., 209, 2195 (2009).
5. G. Frankel, J. Electrochem. Soc., 145, 2186 (1998).
6. C. T. Kwok, K. H. Lo, F. T. Cheng, and H. C. Man, Surf. Coat. Tech., 166, 221 (2003).
7. C. X. Li and T. Bell, Corros. Sci., 48, 2036 (2006).
8. H. Baba, T. Kodama, and Y. Katada, Corros. Sci., 44, 2393 (2002).
9. M. Ojima, M. Ohnuma, J. Suzuki, S. Ueta, S. Narita, T.
Shimizu, and Y. Tomota, Scripta Mater., 59, 313 (2008).
10. S. C. Krishna, N. K. Gangwar, A. K. Jha, B. Pant, and K. M. George, J. Mater. Eng. Perform., 24, 1656 (2015).
11. W. C. Oliver and G. M. Pharr, J. Mater. Res., 24, 1564 (1992).
12. L. D. Barlow and M. Du Toit, J. Mater. Eng. Perform., 21, 1327 (2012).
13. W. Jiang, D. Ye, J. Li, J. Su, and K. Zhao, Steel Res.
Int., 85, 1150 (2013).
14. S. Krishna, N. K. Gangwar, A. K. Jha, B. Pant, and K.
M. George, Steel Res. Int., 86, 51 (2015).
15. A. Dalmau, W. Rmili, D. Joly, C. Richard, and A.
Igual-Munoz, Tribol. Lett., 56, 517 (2014).
16. W.-J. Choi, J. H. Lee, and J.-I. Weon, Tribol. Int., 67, 90 (2013).
17. B. D. Beake and T. W. Liskiewicz, Tribol. Int., 63, 123 (2013).
18. S. S. El-egamy and W. A. Badaway, J. Appl. Electrochem., 34, 1153 (2004).
19. X. Lei, Y. Feng, J. Zhang, A. Fu, C. Yin, and D. D.
Macdonald, Electrochim. Acta, 191, 640 (2016).