Corresponding author: Hwang, Eunhee https://orcid.org/0000-0002-6229-5946
Department of Nursing, Wonkwang University, 460 Iksandae-ro, Iksan 54538, Korea.
Tel: +82-63-850-6071, Fax: +82-63-850-6060, E-mail: [email protected] Received: Jun 26, 2018 / Revised: Sep 17, 2018 / Accepted: Oct 9, 2018
This is an open access article distributed under the terms of the Creative Commons Attribution Non-Commercial License (http://creativecommons.org/licenses/
ORIGINAL ARTICLE Open Access
Factors Influencing Depressive Symptoms among Korean Older Adults with Chronic Illnesses: Using the 2014 National Survey on Older Adults
Shin, Sujin
1· Hwang, Eunhee
21Associate Professor, College of Nursing, Ewha Womans University, Seoul, Korea
2Professor, Department of Nursing, Wonkwang University, Iksan, Korea
Purpose: Geriatric depression is often closely connected with physical symptoms among older adults. This study aimed to determine the factors related to depressive symptoms among older adults with multiple chronic diseases.
Methods: We assessed 6,672 older adults using data extracted from the 2014 National Survey on the Elderly in Korea.
The short form of the Geriatric Depression Scale and the Korean versions of the Mini-Mental State Examination for dementia screening and the DETERMINE Your Nutrition Health Checklist were used. Statistical analyses included independent t-test, x2 test, and logistic regression analysis. Results: We found that 36.7% of the older adults exhibited depressive symptoms, and the average score on the short form of the Geriatric Depression Scale was 5.90±4.53. The factors significantly related to depressive symptoms were unemployment (Odds Ratio [OR]=1.85, 95% Confidence Interval [CI]=1.59~2.15), “high risk” nutritional management status (OR=1.19, 95% CI=1.16~1.22), slight visual dysfunction (OR=1.21, 95% CI=1.05~1.38), high visual dysfunction (OR=1.41, 95% CI=1.04~1.91), slight hearing dysfunction (OR=1.22, 95% CI=1.05~1.43), slight chewing dysfunction (OR=1.37, 95% CI=1.19~
1.59), high chewing dysfunction (OR=1.59, 95% CI=1.30~1.95), low cellphone utilization (OR=1.60, 95% CI=1.04~
2.46), older age (OR=0.99, 95% CI=0.98~1.00), and higher educational level (OR=0.96, 95% CI=0.95~0.98).
Conclusion: Preventive interventions for depressive symptoms should include nutritional education programs, functional assistive devices, and the use of information technology.
Key Words: Aging, Depression, Chronic disease, Cognition, Nutritional status
INTRODUCTION
In South Korea, the low birth rate is accelerating the ag- ing of society, which is accompanied by an increase in the prevalence of various physical, psychological, and social problems related to the aging process. Geriatric depres- sion is one of the most serious problems in South Korea [1].
Although existing studies have reported varying rates of the prevalence of geriatric depression in the country, a stu- dy investigating national panel data of aged individuals reported an overall prevalence rate of 19.9% among older adults aged 65 years or older. Broken down by sex, the rates were 16.2% among men and 23.5% among women [2].
Despite being so common, geriatric depression is often
underdiagnosed and undertreated [3]. Geriatric depres- sion can lead to an increase in medical costs, have an over- all negative effect on older adults’ quality of life, and lead to increased physical symptoms and mortality [4]. In other words, depression in older adults is a significant health problem, and not a normal part of aging. Therefore, de- pression in this population requires appropriate study and intervention.
Numerous studies have examined the factors influenc- ing both the symptoms and the physical, psychological, and economic outcomes of depression in older adults. The likelihood of experiencing geriatric depression has been shown to increase with age, and the disorder is more pre- valent among women and those with low levels of educa-
MMSE-DS=mini-mental state examination for dementia screening.
Figure 1. Study framework.
tion [5,6]. Furthermore, depression appears to be worse among older adults with a poor ability to chew and those with a poor nutritional status [7,8]. The symptoms of geri- atric depression tend to be aggravated among individuals with cognitive impairments [9].
The overuse of information technology by Korean ado- lescents and college students has had a negative impact on their mental health [10,11]. In contrast, among older adults, the use of information technology such as the internet or smartphones has a positive effect on mental health [12]. It is true that there are conflicting results such as the fact that the use of information technology does not affect depres- sion [13]. However, in order to understand the effect of older adults’ use of information technology and the policy based on it, it is necessary to identify the effect of its use on depression.
According to a survey on older adults in Korea, 70.9% of those over 65 years old have two or more chronic diseases [14]. People with multimorbidity have poorer functional status, quality of life, and health outcomes and higher health care costs than those without multimorbidity [15].
However, most of the studies on depression in older adults have been related to a single disease. As such, more information is needed to understand the relationship be- tween multimorbidity and depression in older adults so as to develop interventions aimed at prevention and burden reduction, and to align health care services more appro- priately.
Among Korean older adults aged 65 years and over, the prevalence of depression is 20.0% in those with more than
three chronic diseases, 17.3% in those with two chronic diseases, 15.5% in those with one chronic disease, and 9.9% in those without a chronic disease [16]. These find- ings indicate that older adults with multiple diseases might have a high incidence of depression. Depressive symptoms, which do not necessarily fulfill the diagnostic criteria for depression, have been identified as a signifi- cant factor associated with poor health outcomes. Screen- ing for depressive symptoms is important for identifying significant risk factors [17]. Therefore, the present study examined the factors that influence depressive symptoms in older Korean adults with multiple chronic diseases.
Specifically, this study aimed to (1) compare differences in sociodemographic, cognitive, and body functional fac- tors and the use of information technology between de- pressive and non-depressive groups of older adults with multiple chronic diseases and (2) determine the effects of cognitive function, nutritional management status, func- tional status, and the use of information technology on geriatric depressive symptoms.
METHODS
1. Study Design and Data SourceThis was a cross-sectional study involving secondary analysis of data from the 2014 National Survey on the Eld- erly to determine the factors related to depressive symp- toms among older adults with multiple chronic diseases (Figure 1).
2. Study Participants
The inclusion criteria were: adults aged 65 years or old- er and dwelling in one of the 16 cities or provinces in which the 2014 survey was conducted [18]. The sample was selected using a proportional stratified sampling me- thod. The population was first stratified according to the 16 cities and provinces, and the provinces were then fur- ther stratified by town. One-to-one direct interviews were conducted with household-dwelling participants over the age of 65. The survey results comprised the overall living conditions, familial and social relationships, economic sta- tus and activities, health conditions and behaviors, func- tional status, leisure activities, living environment, safety, use of facilities and services, and perceptions about old age.
Since depressive symptom screening was conducted using a self-reported questionnaire, we excluded older adults with dementia owing to concerns regarding the re- liability of their responses. We also excluded older adults with depression because our focus was on the screening of undetected depressive symptoms. From among the 10,451 older adults (100% response rate) who participated in the survey, we focused on the 6,672 older adults who re- sponded to the questionnaire themselves, did not have de- mentia or depression, and who had two or more chronic diseases that had been diagnosed by a doctor. The chronic diseases reported by the older adults included cardio- vascular, endocrine, musculoskeletal, respiratory, sensory, digestive, genitourinary and other illnesses (e.g., anemia, sequela of fracture, and others), and cancer.
3. Measurements
1) Sociodemographic characteristics of participants We selected sociodemographic variables through a lit- erature review [2,5,6]. The sociodemographic characteris- tics investigated in this study were age, gender (men, wom- en), educational level (uneducated, elementary, middle school, high school, college or more), marital status (unmarried, married, widowed, others), and employment status (employed, unemployed).
2) Depressive symptoms
Depressive symptoms were evaluated using the short form of the Geriatric Depression Scale (SGDS). This scale, developed by Sheikh and Yesavage [19], is a 15-item ver- sion of the original (30-item) Geriatric Depression Scale.
Each of the 15-items on the SGDS is answered “yes” or
“no,” with the total score ranging from 0 to 15. Higher
scores indicate more severe depressive symptoms. A total score of 8 has been proposed as the cutoff for depression according to a diagnostic validity study in South Korea [20]. Therefore, we defined the presence of depressive symptoms as an SGDS score of 8~15. The reliability of the instrument was measured by means of Cronbach’s ⍺, which was 0.895 in the present study.
3) Independent variables
The independent variables in this study were as fol- lows. For cognitive function, we used the score on the Korean version of the Mini-Mental State Examination for dementia screening [21]. This 19-item tool is responded to using “yes” or “no” answers, with higher scores indicating better cognitive function. Nutritional management status was evaluated using the DETERMINE Your Nutrition Health Checklist developed by the Nutrition Screening Initiative [22]. On the nutrition checklist, the summed scores for the 10 items (0=yes; 1=no) can be classified as good nutritional management (0~2 points), moderate nutritional management risk (3~5 points), and high nutri- tional management risk (6 points or more). We also inves- tigated the functional status for vision, hearing, and chew- ing (rated as “not difficult,” “slightly difficult,” and “very difficult”) and online networking. Online networking was measured in terms of computer and internet use (rated as
“very proficient,” “without difficulty,” “with difficulty,”
and “never use”), possession of a cellphone (rated as
“smartphone,” “general cellphone,” and “no”), and pur- pose of cellphone use (rated as “only calling,” “calling and receiving messages,” “calling and sending messages,” and
“searching for information and more”).
4) Ethical considerations
The National Survey on the Elderly is conducted by the Ministry of Health and Welfare every three years. The 2014 survey was approved by the National Statistical Office (Approval No. 11771). For our study, after receiving the approval of the Korean Institute for Health and Social Affairs, we received raw data without personal identi- fication information and analyzed them statistically.
5) Statistical analysis
IBM SPSS Statistics 23.0 was used for all statistical anal- yses in this study. Descriptive statistics were computed for all variables, including the means and Standard Deviations (SD) for continuous variables, and frequencies and per- centages for categorical variables. The differences between groups were examined using an independent t-test and x2 test. A logistic regression analysis was used to examine
the association of depressive symptoms with cognitive func- tion, nutritional management status, online networking.
RESULTS
1. Sociodemographic and Clinical Characteristics of Subjects
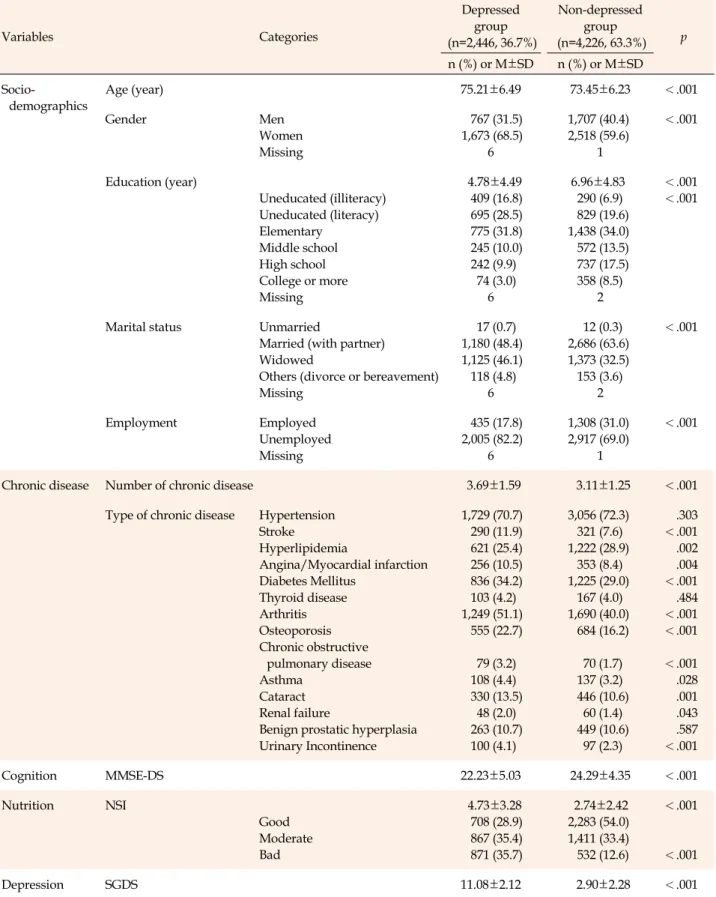
As shown in Table 1, 36.7% of the subjects had a score of 8 points or more on the SGDS. The mean age of respon- dents with depressive symptoms was 75.21±6.49 years and 68.5% of them were women. Of those with depressive symptoms, 45.3% had zero years of formal education, 48.4
% were married, and 17.8% were employed. The mean pe- riod of education was 4.78±4.49 years and the average number of chronic diseases was 3.69±1.59. The mean score for cognition was 22.23±5.03 points and 35.7% were classi- fied as having “high nutritional management risk.” The average SGDS score was 11.08±2.12 points.
The mean age of the respondents without depressive symptoms was 73.45±6.23 years and 59.6% of them were women. Of those with depressive symptoms, 26.5% had no formal education, 63.6% were married, and 31.0% were employed. The mean period of education was 6.96±4.83 years and the average number of chronic diseases was 3.11
±1.25. The mean score for cognition was 24.29±4.35 points and 12.6% were classified as having “high nutritional ma- nagement risk.” The average SGDS score was 2.90±2.28 points (Table 1).
2. Differences in Characteristics between the De- pressed and Non-depressed Groups
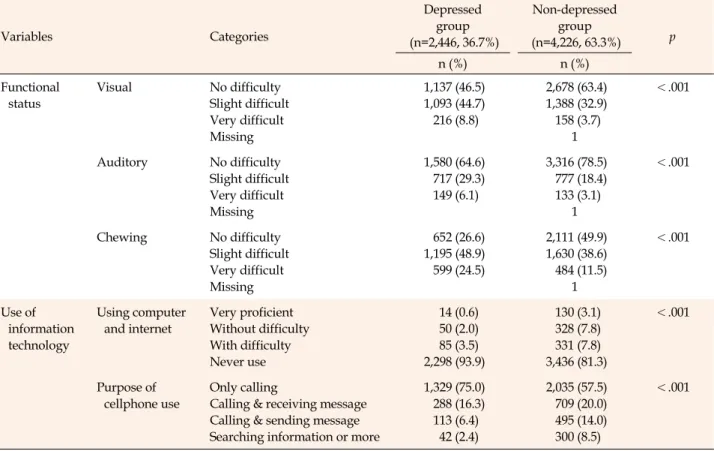
We found that the depressed group was older, had a larger proportion of women, had lower educational levels, had fewer married and employed individuals, had poorer cognitive function, was more likely to have high nutri- tional management risk, and had higher SGDS scores than did the non-depressed group (Table 1). Furthermore, the depressed group was more likely to have functional limi- tations (e.g., vision, hearing, and chewing) and was less likely to use computers or cellphones (Table 2).
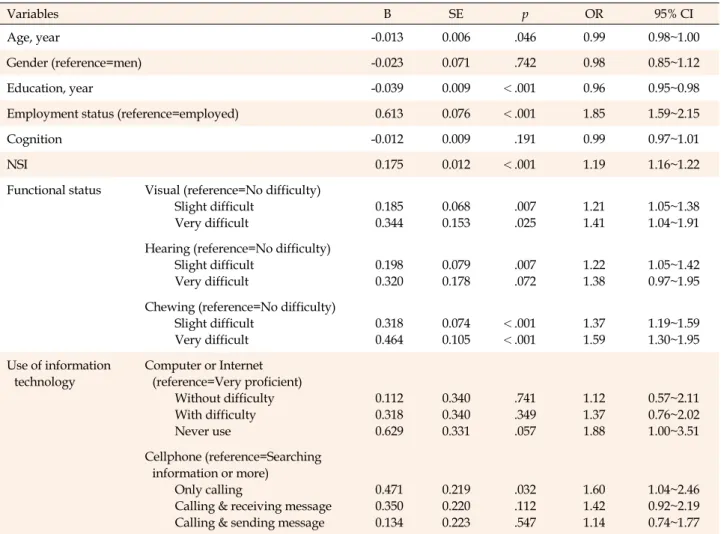
3. Influencing Factors of Depressive Symptoms The results of the logistic regression analysis indicated that the significant predictors of depressive symptoms were unemployment (Odds Ratio [OR]=1.85, 95% Confidence Interval [CI]=1.59~2.15), high nutritional management risk (OR=1.19, 95% CI=1.16~1.22), slight visual dysfunction
(OR=1.21, 95% CI=1.05~1.38), high visual dysfunction (OR=1.41, 95% CI=1.04~1.91), slight hearing dysfunction (OR=1.22, 95% CI=1.05~1.43), slight chewing dysfunction (OR=1.37, 95% CI=1.19~1.59), high chewing dysfunction (OR=1.59, 95% CI=1.30~1.95), low degree of cellphone utilization (OR=1.60, 95% CI=1.04~2.46), older age (OR=
0.99, 95% CI=0.98~1.00), and higher education (OR=0.96, 95% CI=0.95~0.98). Please see Table 3 for more information.
DISCUSSION
We identified factors related to depressive symptoms in older Korean adults. Furthermore, since we used a nation- ally representative sample, the results of this study are generalizable to older adults throughout South Korea.
We found that 36.7% of the respondents showed de- pressive symptoms. This prevalence rate was higher than that of the findings in previous studies on older adults [5,7,23]. Furthermore, the prevalence rate of depressive symptoms in our study was substantially higher than in another study on Korean adults over 65 years with chronic disease, where it was 20.0% among those with three or more chronic diseases, followed by 17.3% in those with two chronic diseases [16]. The higher rate of depressive symptoms in this study is presumed to be due to the differ- ence in criteria for judging the presence or absence of de- pressive symptoms. We used the SDGS as the screening tool while the precedent study [16] screened positive for depressive symptoms when respondents said they had been sad or desperate for more than two consecutive weeks for the past year. This may be because the formal screening of depressive symptoms is superior to retrospective judg- ment by older adults. Research on geriatric depression has shown that the number of diseases has a positive causal re- lationship with depression [24], which suggests a need for a greater focus on older adults with multiple chronic med- ical conditions since they may be more susceptible.
We identified a number of important factors that have an impact on depressive symptoms, such as physical health status and unemployment. Employment status [2,25] and body functioning were related to depression,[26] and this was consistent with past research. Evidently, health pro- grams to maintain healthy body function and policies to encourage the employment of older adults are needed to prevent depressive symptoms.
Older adults tend to be at a high risk of having an in- adequate diet and being malnourished, which can lead to diminished functional status, muscle damage, a dys- functional immune system, anemia, diminished cogni- tive function, delayed wound healing, high hospitaliza-
Table 1. Differences of Socio-demographics and Clinical Characteristics between Depressed Group and Non-depressed Group
Variables Categories
Depressed group (n=2,446, 36.7%)
Non-depressed group
(n=4,226, 63.3%) p n (%) or M±SD n (%) or M±SD Socio-
demographics
Age (year) 75.21±6.49 73.45±6.23 <.001
Gender Men
Women Missing
767 (31.5) 1,673 (68.5)
6
1,707 (40.4) 2,518 (59.6)
1
<.001
Education (year)
Uneducated (illiteracy) Uneducated (literacy) Elementary
Middle school High school College or more Missing
4.78±4.49 409 (16.8) 695 (28.5) 775 (31.8) 245 (10.0) 242 (9.9) 74 (3.0)
6
6.96±4.83 290 (6.9) 829 (19.6) 1,438 (34.0) 572 (13.5) 737 (17.5) 358 (8.5)
2
<.001
<.001
Marital status Unmarried
Married (with partner) Widowed
Others (divorce or bereavement) Missing
17 (0.7) 1,180 (48.4) 1,125 (46.1) 118 (4.8)
6
12 (0.3) 2,686 (63.6) 1,373 (32.5) 153 (3.6)
2
<.001
Employment Employed
Unemployed Missing
435 (17.8) 2,005 (82.2)
6
1,308 (31.0) 2,917 (69.0)
1
<.001
Chronic disease Number of chronic disease 3.69±1.59 3.11±1.25 <.001
Type of chronic disease Hypertension Stroke
Hyperlipidemia
Angina/Myocardial infarction Diabetes Mellitus
Thyroid disease Arthritis Osteoporosis Chronic obstructive
pulmonary disease Asthma
Cataract Renal failure
Benign prostatic hyperplasia Urinary Incontinence
1,729 (70.7) 290 (11.9) 621 (25.4) 256 (10.5) 836 (34.2) 103 (4.2) 1,249 (51.1)
555 (22.7) 79 (3.2) 108 (4.4) 330 (13.5) 48 (2.0) 263 (10.7) 100 (4.1)
3,056 (72.3) 321 (7.6) 1,222 (28.9)
353 (8.4) 1,225 (29.0)
167 (4.0) 1,690 (40.0)
684 (16.2) 70 (1.7) 137 (3.2) 446 (10.6) 60 (1.4) 449 (10.6) 97 (2.3)
.303
<.001 .002 .004
<.001 .484
<.001
<.001
<.001 .028 .001 .043 .587
<.001
Cognition MMSE-DS 22.23±5.03 24.29±4.35 <.001
Nutrition NSI
Good Moderate Bad
4.73±3.28 708 (28.9) 867 (35.4) 871 (35.7)
2.74±2.42 2,283 (54.0) 1,411 (33.4) 532 (12.6)
<.001
<.001
Depression SGDS 11.08±2.12 2.90±2.28 <.001
MMSE-DS=mini-mental state examination for dementia screening; NSI=nutritional screening initiative; SGDS=short form of the geriatric depression scale; SD=standard deviation.
Table 2. Differences of Functional Status and the Use of Information Technology between Depressed Group and Non-depressed Group
Variables Categories
Depressed group (n=2,446, 36.7%)
Non-depressed group
(n=4,226, 63.3%) p
n (%) n (%)
Functional status
Visual No difficulty
Slight difficult Very difficult Missing
1,137 (46.5) 1,093 (44.7) 216 (8.8)
2,678 (63.4) 1,388 (32.9) 158 (3.7)
1
<.001
Auditory No difficulty Slight difficult Very difficult Missing
1,580 (64.6) 717 (29.3) 149 (6.1)
3,316 (78.5) 777 (18.4) 133 (3.1)
1
<.001
Chewing No difficulty
Slight difficult Very difficult Missing
652 (26.6) 1,195 (48.9) 599 (24.5)
2,111 (49.9) 1,630 (38.6) 484 (11.5)
1
<.001
Use of information technology
Using computer and internet
Very proficient Without difficulty With difficulty Never use
14 (0.6) 50 (2.0) 85 (3.5) 2,298 (93.9)
130 (3.1) 328 (7.8) 331 (7.8) 3,436 (81.3)
<.001
Purpose of cellphone use
Only calling
Calling & receiving message Calling & sending message Searching information or more
1,329 (75.0) 288 (16.3) 113 (6.4) 42 (2.4)
2,035 (57.5) 709 (20.0) 495 (14.0) 300 (8.5)
<.001
tion/re-hospitalization rates, and mortality [27]. Thus, nu- trition is an important factor to consider in the health ma- nagement of older adults. In this vein, previous studies have demonstrated a significant relationship between malnutrition and depression [5]. Indeed, the inadequate nutritional pattern of older adults appears to have an in- fluence on both physical and mental health including de- pression [28]. In the present study, we investigated the re- lationship between nutritional management status (rather than nutritional status) and depressive symptoms and found that 35.7% of the respondents with and 12.6% of those without depressive symptoms were at a high nutri- tional management risk. The difference between the two groups was significant. Older adults, especially those with depressive symptoms, are vulnerable to poor nutritional management. Therefore, timely screening of older adults at risk of poor nutritional status is vital to manage depres- sive symptoms.
We found that dysfunctions in vision, hearing, and chew- ing were significantly related to depressive symptoms. Sen- sory disorders are typically accompanied by numerous dif- ficulties in activities of daily living, and several studies have found vision and hearing dysfunctions to be asso-
ciated with geriatric depression [7,23]. Past studies have also found that chewing dysfunction is related to depres- sion [8], which is consistent with the findings of the cur- rent study.
The purpose of cellphone use among Korean older adults also influenced the odds of exhibiting depressive symptoms. Smartphones can be an effective method to im- prove and maintain cognitive function and decrease de- pression in older adults aged 65 years or older [29]. Addi- tionally, it has been shown that information technology and online social interaction can be used to influence geri- atric depression directly [30]. This study suggests that on- line networking as a form of social support can be utilized as an intervention for geriatric depression. In other words, it may be beneficial to implement educational programs on smartphone usage for older adults at libraries and com- munity centers. South Korea has the highest penetration rate of high-speed internet worldwide, and as such, smart- phone technology could be used to improve older adults’
psychological well-being.
Cognitive function was not identified as an influencing factor in the present study. Although one study reported no correlations between cognitive function and depres-
Table 3. Associated Factors with Depressive Symptoms as the Dependent Variable using Logistic Regression Model
Variables B SE p OR 95% CI
Age, year -0.013 0.006 .046 0.99 0.98~1.00
Gender (reference=men) -0.023 0.071 .742 0.98 0.85~1.12
Education, year -0.039 0.009 <.001 0.96 0.95~0.98
Employment status (reference=employed) 0.613 0.076 <.001 1.85 1.59~2.15
Cognition -0.012 0.009 .191 0.99 0.97~1.01
NSI 0.175 0.012 <.001 1.19 1.16~1.22
Functional status Visual (reference=No difficulty) Slight difficult
Very difficult
0.185 0.344
0.068 0.153
.007 .025
1.21 1.41
1.05~1.38 1.04~1.91 Hearing (reference=No difficulty)
Slight difficult Very difficult
0.198 0.320
0.079 0.178
.007 .072
1.22 1.38
1.05~1.42 0.97~1.95 Chewing (reference=No difficulty)
Slight difficult Very difficult
0.318 0.464
0.074 0.105
<.001
<.001
1.37 1.59
1.19~1.59 1.30~1.95 Use of information
technology
Computer or Internet (reference=Very proficient)
Without difficulty With difficulty Never use
0.112 0.318 0.629
0.340 0.340 0.331
.741 .349 .057
1.12 1.37 1.88
0.57~2.11 0.76~2.02 1.00~3.51 Cellphone (reference=Searching
information or more) Only calling
Calling & receiving message Calling & sending message
0.471 0.350 0.134
0.219 0.220 0.223
.032 .112 .547
1.60 1.42 1.14
1.04~2.46 0.92~2.19 0.74~1.77 NSI=nutritional screening initiative; SE=standard error; OR=odds ratio; CI=confidential interval.
sion in Korean older adults [29], most previous studies suggested the existence of a correlation between these two variables [8]. Cognitive decline is regarded as a continu- ous process from normal function to dementia. Therefore, cognitive decline-related and comorbid disease character- istics will differ depending on the degree of cognitive decline. However, we only analyzed the cognitive func- tion score in a dichotomous manner (i.e., as normal or ab- normal). Therefore, we could not identify possible influen- tial factors. Further studies need to consider the relation- ship and direction of these variables through longitudinal studies.
The present study had several limitations. First, we applied a subjective self-report measurement method to assess geriatric depressive symptoms. Thus, the preva- lence of depressive symptoms may have been under or overestimated, depending on the situation. However, we made sure to use evaluation tools with robust validity to limit this possibility. Second, although we considered a
number of different types of factors related to geriatric depression, we did not consider the possible interactions between two or more types of factors. Third, although the present study selected a representative sample of the Korean older adult population, we could not analyze any causal relationships between depressive symptoms and other factors because this was a cross-sectional survey.
CONCLUSION
We identified that unemployment, poor nutritional management status, visual dysfunction, moderate hearing dysfunction, chewing dysfunction, and infrequent cell- phone use were significant factors associated with depres- sive symptoms among Korean older adults. Those at a higher age or educational level report fewer depressive symptoms.
Our results suggest that interventions targeting geri- atric depression in South Korea must begin with the active
utilization of assistive devices aimed at enhancing older adults’ physical functions, such as sight, hearing, and chewing. Additionally, nutritional management policies that seek to improve nutritional status could be developed along with nutrition education programs. The use of the internet and smartphones could be promoted through the development or utilization of applications customized for older adults.
CONFLICTS OF INTEREST
The authors declared no conflict of interest.
AUTHORSHIP
Study conception and writing draft - HE; Data analysis and inter- pretation - SS.
ACKNOWLEDGEMENT
This work was supported by Wonkwang University Research Fund in 2018.
REFERENCES
1. Kim JI, Choe MA, Chae YR. Prevalence and predictors of geri- atric depression in community-dwelling elderly. Asian Nurs- ing Research. 2009;3(3):121-9.
https://doi.org/10.1016/S1976-1317(09)60023-2
2. Kwon KH. Prevalence and risk factors of depressive symptoms by gender difference among the elderly aged 60 and over.
Journal of Korea Gerontological Society. 2015;35(2):269-82.
3. Barry LC, Abou JJ, Simen AA, Gill TM. Under-treatment of de- pression in older persons. Journal of Affective Disorders.
2012;136(3):789-96. https://doi.org/10.1016/j.jad.2011.09.038 4. Smalbrugge M, Pot AM, Jongenelis L, Gundy CM, Beekman
ATF, Eefsting JA. The impact of depression and anxiety on well being, disability and use of health care services in nursing home patients. International Journal of Geriatric Psychiatry.
2006;21(4):325-32. https://doi.org/10.1002/gps.1466 5. Cabrera MAS, Mesas AE, Garcia ARL, de Andrade SM. Malnu-
trition and depression among community-dwelling elderly people. Journal of the American Medical Directors Associa- tion. 2007;8(9):582-4.
https://doi.org/10.1016/j.jamda.2007.07.008
6. Seo SO, So AY. Depression and cognitive function of the com- munity-dwelling elderly. Journal of Korean Academy of Com- munity Health Nursing. 2016;27(1):1-8.
https://doi.org/10.12799/jkachn.2016.27.1.1
7. Chou KL, Chi I. Combined effect of vision and hearing impair- ment on depression in elderly Chinese. International Journal of Geriatric Psychiatry. 2004;19(9):825-32.
https://doi.org/10.1002/gps.1174
8. Kimura Y, Ogawa H, Yoshihara A, Yamaga T, Takiguchi T, Wada T, et al. Evaluation of chewing ability and its relation- ship with activities of daily living, depression, cognitive status and food intake in the community-dwelling elderly. Geriatrics
& Gerontology International. 2013;13(3):718-25.
https://doi.org/10.1111/ggi.12006
9. Lee HJ, Kahng SK. The reciprocal relationship between cogni- tive functioning and depressive symptom: group comparison by gender. Korean Journal of Social Welfare Studies. 2011;
42(2):179-203.
10. Kim HJ, Park HJ, Ahn HJ. A multi-group path analysis among smartphone-internet addiction, depression, aggression, social relationships and school violence. Korean Journal of Educa- tional Research. 2016;54(1):77-104.
11. Paek KS. A convergence study the association between addic- tive smartphone use, dry eye syndrome, upper extremity pain and depression among college students. Journal of the Korea Convergence Society. 2017;8(1):61-9.
https://doi.org/10.15207/JKCS.2017.8.1.061
12. Jun HJ, Kim MY. The longitudinal effects of internet use on depression in old age. Korean Journal of Social Welfare Re- search. 2014;42:187-211.
13. Kim MY, Jun HJ. The influence of IT use and satisfaction with IT use on depression among older adults. Korean Journal of Gerontological Social Welfare. 2016;71(1):85-110.
14. Jung YH. Analysis of multiple chronic diseases of the elderly:
focusing on outpatient use. Health ․ Welfairs Issue & Focus.
2013;196(2013-26):1-8.
15. Marengoni A, Angleman S, Melis R, Mangialasche F, Karp A, Garmen A, et al. Ageing with multimorbidity: a systematic re- view of the literature. Ageing Research Reviews. 2011;10(4):
430-9. https://doi.org/10.1016/j.arr.2011.03.003
16. Lim JH. The relationship among depressive symptoms and chronic disease in the elderly. Journal of Digital Convergence.
2014;12(6):481-90.
https://doi.org/10.14400/JDC.2014.12.6.481
17. Wang T, Fu H, Kaminga AC, Li Z, Guo G, Chen L, et al. Preva- lence of depression or depressive symptoms among people living with HIV/AIDS in China: a systematic review and meta- analysis. BMC Psychiatry. 2018;18:160.
https://doi.org/10.1186/s12888-018-1741-8
18. Ministry of Health Welfare. Korea Institute for Health and Social Affairs. Report on the Korean national older adults life survey 2014. Seoul: Ministry of Health Welfare; 2015.
19. Sheikh JI, Yesavage JA. Geriatric Depression Scale (GDS): re- cent evidence and development of a shorter version. Clinical Gerontologist: The Journal of Aging and Mental Health. 1986;
5(1-2):165-73. https://doi.org/10.1300/J018v05n01_09 20. Lee SC, Kim WH, Chang SM, Kim BS, Lee DW, Bae JN, et al.
The use of the Korean version of Short Form Geriatric De-
pression Scale (SGDS-K) in the community dwelling elderly in Korea. Journal of Korean Geriatric Psychiatry. 2013;17(1):37- 43.
21. Kim TH, Jhoo JH, Park JH, Kim JL, Ryu SH, Moon SW, et al.
Korean Version of mini mental status examination for demen- tia screening and its' short form. Psychiatry Investigation. 2010;
7(2):102-8. https://doi.org/10.4306/pi.2010.7.2.102
22. Nutrition Screening Initiative. Report of nutrition screening 1:
Toward a common view: a consensus conference. Washington, DC: Nutrition Screening Initiative; 1991.
23. Tsai SY, Cheng CY, Hsu WM, Su TPT, Liu JH, Chou P.
Association between visual impairment and depression in the elderly. Journal of the Formosan Medical Association. 2003;
102(2):86-90.
24. Chang-Quan H, Xue-Mei Z, Bi-Rong D, Zhen-Chan L, Ji-Rong Y, Qing-Xiu L. Health status and risk for depression among the elderly: a meta-analysis of published literature. Age & Ageing.
2010;39(1):23-30. https://doi.org/10.1093/ageing/afp187 25. Lim YJ, Choi YS. Dietary behaviors and seasonal diversity of
food intakes of elderly women living alone as compared to
those living with family in Gyeongbuk rural area. Korean Journal of Community Nutrition. 2008;13(5):620-9.
26. Wassink-Vossen S, Collard RM, Oude Voshaar RC, Comijs HC, de Vocht HM, Naarding P, et al. Physical(in)activity and depression in older people. Journal of Affective Disorders.
2014;161:65-72. https://doi.org/10.1016/j.jad.2014.03.001 27. Ahmed T, Haboubi N. Assessment and management of nu-
trition in older people and its importance to health. Clinical Interventions in Aging. 2010;5:207-16.
28. Lee IH. Associations between dietary intake and health status in Korean elderly population. The Korean Journal of Nutri- tion. 2002;35(1):124-36.
29. Hwang S, Lee H, Ha E, Kim S, Jung G, Choi H. The effects of use of smartphone and cognitive function on depression, and loneliness of life in elders. The Journal of Occupational The- rapy for the Aged and Dementia. 2017;11(1):9-19.
30. Yoon H, Lee O, Beum K, Gim Y. Effects of online social rela- tionship on depression among older adults in South Korea.
The Journal of Korea Contents Association. 2016;16(5):623-37.
https://doi.org/10.5392/JKCA.2016.16.05.623