2006, Vol. 50, No. 3
Printed in the Republic of Korea
살아있는 세포에서 전기화학적 흑연 연필심 전극을 사용한 살균제의 실시간 분석
이 수 영*
국립서울산업대학교바이오센서연구소
(2006. 2. 16 접수)
Real-time Pesticide Assay on Live Tissue Using Electrochemical Graphite Pencil Electrode
Suw Young Ly*
Biosensor Research Institute, Seoul National University of Technology, Seoul 139-743, Korea
(Received February 16, 2006)
요 약. 간편하게만들어진흑연연필심작업전극을사용한순환전압전류법과사각파형벗김전압전류법으로살충제 페니트로치온을정량하였다. 최적분석조건을연구한결과기존의전기화학적분석법들보다정밀하고낮은검출한계에 도달하였으며이들조건은다음과같다. 수소이온농도: 3.7 pH, 벗김사각파형주파수: 500 Hz, 벗김사각파형증폭률
: 0.1V, 벗김파형상승전위: 0.005V, 석출전위: -0.9V, 석출시간: 500초에서벗김전압전류법과순환전압전류법의페니트 로치온농도검출한계는: 6.0 ngL−1 (2.164×10⁻¹¹ molL-1) 이었다. 상대표준편차는 10 ugL-1을 15번반복측정하여
0.30%의정밀도였으며. 위최적조건에서실시간살아있는세포에서분석응용하였다.
주제어: 살충제, 페니트로치온, 흑연연필심전극, 전압전류법, 살아있는세포속
ABSTRACT. A simply prepared graphite, pencil-type working electrode was utilized to monitor fenitrothion con- centrations, using the cyclic voltammetry (CV) and square-wave (SW) stripping voltammetry methods. The optimum conditions for analysis were sought. A very low detection limit was obtained compared to that obtained when other com- mon voltammetry methods are used. The optimal parameters of the pencil-type electrode were found to be as follows:
a pH of 3.7, a frequency of 500 Hz, an SW amplitude of 0.1 V, an increment potential of 0.005 V, an initial potential of -0.9 V, and a deposition time of 500 sec. The analytical detection limit was determined to be 6.0 ngL-1 (2.164×10⁻¹¹ molL-1) fenitrothion at SW anodic and CV, and the relative standard deviation at the fenitrothion concentration of SW anodic 10 ugL-1 was 0.30% (n = 15) under the optimum conditions. Analysis was directly conducted through in-vivo real- time assay.
Keywords: Pesticide, Fenitrothion, Pencil Type Electrode, Voltammetry, In Vivo
INTRODUCTION
Fenitrothion (MW=277.24) and its analogous pesti- cide are important in medicinal chemistry, and for humans. Fenitrothion can behave as an androgen agonist; can cause major changes in the hematolog- ical indices in warm-blooded animals, as well as
cancer, Parkinson’s Disease,cell tumors, and other diseases1-5 and can be a cause of worry for many consumers of plant products such as olive oil because of its acute toxicity.6-9 Thus, various convenient methods for analyzing fenitrothion and its analogs have been developed, such as online reversed-phase liquid chromatography-gas chromatography (RPLC-
GC),8 solid-phase extraction,10 a liquid chromato- graphic multi-residue method,11 gas chromatogra- phy ion-trap mass spectrometry detection (GC-MS),12 and gas chromatography (GC).9 These methods are very sensitive, but they require a compressing sys- tem as well as temperature-controlling systems, separation systems, and other spectrophotometric or electric detection systems. Recently, there has been an increasing demand for more sensitive and sim- pler methods of analysis.
Square-wave voltammetry techniques are very useful and popular for trace pesticides13-15 since they are compact, efficient, and sensitive.16,17 Various voltammetry solutions have been found to have low detection limits, which are required for pesticide analysis, depending on the working electrode sys- tems used. For example, an acetycholine (ACh) biosen- sor fabricated with gienzymes/poly (diallyldimethyl ammonium chloride) (PDDA) multiplayer, film-modi- fied platinum (Pt) electrodes through a layer-by- layer technique (LBL) attained a detection limit of 0.001 ugmL-1 for trichlorfon;18 a cobalt phthalocya- nine-modified carbon ink electrode attained the detection limit of 28.8 nM for nabam;19 and an enzyme biosensor based on acetylcholinesterase (AChE) and choline oxidase (ChO) immobilized on the supported monomolecular layer attained the detection limit of 1.3×10⁻³ ppb for the dimethyl-2. 2-dichlorovinyl- phosphate (DDVP), 0.01 ppb for carbonfuran, and 0.03 ppb for escrine.20 Furthermore, the detection limit of isolated photosystem II (PSII) immobilized between the dialysis membrane and the Teflon membrane of the Clark oxygen electrode was 5×10⁻¹⁰ M for diuron;21 and a screen-printed enzyme electrode attained the detection limit of 5 nM (1.3 ppb) for trichlorfon.22 All these methods attained very low detection limits.
There are many articles about various kinds of pesticides, but hardly any article on the detection of fenitrothion using electrode systems could be found.
As such, the detection and analysis of fenitrothion were conducted in this study, specifically using the pencil-type electrode, which can be easily prepared, and is renewable and low-cost.23,24 The pencil-type electrode is versatile for electrochemical measure-
ments,25 and is able to detect the low concentration and/or volume of an analyte because it has a larger active electrode surface area.26 Various researches have been conducted using the pencil-type electrode or the pencil-type graphite electrode (PGEs).27,28 The use of this method enabled detection limits for fenitrothion lower than those mentioned above to be obtained in vivo. It was first applied to a direct assay in living tissue.
EXPERIMENT
Apparatus Reagents and the Procedure Voltammetric systems were conducted using the CHI-660A Instruments Electrochemical Worksta- tion (CH Instruments Inc., Cordova TN, USA).
Three-electrode cell systems were used to monitor the cyclic and square-wave stripping voltammo- grams. The pencil-type electrode was prepared as a working electrode (Pentel Hi-Polymer Ain, 0.9 mm×
60 mm, Pentel Co., Ltd., Japan) using a 0.5-mm- diameter copper wire connected to the measure- ment system. Graphite nanotube paste electrode29-31 and DNA-mixed nanotube paste electrode32 were prepared. Ag/AgCl electrode (Cl coated 0.2 mm diameter wire type) and a platinum wire (0.2 mm diameter) served as the reference and auxiliary elec- trodes, respectively. All the solutions were prepared from double-distilled water (-18-M Ohm cm-1). 0.1-M NH4H2PO4, with a pH level of 3.7, served as a sup- porting electrolyte solution. All the other reagents were of analytical grade. The three-electrode sys- tem was immersed in a stirred solution of a known amount of fenitrothion. Prior to stripping, pre-con- centration was carried out using dissolved oxygen.
The common parameter for CV was a scan rate of 3.5 Vs-1, and the common parameters for stripping voltammetry were used under optimized conditions with both working electrodes. The voltammetric response of fenitrothion is dependent on the electro- lyte solutions being used and on the pH. Various types of electrolyte solutions were tested, and from among these, the phosphate solution was found to yield the best results. In the electrode comparison at
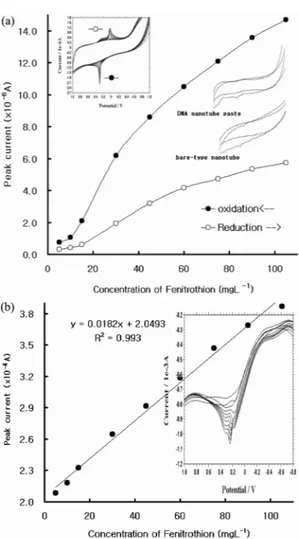
Fig. 1(a), the pencil-type electrode responded more
sensitively than the bare-type nanotube paste elec- trode and the DNA-composed nanotube paste elec- trode in a CV peak height for oxidation and reduction scan. The results that were obtained by the bare- type nanotube are as follows: 4.378×10⁻⁷ A (ox) and 8.821×10⁻⁷ A (Re); and by the DNA nanotube paste electrode: 4.137×10⁻⁶ A (Ox) and 1.144×10⁻⁷ A (Re), using 20-mgL-1 fenitrothion, under the same elec-
trolyte conditions. Considerable noise was pro- duced when the bare-type nanotube electrode was used in CV, and the anodic peak had a kind of peak current, while the cathodic peak was broad at the DNA nanotube paste electrode in CV.
RESULTS AND DISCUSSION
Fenitrothion concentration using cyclic and square-wave stripping voltammetry
First, the cyclic voltammetric peak potentials with a high concentration of 5- to 105-mgL-1 feni- trothion were studied. Fig. 1a shows the raw volta- mmograms of the results in 0.1-M NH4H2PO4, with a pH of 3.7, and 3.5 V/s scan rate, based on the cyclic voltammetric signals tested on the pencil- type electrode. Between the initial cathodic scan of blank and 105-mgL-1 fenitrothion concentrations, a reduction peak appeared at 0.0 V. Then, at the next reverse scan, an oxidation peak of 0.3 V appeared, which was also well extracted from the background discharge and from the oxidation peak. That was the result of the spiked fenitrothion concentration between 5 and 105 mgL-1 at reduction and oxida- tion. At these conditions, the linear working equa- tions of reduction y=0.7819 x -1.7533; a correlation of R2 = 0.9646 (y: peak current in A; x: concentra- tion in mgL-1); and oxidation y = 1.8465 x -3.2016 and R2 = 0.9668 were obtained. These peak poten- tials were used for the determination of square- wave stripping voltammetry. Fig. 1b illustrates the SW signals from the fenitrothion concentration between 5 and 105 mgL-1, as in Fig. 1a. In the SW graph, the peak currents were gathered closely, sharply, and clearly at around 0.3 V. Based on the bigger graph with a line in Fig. 1b, it can be said that the response of the pencil-type electrode to fenitrothion is effective.
The regressive equation was y=0.0182 x +2.0493, with a correlation of R2 = 0.993. The power of the peak currents gradually increased from 2.083 to 3.866×10⁻⁵ A, with the same conditions as those in the above detection. Through two detections of fen- itrothion using CV and SW, respectively, the pencil- type electrode was able to detect the pesticide in the mgL-1 concentration.
Fig. 1. (a) Cyclic voltammograms of graphite pencil electrode in 0.1 M ammonium phosphate acid solutions (pH=3.69) containing of the 5-, 10-, 15-, 30-, 45-, 60-, 75-, 90-, and 105-mgL-1 fenitrothion, sacn rate of 3.5 V/s, and electrode comparison (insertion curve). (b) Square-wave stripping peak current of the 5-, 10-, 15-, 30-, 45-, 60-, 75-, 90-, and 105-mgL-1 fenitrothion concentrations, conditions of a pH 3.7, a frequency of 500 Hz, an SW amplitude of 0.1 V, an increment potential of 0.005 V, an initial potential of -0.9 V, and a deposition time of 100 sec.
Experimental optimization for various param- eters of square-wave stripping voltammetry
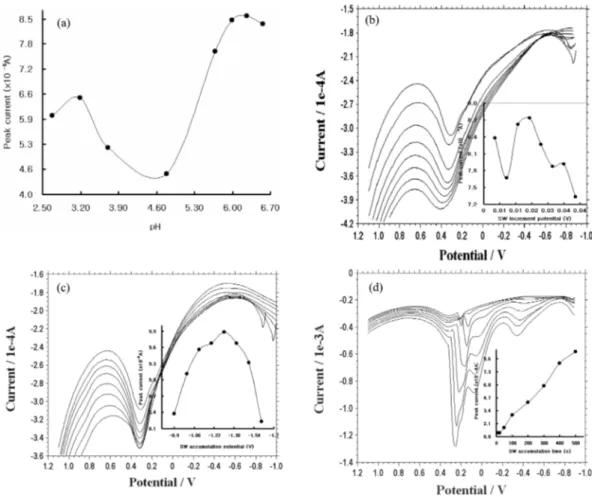
In Fig. 2a, various pH effects were examined using a 0.1-M ammonium phosphoric acid solution and 50-mgL-1 fenitrothion spiking. Based on a graph with a curve in the figure, the maximum peak cur- rents (8.557×10⁻⁶ A) were obtained at a pH of 6.26.
But the pH of 6.26 could not be an optimum pH because the peak potential was not 0.3 V at the SW graph in Fig. 2a. Only two peak currents (pH of 3.71 and 4.78) appeared at 0.3 V, but the pH of 3.71 had a more powerful peak current (5.198×10⁻⁶ A)
than the pH of 4.78 (4.526×10⁻⁶ A) in the pencil- type electrode. Thus, pH 3.7 was chosen as the opti- mum pH. At this condition, other parameters are used with Fig. 1(b) conditions. All the other exper- iments were performed using this pH of the electro- lyte solutions. In Fig. 2b, various square-wave peak currents for the increment potentials of 0.005~0.040 V are shown within fixed 50-mgL-1 fenitrothion con- centrations. Under these conditions, the accumula- tion time was fixed at 2 sec. The maximum peak current was obtained at 0.005 V. In the graph with a curve in the figure, the third point, 0.015 V, had the
Fig. 2. (a) Different pH effects of 2.68, 3.19, 3.71, 4.78, 5.68, 5.99, 6.26, and 6.56 on a 50-mgL-1 fenitrothion concentration, with electrolytes of the 0.1-M NH4H2PO4 solution. (b) Square-wave stripping voltammetric peak current at the various increment potentials of 0.005, 0.010, 0.015, 0.020, 0.025, 0.030, 0.035, and 0.040 V. (c) Various SW accumulation potentials of -0.9, -1.0, -1.1, -1.2, -1.3, -1.4, -1.5, and -1.6 V. (d) Various SW accumulation time of 10, 20, 50, 100, 200, 300, 400, and 500 sec in a 50- mgL-1 fenitrothion.
strongest peak current (8.621×10⁻⁶ A). The posi- tions of the peak currents for the increment poten- tial, however, were moving according to the SW graph in Fig. 2b; as such, the first increment poten- tial, 0.005 V, was determined to be the optimum increment potential (8.377×10⁻⁶ A) at the pH of 3.7, which was detected in the prior experiment. The succeeding examinations conducted in the search for optimum conditions were carried out using these detected optimum parameters. After that, the opti- mum accumulation potential for fenitrothion was examined. The results of this examination are shown in Fig. 2c. Within the range of -0.9 to -1.6 V, the most powerful peak current (9.882×10⁻⁶ A) appeared at -1.3 V, according to the one-curve graph. At the first point, however, it is -0.9 V, and it had the sharpest SW signal, which was detected only at the potential of 0.3 V, at 8.377×10⁻⁶ A. Thus, -0.9 V was selected as the optimum initial potential. This potential was also used in the other examinations.
Fig. 2d shows the effects of the SW accumulation time within a range of 10-500 sec under the same conditions and at a fixed fenitrothion concentration of 50 mgL-1. As expected, the peak current increased as the time increased. The heights of the peak cur- rents for the pencil-type electrode made up an almost-straight line. The SW signals were also straight and sharp. From among the time parameters, the last point of the one-curve graph (500 sec) had the tallest peak current (9.327×10⁻⁴ A). However, at the range of 200~500 sec, two interference peak ions appeared with 0.0V and -0.4 V, which manifested only in high accumulation times, and the curve of that time parameter was the deepest and was observed at 0.3 V. It was decided that the optimum time parameter would be 500 sec. At every mea- surement step, the electrode surface was cleaned using weighing papers, and electrode stability was obtained with statistical precisions of within 5%
error in each step, with each electrode usable in one or two months.
Concentration, statistical results, test on inter- ference, and application
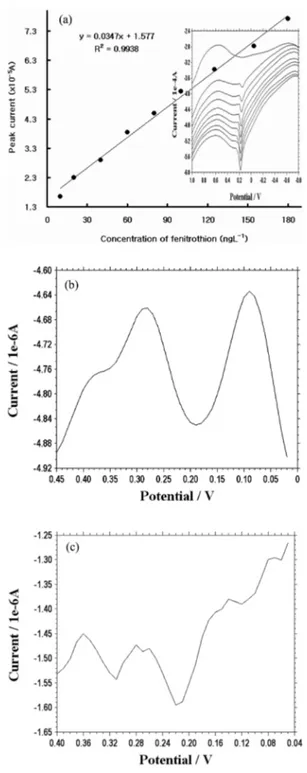
As shown in Fig. 3a, various detectable working
concentration ranges were examined. After the background current was subtracted from the mea- sured currents, those currents were plotted. A linear range within the low concentration range of 10-180 ngL-1 was exhibited. Within this range, anodic direc- tions sharply appeared, with a regression equation of y=0.0347x+1.577 (y: current in A; x: concentration in ngL-1), with R2=0.9938 (R2: correlation coefficient).
This equation can be used to determine the feni- trothion concentrations in pharmaceutical samples.
The curve in the bigger graph in the figure is simi- lar to a straight line. This means that the response of the pencil-type electrode is effective enough to detect an infinitesimal fenitrothion concentration, such as “ngL-1.” The precision of 15times of the 10-ugL-1 solution yielded a relative standard devia- tion of 0.29%. Although the results are not shown here, they are highly reproducible. The peak cur- rents varied between 1.824 and 5.224×10⁻⁴ A under the following optimum conditions: an initial poten- tial of -0.9 V, a final potential of 1.1 V, an incre- ment of 0.005 V, an amplitude of 0.1 V, a frequency of 500 Hz, a deposition time of 100 sec, and a sen- sitivity of 1e-4 AV-1. Since they gradually increased, they generated an almost-straight line. Thus, it was found that using the standard addition method in determining fenitrothion concentration could cor- rect the interference of other species. At this condi- tion, analytical detection limit was obtained for 6.0 ngL-1, with a 0.29% relative error, based on the sig- nal-to-noise (S/N) characteristics of the data for the S/N = 3 given optimum conditions.
Various possible interference species were tested under optimum conditions with other pesticides and heavy metals, in a fixed fenitrothion concentration of 1 mgL-1and 2 mgL-1, respectively. The propor- tion between fenitrothion and other substances was 1:10. The pesticides that were tested were chloroth- alonil, dichlorvos, simazine, thiram, and diazinon.
The heavy metals that were tested were Ba, Cr, Ce, Hg, Ge, Fe, and Cd. In these tests, 0.1-M ammo- nium phosphoric acid solution was used as the elec- trolyte solution. In the preceding order, they interfered with fenitrothion 9.36%, 5.48%, 3.56%, 0.19%, and 2.27%, with a pH of 3.70; and 7.41%, -11.16%,
22.27%, 58.77%, 3.51%, 19.19%, and 58.27%, with a pH of 3.70, respectively. These percentages indi- cate the increase in the fenitrothion peak current.
The most interfering pesticide was chlorothalonil (2.372×10⁻⁴ A), and the most interfering heavy metal was Cd (6.399×10⁻⁴ A). These interfering substances can be corrected using the standard addition method.
Using an electrode that is effective in detecting fen- itrothion, two applications were conducted. The first was the examination of the pesticide in a live plant (Monochoria korsakowii Regel et Maack).
After spiking 20 mgL-1 of fenitrothion in the water where the plant had been raised, the water and the plant were left alone for about a day. A higher con- centration, 50-mgL-1 fenitrothion, was then used to spike the same water, and about another day was allowed to pass. About two days later, fenitrothion was directly detected in the live plant with peak current of 0.24 (±0.0026)×10-6A (RSD 6.05%) at a repeatability rate of 5. The working electrode was inserted in the plant without destroying or damag- ing its tissue using three wire-type electrode sys- tems. The results of this procedure are shown in
Fig. 3b. As in all the detection procedures that had been conducted, the peak current was observed at around 0.3 V, with an initial potential of -0.9 V, a final potential of 1.1, an increment of 0.01 V, an amplitude of 0.015A, a frequency of 556 Hz, and a sensitivity of 1e-4 AV-1. This indicates that the detection of fenitrothion is possible with the use of the pencil-type electrode. The next application was carried out using a live carp brain with an initial potential of -0.9 V, a final potential of 1.1 V, an increment of 0.01 V, an amplitude of 0.15, a frequency of 556 Hz, a deposition time of 150 sec, and a sen- sitivity of 1e-6 AV-1. Preparation for this detection procedure was the same as that in the application using a live plant. A total of 70-mgL-1 fenitrothion was used to spike the water where a carp had been living. Three electrodes (standard electrode, auxiliary electrode, and working electrode) were implanted in both sides of the carp’s chest and head, respec- tively. The results of this procedure are also shown in Fig. 3c, specifically peak potential was obtained with the same peak sharp at repeatability rate of 3.
Fig.3. (a) SW stripping voltammograms of fenitrothion at various concentrations of 10, 20, 40, 60, 80, 100, 125, 154, and 180 ngL-1. (b) An application using a live plant, with different fenitrothion concentrations of 20 and 50 mgL-1. (c) An application using live fish brain, with different concentrations of 20 and 50 mgL-1.
The peak current shown in the figure is around 0.3 V, which is the same as in the other detection proce- dures conducted about two days later. The SW sig- nal was obtained directly from the live fish’s brain.
However, fenitrothion peaks in any other pond could not be obtained.
CONCLUSIONS
The optimum conditions for determining and analyzing fenitrothion concentrations were sought using the pencil-type electrode, whose signal was shown to be more sensitive than that when com- mon voltammetry methods are used. Optimum conditions derived from the experimental results were as follows: a pH strength of 3.70 with 0.1-M NH4H2PO4; an SW frequency of 500 Hz; an SW amplitude of 0.1 V; an increment potential of 0.005 V; an initial accumulation potential of -0.9 V; and a deposition time of 500 sec. A low range of 10~150 ngL-1 fenitrothion was obtained. Under the optimum conditions for analysis, the detection limit was determined to be 6.0 ngL-1, with a 0.29%
relative error. It can be said that the method used in this paper is much more effective than other methods used in monitoring fenitrothion because detection was carried out with no direct destruc- tion of tissue. The results of this study can find application in clinical science, electrochemistry, and other fields.
Acknowledgements. This work was supported by grant No.(R01-2003-000-10530-0) from Minis- try of Science & Technology.
REFERENCES
1. Baldwin, R. T.; Martin, S. P. Toxico. Applied Pharmaco.
2004, 199, 118.
2. Leandro, C. C.; Hancock, P.; Fussell, R. J.; Keely, B. J.
J. Chromatogra. A.2006, 1103, 94.
3. Caboni, P.; Sherer, T. B.; Zhang, N.; Taylor, G.; Na H.
M.; Greenamyre, J. T.; Casida, J. E. Chem. Res. Toxicol.
2004, 17, 1540.
4. Chen, Z.; Robison, L,; Giller, R.; Krailo, M.; Davis, M.;
Davies, S.; Shu, X. O. Int. J. Hyg. Environ. Health.
2006, 209, 31.
5. Tsai, J.; Kaye, W. E.; Bove, F. J. Int. J. Hyg. Environ.
Health. 2006, 209, 57.
6. Sohoni, P.; Lefevre, P. A.; Ashby, J.; Sumpter, J. P. J.
Applied Toxico.2001, 21, 173.
7. Roy, S.; Roy, S.; Sharma, C. B. Biomed. Chromato.
2004, 48, 648.
8. Sanchez, R.; Vazquez, A.; Altamirano, J. V.; Villen, J.
J. Sci. Food. Agric. 2006, 86, 129.
9. Sabater, C.; Carrasco, J. M. Environ. Toxicol.2001, 16, 10. Jimenez, J. J.; Bernal, J. L.; Nozal, M. J. D.; Arias, E.;314.
Bernal, J. Rapid Commun. Mass Spectrome. 2004, 18, 657.
11. Diaz, A. N.; Pareja, A. G.; Sanchez, F. G. Pestic. Sci.
1997, 49, 56.
12. Deger, A. B.; Gremm, T. J.; Frimmel, F. H. Acta Hydrochim. Hydrobiol.2000, 28, 292.
13. Codognoto, L.; Tanimoto, S. T.; Pedrosa, V. A.; Suf- fredini, H. B.; Machado, S. A. S.; Avaca, L. A. Elec- troanal. 2005, 00, 1.
14. Acha, V.; Meurens, M.; Naveau, H.; Agathos, S. N.
Biotech. Bioengin. 2000, 68, 473.
15. Manisankar, P.; Selvanathan, G.; Viswanathan, S.; Prabu, H. G. Electroanal. 2002, 14, 1722.
16. Diaz, T. G.; Cabanillas, A. G.; Salinas, F. Electroanal.
1999, 12, 616.
17. Garrido, E. M.; Lima, J. L. F. C.; Matos, C. D.; Borges, M. F. M.; Brett, A. M. O. Electroanal.2001, 13, 199.
18. Shi, H,; Zhao, Z.; Song, Z.; Huang, J.;Yang, Y.; Anzai, J.; Chen, T. O. Q. Electroanal. 2005, 17, 1285.
19. Lin, M. S.; Wang, J. S. Electroanal. 2004, 16, 904.
20. Snejdarkova, M.; Svododova, L.; Nikolelis, D. P.; Wang, J.; Hianik, T. Electroanal. 2003, 15, 1185.
21. Koblizek, M.; Masojidek, J.; Komenda, J.; Kucera, T.;
Pilloton, R.; Matto, A. K.; Giardi, M. T. Biotech. Bioeng.
1998, 60, 664.
22. Espinosa, M.; Atanasov, P.; Wikins, E. Electroanal. 1999, 1055.
23. Bond, A. M.; Mahon, P. J.; Schiewe, J.; Victoria, V. B.
Anal. Chim. Acta. 1997, 645, 67.
24. Masawat, P.; Liawruangrath, S.; Vaneesorn, Y.; Liawru- angrath, B. Talanta. 2002, 58, 1221.
25. Perdicakis, M. Aubriet, H.; Walcarius, A. Electroanal.
2004, 16, 2042.
26. Vestergard, M.; Kerman, K.; Tamiya, E. Analytica Chim- ica Acta, 2005, 538, 273.
27. Gao, W.; Song, J.; Wu, N. J. Electroanal. Chem. 2005, 5746, 1.
28. Mousty, C. Applied Clay Science, 2004, 27, 159.
29. Wang, J.; Hocevar, S. B.; Ogorevc, B. Electrochem.
Commun. 2004, 6,176.
30. Korbut, O.; Buckova, M.; Tarapcik, P.; Labuda, J.; Grun-
dler, P. Electroanal. Chem.2001, 506, 143.
31. Radi, A. Talanta, 2005, 68, 271.
32. Ly, S. Y. Bioelectrochem. 2005, 68, 232.