• 검색 결과가 없습니다.

Serum Adipocytokines Levels and Their Association with Insulin Sensitivity in Morbidly Obese Individuals Undergoing Bariatric Surgery

N/A
N/A
Protected

Academic year: 2021

Share "Serum Adipocytokines Levels and Their Association with Insulin Sensitivity in Morbidly Obese Individuals Undergoing Bariatric Surgery"

Copied!
10
0
0

로드 중.... (전체 텍스트 보기)

전체 글

(1)

Serum Adipocytokines Levels and Their Association with Insulin Sensitivity in Morbidly Obese Individuals Undergoing Bariatric Surgery

Astha Sachan

1

, Archna Singh

1

, Sakshi Shukla

1

, Sandeep Aggarwal

2

, Ishfaq Mir

1

, Rakhee Yadav

1,

*

Departments of

1

Biochemistry and

2

Surgical Disciplines, All India Institute of Medical Sciences, New Delhi, India

Background: Obese adipose tissue secretes a variety of adipocytokines that act as metabolic regulators with complex mechanisms. Our objective was to compare serum concentration of a panel of adipocytokines be- tween obese and non-obese individuals and identify any distinct patterns correlating with insulin sensitivity in obesity.

Methods: We designed a cross-sectional study among obese (body mass index [BMI] ≥30 kg/m

2

, n=62) and non-obese (BMI <25 kg/m

2

, n=32) individuals to compare circulating levels of the adipokines, such as adipo- nectin and resistin in conjunction with the measurement of the levels of inflammatory cytokines including C-re- active protein (CRP), interleukin (IL)-6, IL-8, monocyte chemoattractant protein (MCP)-1, and tumor necrosis fac- tor (TNF)-α using Luminex multiplex immunoassay with drop array technology. Correlations between circulat- ing adipocytokine levels and those of multiple well-established markers of insulin resistance including homeo- static model assessment of insulin resistance (HOMA-IR), homeostatic model assessment of β-cell function (HOMA-β) and quantitative insulin sensitivity check index were also established.

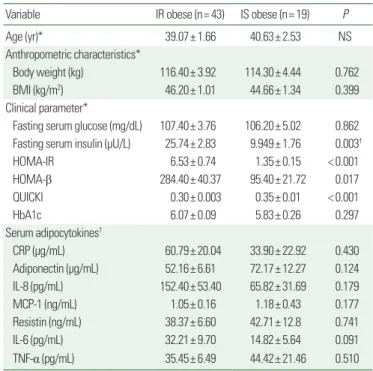
Results: CRP, IL-8, MCP-1, and TNF-α levels were higher in obese than non-obese individuals; the CRP and IL-8 differences were statistically significant. CRP correlated significantly with markers of insulin resistance (fasting plasma insulin, HOMA-IR, and QUICKI), and adiponectin correlated with HOMA-β in obese individuals. We divid- ed the group of obese individuals on the basis of HOMA-IR levels into insulin-resistant (IR; HOMA-IR ≥2.5) and insulin-sensitive (IS; HOMA-IR <2.5) groups; and 43 out of 62 participants were IR despite comparable BMIs. An overall proinflammatory profile was compared between IR and IS obese, though the values were higher in IR obese but the difference was not significant.

Conclusion: Obesity is associated with a general inflammatory milieu and a crosstalk between adipocytokines and insulin resistance is complex as well as multifactorial.

Key words: Obesity, Insulin resistance, Adipocytokines, Inflammation

Received August 21, 2020 Reviewed September 29, 2020 Accepted October 29, 2020

* Corresponding author Rakhee Yadav

https://orcid.org/0000-0002-4405-9595 Department of Biochemistry, All India Institute of Medical Sciences, New Delhi 110029, India

Tel: +91-8826640014 E-mail: [email protected]

INTRODUCTION

The rising incidence and prevalence of overweight and obesity are posing a major challenge to chronic disease prevention and public health across countries.

1

Despite significant advances in our understanding of the underlying mechanisms of weight gain and associated comorbidities like insulin resistance and cardiovascular

risk, the prevalence of obesity and metabolic syndrome is escalat- ing at an unprecedented rate.

2

Worldwide, obesity has nearly tripled since 1975. Presently, the majority of the world’s population lives in countries in which obesity is responsible for more fatalities than malnutrition and underweight status.

3

Overweight conditions and obesity, defined as a body mass index (BMI) of ≥ 30 kg/m

2

, had highest prevalence (42.4%) in the United States in 2017–2018.

4

In-

Copyright © 2020 Korean Society for the Study of Obesity

This is an Open Access article distributed under the terms of the Creative Commons Attribution Non-Commercial License (https://creativecommons.org/licenses/by-nc/4.0/) which permits unrestricted non-commercial use, distribution, and reproduction in any medium, provided the original work is properly cited.

2017-03-16 https://crossmark-cdn.crossref.org/widget/v2.0/logos/CROSSMARK_Color_square.svg

(2)

dia is also witnessing a mounting prevalence of these conditions as more than 135 million individuals are affected by obesity,

5

particu- larly abdominal obesity. Additionally, Asians often display higher fat percentages at similar BMIs when compared to their counter- parts from the western world.

6

The genesis of the adipose tissue dysfunction in obesity is com- plex. A review of the scientific literature suggests that in response to changes in the nutritional cues in the setting of varied genetic and environmental factors, the adipose tissue undergoes dynamic re- modelling.

2

This is evident in terms of quantitative and qualitative alterations in the population of adipocytes, thereby placing these cells under an immense metabolic and oxidative stress.

2

This re- modeling in adipose tissue is closely related to the changes in tissue functions like alterations in adipokine secretion, local hypoxia and adipocyte death, inflammation and worsening of metabolic health.

7

Active secretion of a variety of adipocytokines, which modulate metabolic homeostasis, has been observed in obesity.

8

These adi- pocytokines are measurable in the circulation and have been known to impart a systemic low-grade chronic inflammation pro- file to obese and overweight individuals. Adoption of a more com- prehensive term, “meta-inflammation” or metabolically triggered inflammation, has been suggested which points towards the genesis of the inflammation.

9

This inflammation is considered to be the major risk factor for the development of obesity-related comorbidi- ties like insulin resistance and cardiovascular diseases.

10

Many population-based studies performed to date have broadly stressed that an imbalance of pro- and anti-inflammatory adipocy- tokines impacts the metabolic outcomes in obesity in terms of as- sociated comorbidities.

7

However, the studies have not reported the levels of individual adipocytokines in obesity and metabolic syndrome consistently. This has made interpretation difficult, and the underlying reasons seem more complex than expected.

11,12

An understanding of the inflammatory and metabolic crosstalk of the cytokines in the trajectory of obesity needs further exploration.

Therefore, we designed our study to compare the levels of adipo- cytokines in morbidly obese individuals undergoing bariatric sur- gery with those of non-obese individuals. We used a multiplexed array of the most potent adipokines known to affect insulin sensi- tivity, i.e., adiponectin and resistin, and other serum inflammatory cytokines like C-reactive protein (CRP), interleukins (IL)-6 and -8,

monocyte chemoattractant protein (MCP)-1 and tumor necrosis factor (TNF)-α. We chose the Luminex multiplex immunoassay in combination with drop array technology for our study considering its advantages over conventional enzyme-linked immunosorbent assay (ELISA).

13,14

Modulation of inflammatory status in obesity seems fundamen- tal to its complex relationship with insulin response. Thus, by using the calculated parameters of insulin sensitivity including homeo- static model assessment of insulin resistance (HOMA-IR),

15

the marker of homeostatic model assessment of β-cell function (HOMA-β)

16

and the quantitative insulin sensitivity check index (QUICKI),

17

we aimed to establish an association between circu- lating adipocytokines and insulin sensitivity in obesity.

METHODS Study design and participant recruitment

We designed an exploratory cross-sectional study in which par- ticipants were recruited through the elective surgery schedule of the Department of Surgical Disciplines (Laparoscopic and Bariatric Surgery), All India Institute of Medical Sciences (AIIMS), New Del- hi. We included 62 adult individuals with obesity (BMI ≥30 kg/m

2

) who were admitted for undergoing bariatric surgery. The control group included 32 non-obese (BMI < 25 kg/m

2

) adult individuals undergoing other surgeries with associated disease conditions. These included laparoscopic cholecystectomy for cholelithiasis and inci- sional hernia repair. Individuals younger than 18 years and older than 60 years were excluded. We also excluded candidates diag- nosed with diabetes mellitus and concomitant acute or chronic dis- orders of the immune system. Written informed consent was ob- tained from all participants, and the study was approved by the AI- IMS Ethical Committee (A-536; IEC no. 473/01.09.2017, RP- 60/2017).

Anthropometric measurements

All subjects underwent comprehensive medical evaluation in-

cluding history and physical examination prior to surgery. The age,

sex, height (cm), weight (kg), and waist circumference (cm) were

recorded, and BMI was calculated as weight (kg)/height (m

2

) for

all participants.

(3)

Sample collection and processing

Preoperative blood samples were obtained by venipuncture after overnight fasting in participants in both study groups. Appropriate vacutainer tubes were used for the measurement of plasma glucose, insulin and serum cytokines. After centrifugation at 3,000 rpm for 15 minutes, plasma and serum were separated. Plasma was used for measuring glucose and insulin, and serum was transferred and stored in sterile Eppendorf tubes at –80°C for subsequent analysis.

Plasma glucose and insulin assays and serum glycosylated hemoglobin measurement

Plasma glucose was estimated using Randox GOD-PAP glucose estimation kit (Randox Laboratories, Crumlin, UK) according to manufacturer’s protocol.

18

Insulin was estimated using chemilumi- nescence-based immunoassay in a Liaison autoanalyzer (Diasorin, Saluggia, Italy). Serum glycosylated hemoglobin was determined using high performance liquid chromatography.

18

To test for associations between the inflammation profile and in- sulin sensitivity status of the individuals in our study, we used the well-established markers of insulin resistance HOMA-IR, HOMA-β, and QUICKI as useful indices for insulin sensitivity. These indices are calculated parameters and use the value of fasting plasma glu- cose and insulin for their determination. HOMA-IR was calculated by using the formula (HOMA-IR)=insulin (µU/mL)×[glucose (mmol/L)/22.5].

15

Low HOMA-IR (<2.5) indicated insulin sen- sitivity, and high HOMA-IR values (≥ 2.5) indicated insulin resis- tance.

18,19

We used this cutoff level of HOMA-IR to further subgroup obese individuals as insulin-sensitive (IS) and insulin-resistant (IR) and compared the inflammatory status between the two. HOMA-β was calculated as 20×insulin (µU/mL)/[glucose (mmol/L)–3.5].

16

QUICKI was calculated as 1/[log(I

0

)+log(G

0

)], where I

0

is fasting insulin (µU/mL) and G

0

is fasting glucose (mg/dL).

17

QUICKI is one of the most accurate and useful indices for determining insulin sensitivity; a value of below 0.34 suggests insulin resistance and be- low 0.30 supports the diagnosis of diabetes mellitus.

17

Serum adipocytokine assay

Serum samples were subjected to quantitative analysis of the cir- culating adipocytokines. A panel was made for measuring serum adipokines and inflammatory cytokines. This panel consisted of

adiponectin, resistin, CRP, IL-8, MCP-1, IL-6, and TNF-α. These were assayed using R&D Systems Luminex Multiplex Immunoas- say (Minneapolis, MN, USA) as per the manufacturer’s protocol in combination with Drop array technology and read in a Bio-Plex 200 reader (Bio-Rad, Hercules, CA, USA). This system makes use of xMAP magnetic bead microspheres which act as both the identi- fier and the solid surface to build the assay. In this system, multiplex immunoassays consisting of analyte-specific capture antibodies are conjugated to xMAP beads. A combination of analyzer and soft- ware for data acquisition and analysis allows higher throughput and accuracy than conventional immunoassays with sample volumes as low as 25 µL. Multiplexing also minimizes reaction to reaction in- consistencies as might be seen with a separate ELISA for each cyto- kine.

13,14

Statistical methods

To describe patient demographics and anthropometric charac- teristics and biochemical parameters, the data was summarized and analyzed using Prism version 8.0.1 (GraphPad, San Diego, CA, USA).

Data were tested for normality using Shapiro-Wilk/Kolmogorov- Smirnov test. Continuous data was expressed as mean± standard error of the mean. Student t-test was used to compare the normal- ly-distributed variables between study groups, and Mann-Whitney U-test was performed to compare the non-normally-distributed variables. A P-value of less than 0.05 was considered to be statistical- ly significant. Correlation between anthropometric characteristics and markers of insulin resistance with the levels of circulating adi- pocytokines was calculated using Spearman’s correlation coefficient.

The P-values <0.05 were considered to be statistically significant.

RESULTS Clinical characteristics of participants

Average BMI of the individuals in the obese study group was 45.76± 0.81 kg/m

2

and in the non-obese control group 24.19±

0.80 kg/m

2

. Average age of individuals in the obese and non-obese group was 39.55±1.38 and 38.91±2.63 years, respectively (Table 1).

The sex distribution was 53 females and 9 males in the obese group

and 20 females and 12 males in the non-obese group.

(4)

Biochemical parameters and markers of insulin resistance

All individuals in our study were non-diabetic, but we found sig- nificantly higher fasting plasma glucose and insulin levels in obese as compared to non-obese participants. All markers of insulin resis- tance, i.e., HOMA-IR, HOMA-β, and QUICKI, showed that the participants in the obese group were significantly more insulin-re- sistant than those in the non-obese group (Table 1). Since one of the objectives of our study was to assess how inflammatory status differed with the insulin response in obese individuals, we divided the participants in this group into IS and IR obese subgroups based on the HOMA-IR cutoff as previously mentioned in the Methods section.

18,19

Out of 62 obese individuals in our study, 43 were IR and 19 were IS (Table 2). The difference in their BMI was not sig- nificant; however, all three insulin sensitivity markers, i.e., HOMA- IR, HOMA-β, and QUICKI, showed significant differences be- tween IR and IS obese groups (Table 2).

Serum adipocytokine assay

Out of the five inflammatory cytokines that we assayed in our study, we found a higher level of CRP, IL-8, MCP-1, and TNF-α in obese as compared to non-obese individuals; the difference, how- ever, was significant only for CRP and IL-8 (Table 1). Surprisingly, IL-6 was found to be significantly lower in obese than in non-obese individuals, contrary to the data generally reported in most of the literature.

2,20

Considering the two adipokines that were part of the same array, resistin was higher and adiponectin was lower in obese participants than in non-obese ones; the differences, however, were not statistically significant (Table 1).

Our next aim was to assess how the inflammatory status with obesity changed with whole body insulin resistance. We found that neither of the adipocytokines showed a significant difference be- tween IR and IS obese groups. Overall, though, a presence of in- creased proinflammatory profile was evident for the IR obese par-

Table 1. Anthropometric characteristics, biochemical parameters and serum adi- pocytokines in obese and non-obese groups

Variable Obese (n= 62) Non-obese (n= 32) P

Age (yr)* 39.55± 1.38 38.91± 2.63 NS

Anthropometric characteristics*

Body weight (kg) 115.8± 3.06 61.14± 2.01 < 0.001 BMI (kg/m

2

) 45.76± 0.81 24.19± 0.70 < 0.001 Clinical parameter*

Fasting plasma glucose (mg/dL) 107.1± 3.02 95.26± 2.81 0.006 Fasting plasma insulin (μU/L) 21.86± 2.36 10.73± 1.67 < 0.001

HOMA-IR 5.38± 0.65 2.17± 0.24 < 0.001

HOMA-β 242.4± 33.45 115.3± 18.56 0.001

QUICKI 0.31± 0.00 0.48± 0.12 0.035

Serum adipocytokine

CRP (μg/mL) 52.56± 15.55 34.05± 19.09 0.006

Adiponectin (μg/mL) 39.88± 4.17 44.09± 7.33 0.593

IL-8 (pg/mL) 25.80± 38.45 36.39± 6.45 0.025

MCP-1 (ng/mL) 1.090± 0.17 0.75± 0.05 0.063

Resistin (ng/mL) 39.70± 5.98 36.53± 5.86 0.707

IL-6 (pg/mL) 26.88± 6.99 37.72± 32.72 < 0.001

TNF-α (pg/mL) 38.20± 7.88 23.05± 3.63 0.084

Values are presented as mean± standard error of the mean.

The P-values obtained by using *Student t-test (unpaired) for parametric;

Mann-Whit- ney U-test for non-parametric variables between two groups (P< 0.05 is considered significant).

NS, not significant; BMI, body mass index; HOMA-IR, homeostatic model assessment of insulin resistance; HOMA-β, homeostatic model assessment of β-cell function;

QUICKI, quantitative insulin sensitivity check index; CRP, C-reactive protein; IL, interleu- kin; MCP, monocyte chemoattractant protein; TNF, tumor necrosis factor.

Table 2. Anthropometric characteristics, biochemical parameters and serum adi- pocytokines in IR obese and IS obese subgroups

Variable IR obese (n= 43) IS obese (n= 19) P

Age (yr)* 39.07± 1.66 40.63± 2.53 NS

Anthropometric characteristics*

Body weight (kg) 116.40± 3.92 114.30± 4.44 0.762

BMI (kg/m

2

) 46.20± 1.01 44.66± 1.34 0.399

Clinical parameter*

Fasting serum glucose (mg/dL) 107.40± 3.76 106.20± 5.02 0.862 Fasting serum insulin (μU/L) 25.74± 2.83 9.949± 1.76 0.003

HOMA-IR 6.53± 0.74 1.35± 0.15 < 0.001

HOMA-β 284.40± 40.37 95.40± 21.72 0.017

QUICKI 0.30± 0.003 0.35± 0.01 < 0.001

HbA1c 6.07± 0.09 5.83± 0.26 0.297

Serum adipocytokines

CRP (μg/mL) 60.79± 20.04 33.90± 22.92 0.430

Adiponectin (μg/mL) 52.16± 6.61 72.17± 12.27 0.124 IL-8 (pg/mL) 152.40± 53.40 65.82± 31.69 0.179

MCP-1 (ng/mL) 1.05± 0.16 1.18± 0.43 0.177

Resistin (ng/mL) 38.37± 6.60 42.71± 12.8 0.741

IL-6 (pg/mL) 32.21± 9.70 14.82± 5.64 0.091

TNF-α (pg/mL) 35.45± 6.49 44.42± 21.46 0.510

Values are presented as mean± standard error of the mean.

The P-values obtained by using *Student t-test (unpaired) for parametric;

Mann-Whit- ney U-test for non-parametric variables between two groups (P< 0.05 is considered significant).

IR, insulin-resistant; IS, insulin-sensitive; NS, not significant; BMI, body mass index;

HOMA-IR, homeostatic model assessment of insulin resistance; HOMA-β, homeostatic

model assessment of β-cell function; QUICKI, quantitative insulin sensitivity check in-

dex; HbA1c, glycosylated hemoglobin; CRP, C-reactive protein; IL, interleukin; MCP,

monocyte chemoattractant protein; TNF, tumor necrosis factor.

(5)

ticipants due to their higher levels of CRP, IL-8, and IL-6 than the IS obese group participants. This finding suggests that despite be- ing non-diabetic clinically, 43 out of 62 of the IR obese individuals presented with a proinflammatory profile (Table 2). Those in this group are at higher risk of developing metabolic and cardiovascular complications.

Correlation of inflammatory profile of obese with anthropometric characteristics and markers of insulin resistance

The analysis of correlations was done using Spearman’s correla- tion coefficient because many variables were not normally-distrib- uted in different groups. Out of the cytokines studied, IL-8 corre- lated significantly with BMI of obese (r= 0.215, P=0.04) and IS Table 3. Correlations among circulating adipocytokines, anthropometric characteristics and markers of insulin resistance in obese individuals undergoing bariatric surgery

Variable Weight BMI Fasting plasma

glucose Fasting plasma

insulin QUICKI HOMA-IR HOMA-β HbA1c

CRP –0.099 0.030 –0.035 0.289* –0.239* 0.382

0.150 0.038

Adiponectin –0.145 –0.051 0.305* 0.034 –0.204 0.251* –0.134 –0.042

IL-8 0.132 0.215* 0.078 0.008 –0.018 0.203 –0.001 0.122

MCP-1 –0.010 0.104 –0.099 0.043 0.005 –0.018 0.053 –0.049

Resistin 0.004 –0.175 –0.137 –0.012 0.115 –0.106 0.082 –0.177

IL-6 0.016 0.069 –0.205 0.104 –0.061 0.081 0.153 0.186

TNF-α –0.107 0.015 0.262* 0.118 –0.136 0.185 –0.082 0.054

Spearman correlation coefficient represented as r-value: *P< 0.05;

P< 0.01.

BMI, body mass index; QUICKI, quantitative insulin sensitivity check index; HOMA-IR, homeostatic model assessment of insulin resistance; HOMA-β, homeostatic model assess- ment of β-cell function; HbA1c, glycosylated hemoglobin; CRP, C-reactive protein; IL, interleukin; MCP, monocyte chemoattractant protein; TNF, tumor necrosis factor.

Table 4. Correlations among circulating adipocytokines with anthropometric characteristics and markers of insulin resistance in IR and IS obese individuals undergoing bariatric surgery

Variable Weight BMI Fasting plasma

glucose Fasting plasma

insulin QUICKI HOMA-IR HOMA-β HbA1c

CRP

IR –0.010 0.013 0.081 0.282* –0.306* 0.380

0.104 0.016

IS –0.308 0.046 –0.365 0.039 0.281 0.678

–0.034 0.025

Adiponectin

IR –0.158 - 0.503

–0.063 –0.171 0.160 –0.323* 0.004

IS –0.134 –0.301 –0.344 0.164 –0.277 0.545* 0.433 0.088

IL-8

IR 0.018 0.040 0.113 –0.145 0.084 - –0.101 0.206

IS 0.394 0.483* –0.049 –0.048 0.288 0.165 0.010 –0.177

MCP-1

IR –0.107 0.003 –0.161 –0.069 0.120 –0.112 0.053 –0.085

IS 0.188 0.369 0.157 –0.090 0.327 –0.006 –0.174 -0.060

Resistin

IR –0.204 –0.419

–0.176 0.032 0.103 –0.024 0.146 –0.146

IS 0.532* 0.564* 0.085 0.129 0.145 –0.062 0.111 –0.155

IL-6

IR 0.031 - –0.156 –0.012 –0.007 –0.025 0.125 0.204

IS –0.075 0.087 –0.436* –0.020 0.410 –0.504* 0.192 0.018

TNF-α

IR –0.157 –0.009 0.312* –0.130 0.053 0.058 –0.206 0.093

IS 0.025 –0.079 0.091 0.453 –0.233 0.229 0.129 –0.074

Spearman correlation coefficient represented as r-value: *P< 0.05;

P< 0.01.

IR, insulin-resistant; IS, insulin-sensitive; BMI, body mass index; QUICKI, quantitative insulin sensitivity check index; HOMA-IR, homeostatic model assessment of insulin resistance;

HOMA-β, homeostatic model assessment of β-cell function; HbA1c, glycosylated hemoglobin; CRP, C-reactive protein; IL, interleukin; MCP, monocyte chemoattractant protein; TNF,

tumor necrosis factor.

(6)

obese individuals (r= 0.483, P=0.02). Only CRP correlated signif- icantly with fasting insulin, HOMA-IR and QUICKI in obese and IR obese individuals. Also, CRP was the only cytokine that corre- lated significantly with HOMA-IR in obese (r= 0.382, P=0.002), IR obese (r= 0.380, P=0.006) and IS obese (r=0.678, P=0.009) groups and subgroups respectively. There was also a significant positive correlation between TNF-α and fasting plasma glucose in the obese group (r=0.262, P=0.02) and IR obese groups (r=0.312, P=0.02) (Tables 3 and 4). Therefore the overall proinflammatory milieu in obesity correlated significantly with insulin resistance.

With respect to the two adipokines studied in our participants, adiponectin correlated significantly with pancreatic insulin secretion capacity demonstrated by its negative correlation with HOMA-β in the IR obese subgroup (r= –0.323, P=0.01) (Table 4). Resistin showed a significant positive correlation with weight (r= 0.532, P=0.014) and BMI (r=0.564, P=0.01) in the IS obese group but an unexpected negative correlation with BMI (r=–0.419, P=0.002) in the IR obese (Tables 3 and 4).

DISCUSSION

In our study, we sought to evaluate the distinct pattern of an ar- ray of circulating adipocytokines in obese as compared to non- obese individuals. We designed a cross-sectional study in which we also intended to establish a correlation between the inflammatory profile of the obese subjects and insulin response. All participants in our study were non-diabetic, but the markers of insulin resis- tance (HOMA-IR, HOMA-β, and QUICKI) significantly showed that obese individuals were more insulin-resistant than non-obese ones (Table 2). We measured two important adipokines (adipo- nectin and resistin) in all participants of our study and considered their opposite roles in mediating the insulin response; adiponectin has been implicated in increasing insulin sensitivity, and resistin has been linked to obesity with insulin resistance.

21,22

We found that obese individuals had lower adiponectin levels than non-obese ones. The preponderance of scientific evidence suggests that adi- ponectin level has an inverse association with adiposity, and higher levels of adiponectin have been observed in lean individuals.

23

In addition, many studies have shown that adiponectin level is lower in the insulin-resistant state and increases with improvement in the

insulin sensitivity associated with the weight loss.

21

We also found a lower level of adiponectin in IR obese individuals as compared to IS obese ones in our study, but the difference was not statistically significant (Table 2). However, adiponectin correlated significantly with HOMA-β in IR obese individuals, but its correlation with other markers of insulin resistance was inconclusive across the groups in our study (Tables 3 and 4). Similar observations were made in other studies, and an “adiponectin paradox” in which epi- demiological data demonstrated that increased adiponectin levels correlated with higher cardiovascular or all-cause mortality was re- ported.

24

The underlying mechanism behind this paradox is still unclear, but one hypothesis is that there may be a compensatory el- evation of adiponectin in patients with metabolic abnormalities.

This compensatory elevation may be associated with higher future mortality.

24

The other adipokine analyzed in our study was resistin which has an opposite effect as that of adiponectin in terms of insulin sen- sitivity. Experimental studies have shown that resistin increases he- patic gluconeogenesis and insulin resistance.

25

We did not find a significant difference in the levels of this adipokine in either obese vs. non-obese or IR versus IS obese groups. Population-based stud- ies have shown that the association between resistin levels and in- sulin sensitivity has been inconsistent.

24

Furthermore, resistin’s role in insulin resistance and glucose metabolism has been inconclusive in human studies.

26

The only significant correlations that we found for resistin were with weight and BMI, and those associations were only in the IS obese group. This finding is in agreement with sever- al studies reporting that increased plasma resistin levels were asso- ciated with increased BMI.

26

Apart from their opposite roles in mitigating insulin response, both adiponectin and resistin also have opposite effects on inflam- mation profiles. Adiponectin has anti-inflammatory and anti-ath- erogenic effects

21

by suppressing proinflammatory cytokines such as TNF-α and by inducing other anti-inflammatory factors.

21

How- ever, resistin has been shown to exert proinflammatory effects by increasing the production of IL-6 and TNF-α.

27

We included inflammatory cytokines in the array of adipocyto-

kines in our study and found that CRP, IL-8, MCP-1, and TNF-α

were higher in obese than non-obese participants. CRP and IL-8

level were significantly different suggesting that obesity is a chronic

(7)

inflammatory state. However, IL-6, despite being proinflammatory, was found to be significantly lower in obese than non-obese indi- viduals in our study. There are several potential explanations for this ostensibly contradictory data for the role of IL-6 in glucose metabolism and insulin action.

10

Researchers disagreed on whether IL-6 correlated with BMI, insulin levels or HOMA-IR.

28

Many ex- perimental studies have determined that there exists a fine-tuned balance between anti-and proinflammatory actions of IL-6.

29

Addi- tionally, IL-6 is produced by different organs. This may contribute to the layers of complexity associated with its actions on metabolic regulation.

10

Owing to such inconsistencies, a pleiotropic function- al profile has been suggested for IL-6.

30

Another IL measured in our study was IL-8, and we found sig- nificantly higher levels of IL-8 in obese than in non-obese individu- als. This also applied to the IR versus IS obese subgroups. IL-8 also showed a significant positive correlation with BMI in both obese and IR obese groups. Some of the recent studies have clearly dem- onstrated that higher IL-8 levels are associated with obesity.

13

IL-8 levels are also closely correlated with obesity-related parameters like BMI, waist circumference, CRP, IL-6 levels and HDL choles- terol levels.

31

One of the important and most abundant immune cells infiltrat- ing the adipose tissue in obesity are macrophages,

10

and MCP-1 is an important chemoattractant chemokine produced by adipose tis- sue mediating macrophage recruitment.

2

We found increased cir- culating levels of MCP-1 in obese individuals as compared to non- obese ones, but the difference was not statistically significant. Dahl- man et al.

32

found that expression of MCP-1 is significantly higher in obese as compared to lean individuals, but circulating levels showed no changes among their study groups suggesting that obe- sity produced only local changes of MCP-1 in adipose tissue.

There is putative evidence that an imbalance of the pro-and anti- inflammatory adipokines secreted by adipose tissue is one of the major contributors to metabolic dysfunction. However, there are inconsistencies in the outcomes of a number of human studies.

11,33

We did not find a significant difference but observed a notable trend in which classical proinflammatory cytokines like CRP, IL-8, and IL-6 were found to be higher and MCP-1 and TNF-α were para- doxically lower in IR as compared to IS obese study participants.

TNF-α has been the most consistently studied inflammatory cy-

tokine in obesity ever since its identification in the adipose tissue of obese mice. This marked the start of the metabolic inflammation concept.

10,34

TNF-α levels did not show any significant difference between the groups, but correlated significantly with fasting plasma glucose in obese and IR obese individuals in our study. Strong as- sociations have been shown in several human studies between cir- culating TNF-α and insulin resistance

35

or other metabolic compli- cations.

36

However, attempts to block TNF-α functions have never produced consistent metabolic outcomes.

10

Adipose tissue does not significantly contribute to circulating TNF-α levels.

37

In fact, the soluble forms of the receptor of TNF-α (TNFR2) is secreted from adipose tissue; this may modulate the actions of TNF-α and warrants detailed exploration.

37

Functional pleiotropy and redundancy are characteristic features of cytokines. As cytokines are produced by many different cell types, cytokines often show overlapping activities in regulating proliferation or differentiation; these regulatory activities depend on the type and developmental state of the target cells involved.

30

Collectively, the signaling of TNF-α and IL-6 in obesity-associated inflammation is complex, especially in developing concomitant in- sulin resistance, owing to their temporal and cell-type specific func- tions.

29

Considering that resistin increases IL-6 and TNF-α secre- tion along with that of other adhesion molecules,

24

we may assume that inconsistencies in resistin levels may also be responsible for unexpected results and correlations for these two cytokines.

Fundamental differences in mechanisms that regulate inflamma- tory cytokines (TNF-α, IL-6, and IL-8) and acute phase proteins like CRP may explain the inconsistency of relationships between these markers and metabolic phenotypes in morbidly obese indi- viduals.

20,28

Equally possible is that technical differences in sample collection/handling may be responsible for varying outcomes.

Of all the cytokines we studied, only CRP correlated significantly

with most of the markers of insulin resistance (HOMA-IR, QUICKI,

and fasting insulin) and had significantly higher levels in obese and

IR obese individuals. CRP is the most often measured inflammato-

ry marker and has consistently correlated with weight, BMI and

waist to hip ratio as well as insulin resistance.

2,20

CRP has become

the marker of metainflammation.

2

This may be attributed to its

crosstalk with other cytokines like TNF-α and IL-6.

2,20

Despite the

extensive characterization of the mechanisms by which inflamma-

(8)

tory cytokines promote insulin resistance and adipose tissue dys- functions, targeted immunotherapies have not yielded any positive outcome.

11

Driving forces behind changes in inflammatory markers are multifactorial. A chronology of the triggers for each of the cyto- kines that can better establish the trajectory of presentation and in- ter- and intra-individual variations is lacking.

Based on the available literature and the findings of our study, obesity is associated with a general inflammatory response that cannot be simply attributed to mere imbalance between pro- and anti-inflammatory status. A comprehensive understanding of the crosstalk between inflammation and insulin response with the quantum of effect of individual cytokines is necessary to provide a better insight into the functions of adipose tissue as an essential metabolic regulator.

CONFLICTS OF INTEREST

The authors declare no conflict of interest.

ACKNOWLEDGMENTS

This work was funded by Intramural Research Grant (Project code. A-536), by All India Institute of Medical Sciences. We thank SA for providing, and Mr. Mudassir for collecting patient samples from the Department of Surgical Disciplines. We also thank Dr.

Sivasankar Baalasubramanian (Executive Director, Indoor Biotech- nologies India Pvt. Ltd., Bangalore) for analyzing the samples for the planned array of cytokines.

AUTHOR CONTRIBUTIONS

Study concept and design: RY, SA, and AS (Archna Singh); ac- quisition of data: AS (Astha Sachan), SS, and IM; analysis and in- terpretation of data: RY and AS (Archna Singh); drafting of the manuscript: RY and AS (Astha Sachan); critical revision of the manuscript: RY, SA, and AS (Archna Singh); statistical analysis: AS (Astha Sachan); obtained funding: RY; administrative, technical, or material support: RY; and study supervision: RY.

REFERENCES

1. Hruby A, Hu FB. The epidemiology of obesity: a big picture.

Pharmacoeconomics 2015;33:673-89.

2. Phillips CL, Grayson BE. The immune remodel: weight loss- mediated inflammatory changes to obesity. Exp Biol Med (Maywood) 2020;245:109-21.

3. World Health Organization. Obesity and overweight [Inter- net]. Geneva: World Health Organization; 2020 [cited 2020 Oct 29]. Available from: https://www.who.int/news-room/

fact-sheets/detail/obesity-and-overweight

4. Centers for Disease Control and Prevention. Overweight and obesity [Internet]. Atlanta (GA): Centers for Disease Control and Prevention; 2020 [cited 2020 Oct 29]. Available from:

https://www.cdc.gov/obesity/data/adult.html

5. Ahirwar R, Mondal PR. Prevalence of obesity in India: a sys- tematic review. Diabetes Metab Syndr 2019;13:318-21.

6. Sattar N, McInnes IB, McMurray JJ. Obesity is a risk factor for severe COVID-19 infection: multiple potential mecha- nisms. Circulation 2020;142:4-6.

7. Choe SS, Huh JY, Hwang IJ, Kim JI, Kim JB. Adipose tissue remodeling: its role in energy metabolism and metabolic dis- orders. Front Endocrinol (Lausanne) 2016;7:30.

8. Wang Z, Nakayama T. Inflammation, a link between obesity and cardiovascular disease. Mediators Inflamm 2010;2010:

535918.

9. Hotamisligil GS. Inflammation and metabolic disorders. Na- ture 2006;444:860-7.

10. Cao H. Adipocytokines in obesity and metabolic disease. J Endocrinol 2014;220:T47-59.

11. Rakotoarivelo V, Lacraz G, Mayhue M, Brown C, Rottem- bourg D, Fradette J, et al. Inflammatory cytokine profiles in visceral and subcutaneous adipose tissues of obese patients undergoing bariatric surgery reveal lack of correlation with obesity or diabetes. EBioMedicine 2018;30:237-47.

12. Zhang C, Zhang J, Liu Z, Zhou Z. More than an anti-diabetic bariatric surgery, metabolic surgery alleviates systemic and lo- cal inflammation in obesity. Obes Surg 2018;28:3658-68.

13. Harakeh S, Kalamegam G, Pushparaj PN, Al-Hejin A, Alfadul

SM, Al Amri T, et al. Chemokines and their association with

(9)

body mass index among healthy Saudis. Saudi J Biol Sci 2020;

27:6-11.

14. Dalmas E, Rouault C, Abdennour M, Rovere C, Rizkalla S, Bar-Hen A, et al. Variations in circulating inflammatory fac- tors are related to changes in calorie and carbohydrate intakes early in the course of surgery-induced weight reduction. Am J Clin Nutr 2011;94:450-8.

15. Matthews DR, Hosker JP, Rudenski AS, Naylor BA, Treacher DF, Turner RC. Homeostasis model assessment: insulin resis- tance and beta-cell function from fasting plasma glucose and insulin concentrations in man. Diabetologia 1985;28:412-9.

16. Sung KC, Reaven GM, Kim SH. Utility of homeostasis mod- el assessment of beta-cell function in predicting diabetes in 12,924 healthy Koreans. Diabetes Care 2010;33:200-2.

17. Katz A, Nambi SS, Mather K, Baron AD, Follmann DA, Sul- livan G, et al. Quantitative insulin sensitivity check index: a simple, accurate method for assessing insulin sensitivity in humans. J Clin Endocrinol Metab 2000;85:2402-10.

18. Vincent V, Thakkar H, Aggarwal S, Mridha AR, Ramakrishnan L, Singh A. ATP-binding cassette transporter A1 (ABCA1) expression in adipose tissue and its modulation with insulin resistance in obesity. Diabetes Metab Syndr Obes 2019;12:

275-84.

19. Singh Y, Garg MK, Tandon N, Marwaha RK. A study of in- sulin resistance by HOMA-IR and its cut-off value to identify metabolic syndrome in urban Indian adolescents. J Clin Res Pediatr Endocrinol 2013;5:245-51.

20. Askarpour M, Khani D, Sheikhi A, Ghaedi E, Alizadeh S. Ef- fect of bariatric surgery on serum inflammatory factors of obese patients: a systematic review and meta-analysis. Obes Surg 2019;29:2631-47.

21. Hosseinzadeh-Attar MJ, Golpaie A, Janani L, Derakhshanian H. Effect of weight reduction following bariatric surgery on serum visfatin and adiponectin levels in morbidly obese sub- jects. Obes Facts 2013;6:193-202.

22. Steppan CM, Bailey ST, Bhat S, Brown EJ, Banerjee RR, Wright CM, et al. The hormone resistin links obesity to dia- betes. Nature 2001;409:307-12.

23. Fantuzzi G. Adiponectin and inflammation: consensus and controversy. J Allergy Clin Immunol 2008;121:326-30.

24. Choi SH, Hong ES, Lim S. Clinical implications of adipocy- tokines and newly emerging metabolic factors with relation to insulin resistance and cardiovascular health. Front Endocri- nol (Lausanne) 2013;4:97.

25. Steppan CM, Lazar MA. Resistin and obesity-associated in- sulin resistance. Trends Endocrinol Metab 2002;13:18-23.

26. Goktas Z, Moustaid-Moussa N, Shen CL, Boylan M, Mo H, Wang S. Effects of bariatric surgery on adipokine-induced in- flammation and insulin resistance. Front Endocrinol (Laus- anne) 2013;4:69.

27. Singla P, Bardoloi A, Parkash AA. Metabolic effects of obesi- ty: a review. World J Diabetes 2010;1:76-88.

28. Hafida S, Mirshahi T, Nikolajczyk BS. The impact of bariatric surgery on inflammation: quenching the fire of obesity? Curr Opin Endocrinol Diabetes Obes 2016;23:373-8.

29. Kern L, Mittenbühler MJ, Vesting AJ, Ostermann AL, Wun- derlich CM, Wunderlich FT. Obesity-induced TNFα and IL-6 signaling: the missing link between obesity and inflam- mation-driven liver and colorectal cancers. Cancers (Basel) 2018;11:24.

30. Scheller J, Chalaris A, Schmidt-Arras D, Rose-John S. The pro- and anti-inflammatory properties of the cytokine inter- leukin-6. Biochim Biophys Acta 2011;1813:878-88.

31. Kim CS, Park HS, Kawada T, Kim JH, Lim D, Hubbard NE, et al. Circulating levels of MCP-1 and IL-8 are elevated in hu- man obese subjects and associated with obesity-related pa- rameters. Int J Obes (Lond) 2006;30:1347-55.

32. Dahlman I, Kaaman M, Olsson T, Tan GD, Bickerton AS, Wåhlén K, et al. A unique role of monocyte chemoattractant protein 1 among chemokines in adipose tissue of obese sub- jects. J Clin Endocrinol Metab 2005;90:5834-40.

33. Lim S, Shin SM, Nam GE, Jung CH, Koo BK. Proper man- agement of people with obesity during the COVID-19 pan- demic. J Obes Metab Syndr 2020;29:84-98.

34. Hotamisligil GS, Shargill NS, Spiegelman BM. Adipose ex- pression of tumor necrosis factor-alpha: direct role in obesity- linked insulin resistance. Science 1993;259:87-91.

35. Hivert MF, Sullivan LM, Fox CS, Nathan DM, D’Agostino

RB Sr, Wilson PW, et al. Associations of adiponectin, resistin,

and tumor necrosis factor-alpha with insulin resistance. J Clin

(10)

Endocrinol Metab 2008;93:3165-72.

36. Berg AH, Scherer PE. Adipose tissue, inflammation, and car- diovascular disease. Circ Res 2005;96:939-49.

37. Illán-Gómez F, Gonzálvez-Ortega M, Orea-Soler I, Alcaraz-

Tafalla MS, Aragón-Alonso A, Pascual-Díaz M, et al. Obesity

and inflammation: change in adiponectin, C-reactive protein,

tumour necrosis factor-alpha and interleukin-6 after bariatric

surgery. Obes Surg 2012;22:950-5.

수치

Table 1. Anthropometric characteristics, biochemical parameters and serum adi- adi-pocytokines in obese and non-obese groups
Table 4. Correlations among circulating adipocytokines with anthropometric characteristics and markers of insulin resistance in IR and IS obese individuals undergoing  bariatric surgery

참조

관련 문서

Results: In this research, there were positive changes in sub-factors of body composition, cardiopulmonary endurance, and heart rate variability in obese

Changes in the level of physical fitness of obese women who performed complex exercise were significantly different in muscle endurance,

The 24hr proteinuria level were increased in kidney with cyclosporine-A group but significantly decreased in iNOS inhibitor and green tea polyphenol group..

In this study, we found that Pin1 plays a pivotal role in insulin- induced AP-1 activation through its interaction with p70S6K and prolongs activity of

In this study, platelet-derived growth factors-BB (PDGF-BB), vascular endothelial growth factor (VEGF), and insulin-like growth factor-1 (IGF-1) were quantified in the PRF

The purpose of this study was to investigate how the 8-week aerobic exercise program affects the physical strength and stress of obese women in the

Effects of combined calcium and vitamin D supplementation on insulin secretion, insulin sensitivity and β -cell function in multi-ethnic vitamin D-deficient

In our study, however, change in abdominal visceral fat remained associated with future pulse pressure after adjusting for HOMA-IR and fasting plasma glucose, implying