This is an Open Access article distributed under the terms of the Creative Commons At- tribution Non-Commercial License (http://creativecommons.org/licenses/by-nc/3.0/) which permits unrestricted non-commercial use, distribution, and reproduction in any medium, provided the original work is properly cited.
The Effects of Small Sized Rice Bowl on Carbohydrate Intake and Dietary Patterns in Women with Type 2 Diabetes
Hee-Jung Ahn1,*, Yu-Kyung Eom2,*, Kyung-Ah Han3, Hwi-Ryun Kwon1, Hyun Jin Kim3, Kang Seo Park3, Kyung-Wan Min3
1Diabetes Center, Eulji Hospital, Seoul,
2Korea Diabetes Clinical Reasearch Center, Seoul,
3Department of Internal Medicine, Eulji University School of Medicine, Daejeon, Korea
Background: The main source of carbohydrate in the Korean diet is rice, which is usually served in a rice bowl. This study inves- tigated the impact of a meal plan using smaller rice bowls on dietary energy intake and macronutrient composition in overweight or obese patients with type 2 diabetes mellitus.
Methods: A total of 67 women with type 2 diabetes were enrolled in our study. We divided these participants into three groups: a normal-weight group (NW; body mass index [BMI] < 23 kg/m2; n = 17), an overweight group (OW; 23 ≤ BMI < 25 kg/m2; n = 24) and an obese group (OB; BMI ≥ 25 kg/m2; n = 26). Three-day dietary records were analyzed for total energy intake (TEI) and macronutrient composition both before enrollment and two weeks after patients received instruction in a dietary plan based on using a small (200 mL) rice bowl.
Results: After the intervention, TEI decreased in the OW and OB groups. Decreased carbohydrate (NW, -4 ± 5%; OW, -4 ± 5%;
OB, -3 ± 6%) and increased fat intakes were found in all three groups, which complies with Korean Diabetes Association recom- mendations. The protein proportion of TEI significantly increased only in the OW group. Body weight decreased both in the OW and OB groups.
Conclusion: A short-term, small-rice-bowl-based meal plan was effective for body weight control and macronutrient balance in overweight or obese women in Korea with type 2 diabetes.
Keywords: Carbohydrate restriction; Diabetes mellitus, type 2; Diabetic diet
Corresponding author: Kyung-Wan Min
Diabetes Center, Eulji Hospital, 280-1 Hagye 1-dong, Nowon-gu, Seoul 139-872, Korea
E-mail: [email protected]
INTRODUCTION
The carbohydrate proportion of total energy intake of Korean and Americans are 64.5%, 51.7%, respectively (National Health and Nutrition Examination Survey) [1]. Usually Koreans con- sume high intake of carbohydrate than Americans. According to the Korea Health and Nutrition Examination Survey (KHA–
NES), carbohydrate proportion of total energy intake in Kore- an with type 2 diabetes was 68% which is above the carbohy- drate recommendations of Korean Diabetes Association (KDA);
55 to 60% [2,3]. Yang and Kim [4] reported that diabetes pa- tients consume more carbohydrates than individuals without diabetes, and Jung et al. [5] also pointed out that reducing car- bohydrate intake may decrease risk factors of cardiovascular disease in the adults.
Another study reported that carbohydrate intake affects blood glucose; excessive intake leads to obesity by promoting appetitite and the secretion of insulin, which increase body fat [6,7]. Hollenbeck et al. [8] revealed that when type 2 diabetes patients increase carbohydrate proportion of total energy in- pISSN 1976-9180 · eISSN 2093-2650
take from 50% to 60%, both triglyceride and postprandial blood glucose levels rise, and the higher blood glucose was difficult to control even after administration of more insulin in Koreans.
The traditional Korean rice-based diet includes numerous side dishes, because rice itself is bland. Korean side dishes tend to have strong tastes, such that they are difficult to eat without rice [9]. Therefore, the total energy intake for Koreans who eat a rice-based diet is dependent on the absolute amount of rice consumed [10]; decreasing rice intake by recommending the use of smaller rice bowls can influence total energy intake.
Ahn et al. [11] found that type 2 diabetes patients ate rice- based meals an average of 19.9 ± 2.3 times per week; the amount of rice intake was related to the sizes of the rice bowl used by patients. A 380-mL rice-bowl-based meal plan, which is most frequently used for type 2 diabetes patients in Korea, has already been reported to be as effective in controlling carbohydrate, protein and fat intake as food exchange system-based meal plans [12]. However, it is still unknown how dietary intake pat- terns affect obesity when patients with type 2 diabetes use small- er rice bowls.
This was a preliminary study to investigate the clinical effects of a small–rice-bowl-based meal plan in Korean type 2 diabe- tes patients. We examined the effects of short-term changes in carbohydrate and total energy intake through meals and snacks according to obesity by decreasing only rice bowl size.
METHODS
Participants
We recruited women with type 2 diabetes who visited the Dia- betes Center of Eulji Hospital located in the Seoul from July 2009 to August 2009. The study participants included a total of 67 women aged 20 to 69 years with glycosylated hemoglobin (HbA1c) levels between 7% and 11%. Patients who had any special dietary habit (i.e., a vegetarian diet), gestational diabe- tes, malignant tumors, been treated with renal replacement therapy, secondary diabetes, or were difficult to follow-up, re- fused examination, ate meals at restaurants more the two times per week, and had dyspepsia or anorexia were excluded from our sample.
The participants were divided by body mass index (BMI) score into a normal weight (NW) group (BMI < 23 kg/m2, n = 17), an overweight (OW) group (23 kg/m2 ≤ BMI < 25 kg/m2, n = 24) and an obese (OB) group (BMI ≥ 25 kg/m2, n = 26), and their data were analyzed and compared.
Education
Rice bowls (Seonsu Chinaware, Seoul, Korea) of 200 mL that hold about 200 kcal of rice were given to all participants, and each received five minutes of individualized education on tips for putting rice in the bowl and for utilizing the bowl. The par- ticipants were informed that the rice bowl should be used for every meal and that no more rice should be eaten than would fit in the bowl. An informational leaflet was provided to inform participants that other sources of carbohydrate, such as bread, rice cake, potato and sweet potato should also be limited. Edu- cation regarding daily fruit intake was also provided through a leaflet.
Survey of bowl size
The participants were asked to bring the rice bowl they usually used to their meals. Because the sizes and shapes of bowls dif- fered among participants, the sizes were determined by mea- suring the volume of water contained in the bowl with 100 mL and 500 mL measuring cylinders.
Dietary nutrient intake and patterns
To compare and analyze changes of energy intake during the study that resulted from meals and snacks, any foods that could be classified as fruit or dairy in the food exchange system (Ko- rean Diabetes Association, Korean Dietetic Association, Kore- an Nutrition Society, 1994) and also those taken between meals were defined as snacks. The intake of meals and snacks was gauged using a three-day dietary record (two weekdays and one weekend day). A simple preliminary education on how to record meals and snacks was provided to help participants un- derstand how to record food intake. Types and amount of all foods eaten each day were recorded; participants divided their intake into meals or supplementary foods and snacks. To in- crease the accuracy of these three-day food records, nutrition- ists reviewed examples using life-sized food models, measur- ing cups, measuring spoons, and data on eye measurement of foods (Korean Dietetic Association, 1999) with participants when the record sheet was returned. The contents of the records were analyzed with CAN-Pro version 2.0 (Computer-Aided Nutritional Analysis Program; Korean Nutrition Society, Seoul, Korea) and then translated into nutrient intake data.
As dietary energy intake differed according to obesity, the ratio of dietary energy intake to recommended energy intake was calculated and assessed for each patient. The recommend- ed energy intake was obtained by multiplying the ideal body
weight by 30 kcal/kg [13]. To observe dietary patterns and plac- es for meals eaten on weekdays and weekends, the total num- ber of meals, the number of meals consisting of rice and side dishes, and places where the participants ate the meals were in- vestigated [14,15], and patients showing unusual dietary ener- gy patterns (e.g., birthday party) were excluded from this study.
Physical measurements and biochemical tests
Heights and body weights of all participants were measured at the beginning of the study and again following the 2-week.
Height and body weight measurements were take in light clothing (no outerwear), and BMI was calculated by dividing the body weight (kg) with the square of the height (m2).
HbA1c was measured with high-performance liquid chroma- tography (HPLC) using cation exchange resin.
Statistical analyses
All data were analyzed with the SPSS version 15.0 (SPSS Inc., Chicago, IL, USA), and the means and standard deviations of all items were calculated. To investigate changes in physical characteristics for the two weeks of the study and to compare nutritient intake before and after the use of the smaller rice bowl, a paired sample t-test was used. One-way ANOVA and Duncan’s post hoc tests were used to compare the three patient groups. A P value of less than 0.05 was considered to be statis- tically significant.
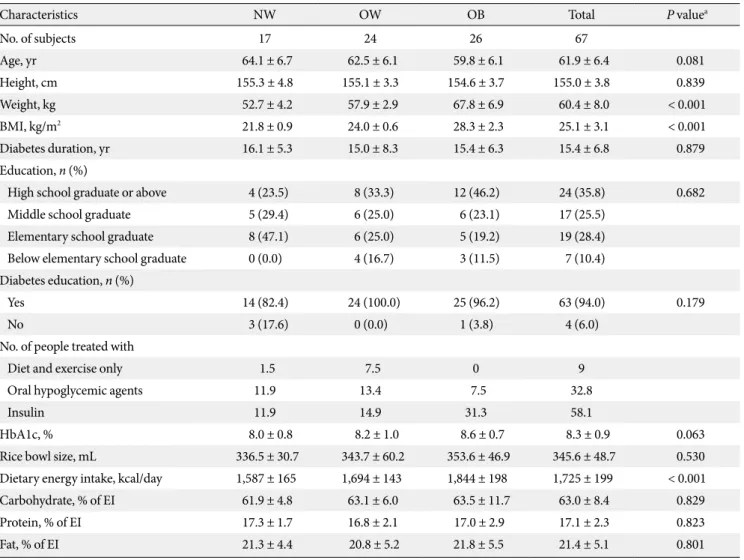
Table 1. Baseline clinical characteristics of study subjects
Characteristics NW OW OB Total P valuea
No. of subjects 17 24 26 67
Age, yr 64.1 ± 6.7 62.5 ± 6.1 59.8 ± 6.1 61.9 ± 6.4 0.081
Height, cm 155.3 ± 4.8 155.1 ± 3.3 154.6 ± 3.7 155.0 ± 3.8 0.839
Weight, kg 52.7 ± 4.2 57.9 ± 2.9 67.8 ± 6.9 60.4 ± 8.0 < 0.001
BMI, kg/m2 21.8 ± 0.9 24.0 ± 0.6 28.3 ± 2.3 25.1 ± 3.1 < 0.001
Diabetes duration, yr 16.1 ± 5.3 15.0 ± 8.3 15.4 ± 6.3 15.4 ± 6.8 0.879
Education, n (%)
High school graduate or above 4 (23.5) 8 (33.3) 12 (46.2) 24 (35.8) 0.682
Middle school graduate 5 (29.4) 6 (25.0) 6 (23.1) 17 (25.5)
Elementary school graduate 8 (47.1) 6 (25.0) 5 (19.2) 19 (28.4) Below elementary school graduate 0 (0.0) 4 (16.7) 3 (11.5) 7 (10.4) Diabetes education, n (%)
Yes 14 (82.4) 24 (100.0) 25 (96.2) 63 (94.0) 0.179
No 3 (17.6) 0 (0.0) 1 (3.8) 4 (6.0)
No. of people treated with
Diet and exercise only 1.5 7.5 0 9
Oral hypoglycemic agents 11.9 13.4 7.5 32.8
Insulin 11.9 14.9 31.3 58.1
HbA1c, % 8.0 ± 0.8 8.2 ± 1.0 8.6 ± 0.7 8.3 ± 0.9 0.063
Rice bowl size, mL 336.5 ± 30.7 343.7 ± 60.2 353.6 ± 46.9 345.6 ± 48.7 0.530
Dietary energy intake, kcal/day 1,587 ± 165 1,694 ± 143 1,844 ± 198 1,725 ± 199 < 0.001
Carbohydrate, % of EI 61.9 ± 4.8 63.1 ± 6.0 63.5 ± 11.7 63.0 ± 8.4 0.829
Protein, % of EI 17.3 ± 1.7 16.8 ± 2.1 17.0 ± 2.9 17.1 ± 2.3 0.823
Fat, % of EI 21.3 ± 4.4 20.8 ± 5.2 21.8 ± 5.5 21.4 ± 5.1 0.801
The values were mean ± standard deviation or frequency (%). Statistical significance was tested by independent t-test or chi-square test.
NW, normal weight; OB, obese; OW, overweight; BMI, body mass index; EI, energy intake; HbA1c, glycosylated hemoglobin.
aMean or frequency (%) comparison groups.
RESULTS
Participant characteristics
Our study initially included 78 patients (NW, n = 26; OW, n = 26; OB, n = 26), but after excluding those who had unusual di- etary patterns (n = 3), those who refused to participate (n = 5), and those who had two or more meals a week at restaurants (n
= 3), 67 patients were finally included as participants. There were no significant differences in the drop-out rates among the three groups. The mean age, duration of diabetes and HbA1c of the participants were 61.9 ± 6.4 years, 15.4 ± 6.8 years and 8.3 ± 0.9%, respectively, and they were not significantly differ- ent among the groups. Among our participants, 10.4% had not received formal education; educational status was not signifi- cantly different among the three groups. For diabetes treatments, the rates of using insulin, oral hypoglycemic agents and diet therapy were 58.1%, 32.8%, and 9%, respectively, and there were no significant differences among the groups for any of these variables. Ninety-four percent of our sample had received some type of diabetes education, but significant differences resulting from this education were not observed among the three groups (Table 1).
Dietary total energy intake and nutrient intake by BMI before rice bowl based meal plan
The dietary total energy intake of the participants before edu- cation was 1,725 ± 199 kcal/day, and the OW and OB groups took in significantly more dietary energy than the NW group (P < 0.001, P < 0.001, respectively). The ratio of dietary energy intake to recommended energy intake were 104 ± 10%, 111 ± 8%, and 122 ± 13% in the NW, the OW, and the OB groups, respectively; those of the OW and the OB groups were higher than that of the NW group (Table 2).
The carbohydrate, protein and fat proportion of total energy intake were 62.2%, 17.1%, and 21.4%, respectively, and the car- bohydrate proportion of total energy intake was higher than the 55 to 60% recommended by the KDA. There were no sig- nificant differences among the three groups for macronutrient intake (Table 2) [2].
Dietary energy intake and nutrient intake by BMI after rice bowl based meal plan
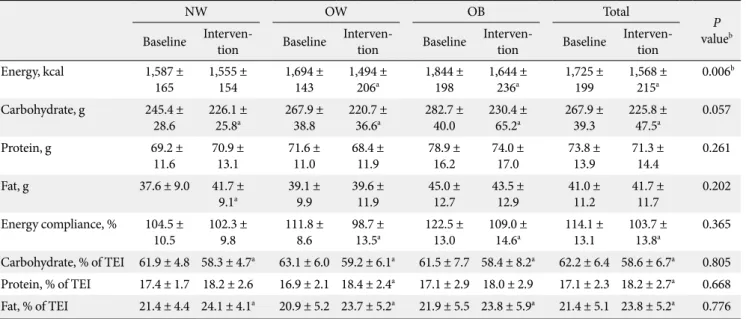
After education on the benefits of using a 200 mL rice bowl, total energy intake for participants remained the same in the NW group, but was significantly reduced by 200 ± 181 kcal/day and 199 ± 224 kcal/day in the OW and the OB groups, respec- tively (P < 0.001, P < 0.001, respectively). The ratio of dietary
Table 2. Dietary energy intake and amount and proportion of macronutrients in study subjects
NW OW OB Total
valueP b Baseline Interven-tion Baseline Interven-tion Baseline Interven-tion Baseline Interven-tion
Energy, kcal 1,587 ±
165 1,555 ±
154 1,694 ±
143 1,494 ±
206a 1,844 ±
198 1,644 ±
236a 1,725 ±
199 1,568 ±
215a 0.006b Carbohydrate, g 245.4 ±
28.6 226.1 ±
25.8a 267.9 ±
38.8 220.7 ±
36.6a 282.7 ±
40.0 230.4 ±
65.2a 267.9 ±
39.3 225.8 ±
47.5a 0.057
Protein, g 69.2 ±
11.6 70.9 ±
13.1 71.6 ±
11.0 68.4 ±
11.9 78.9 ±
16.2 74.0 ±
17.0 73.8 ±
13.9 71.3 ±
14.4 0.261
Fat, g 37.6 ± 9.0 41.7 ±
9.1a 39.1 ±
9.9 39.6 ±
11.9 45.0 ±
12.7 43.5 ±
12.9 41.0 ±
11.2 41.7 ±
11.7 0.202
Energy compliance, % 104.5 ±
10.5 102.3 ±
9.8 111.8 ±
8.6 98.7 ±
13.5a 122.5 ±
13.0 109.0 ±
14.6a 114.1 ±
13.1 103.7 ±
13.8a 0.365 Carbohydrate, % of TEI 61.9 ± 4.8 58.3 ± 4.7a 63.1 ± 6.0 59.2 ± 6.1a 61.5 ± 7.7 58.4 ± 8.2a 62.2 ± 6.4 58.6 ± 6.7a 0.805 Protein, % of TEI 17.4 ± 1.7 18.2 ± 2.6 16.9 ± 2.1 18.4 ± 2.4a 17.1 ± 2.9 18.0 ± 2.9 17.1 ± 2.3 18.2 ± 2.7a 0.668 Fat, % of TEI 21.4 ± 4.4 24.1 ± 4.1a 20.9 ± 5.2 23.7 ± 5.2a 21.9 ± 5.5 23.8 ± 5.9a 21.4 ± 5.1 23.8 ± 5.2a 0.776 The values were presented as mean ± standard deviation. Dietary energy compliance was total daily energy intake (kcal) / prescribed energy in- take (kcal) × 100.
NW, normal weight; OB, obese; OW, overweight; TEI, total energy intake.
aP values < 0.05 for comparison between baseline and intervention, bP values < 0.05 for comparison groups.
energy intake to recommended energy intake also did not change in the NW group, but it reached the recommended levels at 98
± 13% and 109 ± 14% in the OW and the OB groups, respec- tively (P < 0.001, P < 0.001, respectively) (Table 2).
After education, the carbohydrate proportion of total ener- gy intake decreased by 3.7 ± 4.5%, 3.9 ± 4.7%, and 3.1 ± 6.0%
in the NW, the OW, and the OB groups, respectively, and their proportions became closer to those recommended by the KDA (P = 0.004, P < 0.001, and P = 0.015, respectively) [2]. Although the protein proportion of total energy intake increased by 1.4 ± 1.7% only in the OW group, it did not exceed the recommend- ed daily level (P < 0.001). Changes of the protein proportion of total energy intake were not significantly different among the three groups. The fat proportion of total energy intake grew significantly by 2.7 ± 4.3%, 2.8 ± 5.1%, and 1.9 ± 4.6%, respec- tively (P = 0.019, P = 0.014, and P = 0.043, respectively), but it
was still within the recommended KDA range [2]. There were no significant differences in fat proportion of total energy in- take among the three groups (Table 2).
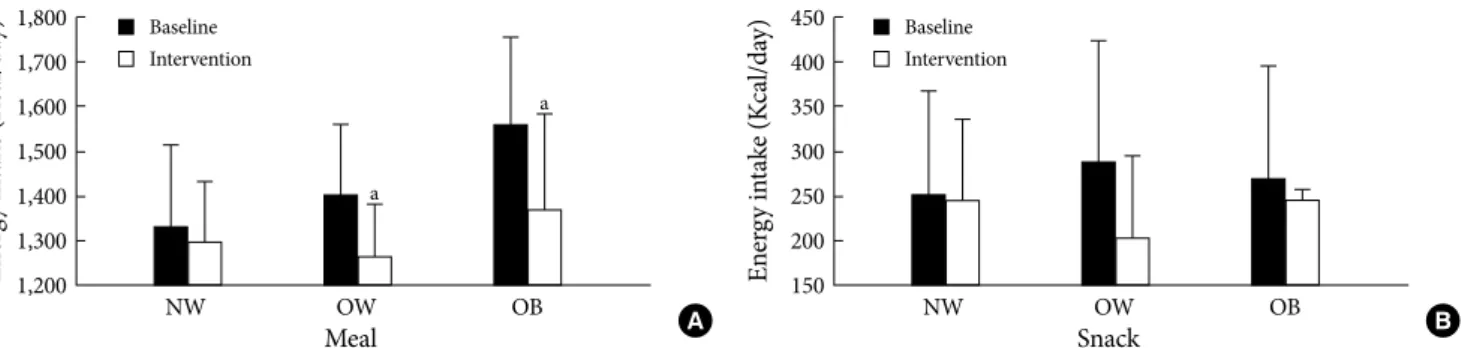
Changes of energy intake through meals and snacks When measuring total energy intake, we classified milk and fruit as snacks and considered all other foods to be meals. To- tal energy intake from meals declined significantly by 142 ± 185 kcal/day and 189 ± 207 kcal/day in the OW and the OB groups, respectively (P = 0.001, P < 0.001, respectively), but total ener- gy intake did not change in the NW group. Total energy intake from snacks decreased significantly by 59.1 ± 106.5 kcal/day only in the OW group (P = 0.005) but did not significantly change in the NW or the OB groups (Fig. 1).
Changes of body weight
After the education, body weight was reduced significantly by 0.4 ± 0.6 kg (-0.7%) and 0.5 ± 0.8 kg (-0.7%) in the OW and the OB groups, respectively (P = 0.003, P = 0.007, respectively), and no significant change was observed in the NW group. When con- sidered as a percentage of ideal body weight, body weight was reduced from 115 ± 3.1% to 114 ± 3.0% and from 135 ± 11.4%
to 134 ± 11.3% in the OW and the OB groups after the educa- tion, respectively (P = 0.003, P = 0.007, respectively) (Fig. 2).
DISCUSSION
In 2005, the KNHANES reported that the carbohydrate propor- tion of total energy intake in Korean women with diabetes was 70.3% [3]. Therefore, Korean women with diabetes consume a relatively high carbohydrate diet [16]. In addition, the KNH–
ANES revealed that main source of carbohydrates are obtained
Energy intake (Kcal/day) Energy intake (Kcal/day)
Meal
Baseline Intervention
Snack
NW OW OB NW OW OB
1,800 1,700 1,600 1,500 1,400 1,300 1,200
450 400 350 300 250 200 150 Baseline
Intervention
a
a
A B
Fig. 1. Patterns of meal and snack intake according to the body mass index. Values are energy intakes as meals and snacks. (A) Differences by energy intake as meal. (B) Differences by energy intake as snack. The energy intake as meal was decreased both in OW and OB (P = 0.001, P < 0.001), but not with in NW. The energy intake as snack was decreased in OW (P = 0.005). NW, nor- mal weight; OW, overweight; OB, obese. aP values <0.05 for comparison between baseline and intervention.
Weight (kg)
NW OW OB
80 75 70 65 60 55 50 45
Baseline Intervention
Fig. 2. Change of weight according to the body mass index. The weight was decreased both in OW and OB (P = 0.003, P = 0.007), but not with in NW. NW, normal weight; OW, over- weight; OB, obese. aP values <0.05 for comparison between baseline and intervention.
a
a
from white rice, and mixed grains and white rice ranked first in frequently consumed food; these findings confirm that Ko- reans typically consume a rice-centered diet [3].
Among our participants, the carbohydrate proportion of total energy intake was 61.9%, 63.1%, and 63.5% in the NW, the OW, and the OB groups, respectively. These figures were lower than the proportion of 70.3% found by the KNHANES in 2005 [3] and also that of a study of Song and Lee [17] that reported proportions of 66.1%, 66.8%, and 67.4%, in normal, overweight, and obese type 2 diabetes patients, respectively.
These variations were considered to result from differences in dietary patterns according to survey period and age [18], region [19], economic status [20,21] and level of diabetes education.
In our study, 94% of the participants received education on di- abetes, and our participants were observed to better control carbohydrate intake as a result. Nevertheless, we found that the carbohydrate proportion of total energy intake (62.2%) was higher than the recommended KDA range (55 to 60%), which suggests that more dietary education is needed to reduce car- bohydrate consumption [2].
In this study, education using a smaller rice bowl effectively decreased carbohydrate intake in Korean women with diabetes regardless of BMI. Food-exchange-system-based education, which is commonly used for diabetes patients, teaches partici- pants to regulate energy intake and marcronutrient composi- tion [22]. Lee and Chang [22] reported that the carbohydrate proportion of type 2 diabetes patients decreased significantly from 62.3% to 59.6% following food-exchange-system-based education, and Ahn et al. [12] also revealed that carbohydrate proportion could decrease significantly from 61% to 57.3% with this type of education method. However, conventional educa- tion methods using a food exchange system require a great deal of time and intensive education or additional management ed- ucation because patients cannot understand them easily; the shortage of available nutritionists also prevents adequate edu- cation [23]. To address the problem of food-exchange-system- based education, Ahn et al. [12] instead educated type 2 diabe- tes patients using an ordinary-sized rice bowl (380 mL) and found that portion control alone could decrease the carbohy- drate proportion from 60.7% to 58.1%, or to the levels recom- mended by the KDA.
Education based on using a smaller rice bowl has been found to significantly increase the protein proportion from 17.1% to 18.2% while not exceeding the range of 15% to 20% recom- mended by the KDA; there was no significant difference among
the groups [2]. This is similar to the findings of a study by Lee and Chang [22] showing that in type 2 diabetes patients, the protein proportion to total energy intake increased from 16.7%
before education based on the food exchange system to 18.1%
after it; and in this study, education based on a smaller rice bowl also regulated the protein proportion to total energy intake with- in the recommended range [2].
Although the fat proportion of total energy intake also in- creased significantly from 21.4% before the education to 23.8%
after it, it still fell within the recommended range (P < 0.001), and no significant difference among the groups was observed.
According to a study of Lee and Chang [22] education based on the food exchange system significantly increased the fat pro- portion of total energy intake by following the decrease of total energy intake in obese middle-aged woman, Ahn et al. [12] found that after a 12-week education program using a food exchange system for obese females with type 2 diabetes, the fat proportion to total energy intake increased, although the change was not statistically significant. In this study, the fat proportion of total energy intake became significantly higher in all three groups, and this change was thought to be caused by the decrease of the carbohydrate proportion of total energy intake. However, since the fat proportion of total energy intake increased signif- icantly but was still within the recommended range, further studies on its long-term and clinical effects are necessary.
Smaller rice bowl based diets reduced engery intake by 200 ± 181 kcal/day and 199 ± 224 kcal/day in the OW and OB groups of our study, respectively. In the OW group, energy intake from meals and snacks was reduced; in the OB, energy intake from meals also declined. This finding was similar to that of Lee [24], who reported that education based on a food exchange system for middle-aged women decreased total dietary energy intake but did not reduce snack intake. Therefore, other active methods were needed to control snack intake, although our education method of using a small sized rice bowl was effective in lower- ing dietary energy intake from meals in the OW and the OB groups.
We used a rice bowl that could hold enough rice to provide 200 kcal of energy. Athough a rice bowl of that could hold 200 kcal to 300 kcal per meal was recommended, we chose the 200- kcal size because patients could potentially heap or push more rice in their bowl and exceed its 200-kcal capacity. Because our study only lasted for two weeks, we could not conclude that the education and the smaller rice bowl led to effective energy in- take control or clinical outcomes in our participants. In addi-
tion, the method, frequency and period of education in this study were different than those other studies that based their education on an ordinary-sized rice bowl, so it was also diffi- cult to determine that using a smaller rice bowl was more effec- tive than using an ordinary-sized rice bowl. Nevertheless, the education plan that we prescribed decreased the carbohydrate proportion of total energy intake regardless of obesity and par- ticularly in the OW and the OB groups. These findings suggest our method’s potential effectiveness for overweight and obese patients, and long-term studies will be needed to determine the effect of our education on intake control.
Unlike a previous study that controlled the amount of foods, our education program used a method based on bowl size, and its effect as a plate method had been proven in foreign coun- tries. Pedersen et al. [25] reported that using a smaller plate for meals helped effectively reduce the body weight of women with diabetes, and Diliberti et al. [26] also showed that a small-sized plate decreased total energy intake at restaurants. Athough our short-term study could not observe major changes in body weight after the education program using the smaller bowl, the body weight of the OW and the OB groups was reduced signif- icantly. Further long-term studies on decreased body weight following the use of a smaller rice bowl are necessary.
In conclusion, our education program reduced total energy intake in overweight and obese patients. Our meal education program reduced rice intake effectively so participants could more closely reach the recommended carbohydrate intake. How- ever, because this study was conducted only in a single hospi- tal and its sample size was small, the effects and changes of di- etary patterns (such as gender and age) could not be examined.
In addition, this study included a three-day dietary record to observe macronutrient intake changes, but it was difficult to evaluate the daily intake of diabetes patients using this record.
Dietary records are more effective than recall methods, which have been widely used to survey food intake. Patients using recall methods tend to report a lower intake than was actually consumed due to factors such as decreased memory in elderly patients; however, since the food frequency method is not suit- able for investigations on short-term changes, our study used the three-day dietary record [27].
Our study used a two-week study period to examine chang- es of carbohydrate intake after using a smaller rice bowl, but this short period made it difficult to determine the effect of the rice-bowl-based meal plan. Therefore, additional studies inves- tigating long-term changes using a similar education method
are necessary.
REFERENCES
1. American Diabetes Association. Diagnosis and classification of diabetes mellitus. Diabetes Care 2007;30 Suppl 1:S42-7.
2. Korean Diabetes Association. Guidelines for education of dia- betes mellitus. 2nd ed. Seoul: Gold Agency; 2006.
3. Ministry of Health and Welfare, Korea Centers for Disease Control and Prevention. The Third Korea National Health and Nutrition Examination Survey (KNHANES III), 2005. Seoul:
Ministry of Health and Welfare; 2006.
4. Yang EJ, Kim WY. The influence of dietary factors on the inci- dence of non-insulin-dependent diabetes mellitus. Korean J Nutr 1999;32:407-18.
5. Jung HK, Yang EJ, Park WO. Carbohydrate intake association with risk factors of coronary heart disease in the adults: NHANES III. Korean J Nutr 2000;33:873-81.
6. Park YM, Son CM, Jang HC. Correlation of carbohydrate in- take with obesity in type 2 diabetes mellitus patients. J Korean Diet Assoc 2006;12:254-63.
7. Feskens EJ, Bowles CH, Kromhout D. Carbohydrate intake and body mass index in relation to the risk of glucose intoler- ance in an elderly population. Am J Clin Nutr 1991;54:136-40.
8. Hollenbeck CB, Chen N, Chen YD, Reaven GM. Relationship between the plasma insulin response to oral glucose and insu- lin-stimulated glucose utilization in normal subjects. Diabetes 1984;33:460-3.
9. Chang UJ, Jung EY, Hong IS. The effect of the reduced portion size by using a diet rice bowl on food consumption and satiety rate. Korean J Community Nutr 2007;12:639-45.
10. Son SM. Rice based meal for prevention of obesity and chronic disease. Korean J Community Nutr 2001;6:862-7.
11. Ahn HJ, Koo BK, Jung JY, Kwon HR, Chung MY, Ku YH, Kim JT, Han KA, Min KW. Association between volume of bowls and the dietary intakes in subjects with type 2 diabetes. Korean Diabetes J 2009;33:335-43.
12. Ahn HJ, Koo BK, Jung JY, Kwon HR, Kim HJ, Park KS, Han KA, Min KW. Bowl-based meal plan versus food exchange- based meal plan for dietary intake control in Korean type 2 di- abetic patients. Korean Diabetes J 2009;33:155-63.
13. Korean Diabetes Association. Staged diabetes management.
3rd ed. Seoul: Korean Diabetes Association; 2007. p3-9.
14. Sevick MA, Napolitano MA, Papandonatos GD, Gordon AJ, Reiser LM, Marcus BH. Cost-effectiveness of alternative ap-
proaches for motivating activity in sedentary adults: results of project stride. Prev Med 2007;45:54-61.
15. Moore JK, Elliott RA, Payne K, Moore EW, St Leger AS, Harp- er NJ, Pollard BJ, Kerr J. The effect of anaesthetic agents on in- duction, recovery and patient preferences in adult day case surgery: a 7-day follow-up randomized controlled trial. Eur J Anaesthesiol 2008;25:876-83.
16. Ministry of Health and Welfare, Korean Centers for Disease Control and Prevention. In-depth analyses on the Third Korea Health and Nutrition Examination Survey. Seoul: Ministry of Health and Welfare; 2007.
17. Song MH, Lee JM. A study on food and nutrients intake and blood constituents of diabetics by obese index. Korean J Nutr 1993;26:953-66.
18. Choi JH, Moon HK. Dietary pattern by sex and age with menu analysis using 1998, 2001 National Health and Nutrition Sur- vey of Korea. Korean J Community Nutr 2007;12:798-814.
19. Moon HK, Lee SS, Lee JS, Park SY, Han GJ, Yu CH, Paik HY, Jung GJ. The study of menu patterns in Korean rural areas (II):
compared by the area. Korean J Nutr 2002;35:658-67.
20. Moon HK, Kim EG. Food intake patterns of Koreans by the economic status using 1998 Korean National Health Examina- tion Nutrition Survey. Korean J Nutr 2004;37:316-28.
21. Song YJ, Jeoung HJ, Paik HY. Socioeconomic, nutrient, and health risk factors associated with dietary patterns in adult populations from 2001 Korean National Health and Nutrition Survey. Korean J Nutr 2005;38:219-25.
22. Lee SH, Chang NS. Effectiveness of nutrition education on di- etary habits and diet quality in the weight loss and weight gain groups in college women. Korean J Nutr 2007;40:463-74.
23. Cho JW. The present status of diabetes education and opinion research of food exchange list. Korean Diabetes J 2008;32 Sup- pl 2:S109-14.
24. Lee SL. Effects of nutrition counseling on diabetes manage- ment in type 2 diabetes mellitus patients. J Korean Diet Assoc 2009;15:188-95.
25. Pedersen SD, Kang J, Kline GA. Portion control plate for weight loss in obese patients with type 2 diabetes mellitus: a controlled clinical trial. Arch Intern Med 2007;167:1277-83.
26. Diliberti N, Bordi PL, Conklin MT, Roe LS, Rolls BJ. Increased portion size leads to increased energy intake in a restaurant meal. Obes Res 2004;12:562-8.
27. Young CM, Hagan GG, Tucker RE, Fost WD. A comparison of dietary study method. 11. Dietary history vs seven-day record vs 24-hr recall. J Am Diet Assoc 1952;28:218.