Association between Bone Mineral Density and
Albuminuria: Cross-Sectional Analysis of Data from the 2011 Korea National Health and Nutrition Examination Survey V-2
Tae Yang Yu1, Ha-Young Kim2, Jeong Mi Lee3, Dae Ho Lee4, Chung Gu Cho1
1Division of Endocrinology and Metabolism, Department of Internal Medicine, Wonkwang University School of Medicine, Iksan; 2Division of Endocrinology and Metabolism, Department of Internal Medicine, Wonkwang University Sanbon Hospital, Wonkwang University School of Medicine, Gunpo; 3Department of Public Health, Wonkwang University School of Medicine, Iksan; 4Division of Endocrinology and Metabolism, Department of Internal Medicine, Gachon University Gil Medical Center, Gachon University College of Medicine, Incheon, Korea
Background: Albuminuria is known to be independently associated with progression of renal and cardiovascular disease. However, little is known regarding the exact relationship between albuminuria and bone mineral density (BMD). The aim of this population- based study conducted in Korea was to identify the association between albuminuria and BMD.
Methods: We performed a cross-sectional analysis of data from the Korea National Health and Nutrition Examination Survey (KNHANES V-2) 2011. BMD was measured for total hip (TH), femur neck (FN), and lumbar spine (LS). Analysis of covariance was used to compare BMD levels between the groups at the TH, FN, and LS sites, after adjusting for age. Separate analyses were performed according to sex; women were divided into two groups according to menopausal status and each group was subdivided into three according to urine albumin-to-creatinine ratio (level 1, <30 mg/g; level 2, 30 to 299 mg/g; level 3, ≥300 mg/g).
Results: Data on a total of 1,831 adults (857 men and 974 women) were analyzed. In postmenopausal women, after adjusting for age, BMD of TH tended to decrease as levels of albuminuria increased (0.767±0.117, 0.757±0.129, 0.752±0.118, respectively;
P=0.040). However, there was no significant difference in BMD according to albuminuria level in premenopausal women and men.
Conclusion: Level of albuminuria was closely related with BMD of TH in postmenopausal women, after adjusting for age, but there was no significant relationship between albuminuria and BMD in premenopausal women and men.
Keywords: Albuminuria; Bone density; Metabolic syndrome; Osteoporosis, postmenopausal
Received: 3 November 2017, Revised: 25 January 2018, Accepted: 22 February 2018
Corresponding authors: Dae Ho Lee
Division of Endocrinology and Metabolism, Department of Internal Medicine, Gachon University Gil Medical Center, Gachon University College of Medicine, 21 Namdong-daero 774beon-gil, Namdong-gu, Incheon 21565, Korea
Tel: +82-32-460-3204, Fax: +82-32-899-6033, E-mail: [email protected] Chung Gu Cho
Division of Endocrinology and Metabolism, Department of Internal Medicine, Wonkwang University Hospital, Wonkwang University School of Medicine, 895 Muwang-ro, Iksan 54538, Korea
Tel: +82-63-859-2670, Fax: +82-63-855-2025, E-mail: [email protected]
Copyright © 2018 Korean Endocrine Society
This is an Open Access article distributed under the terms of the Creative Com- mons Attribution Non-Commercial License (http://creativecommons.org/
licenses/by-nc/4.0/) which permits unrestricted non-commercial use, distribu- tion, and reproduction in any medium, provided the original work is properly cited.
INTRODUCTION
Osteoporosis is one of the most prevalent and important medi- cal concerns due to the high rates of morbidity and mortality from osteoporotic fractures [1]. It has recently been reported that the prevalence of osteoporosis in Korea is 7.3% in men and 38.0% in women aged over 50 years [2], and the number of af- fected patients is increasing. Nevertheless, patients with osteo- porosis have no definitive symptoms until osteoporotic fractures take place. Therefore, early diagnosis and prevention of osteo- porosis are important health issues.
Albuminuria, urine albumin-to-creatinine ratio (UACR) equal or more than 30 mg/g in the urine, is a common health condi- tion, affecting up to 5.2% of the general population in Korea [3].
Traditionally, albuminuria has been recognized as a prognostic marker of chronic kidney disease [4]. It has also been suggested that albuminuria is strongly associated with an increased risk of cardiovascular disease (CVD) [5] and increased levels of in- flammatory markers [6]. Given the importance of albuminuria, its clinical implications are likely to be wider.
We were interested in ascertaining if there was a relationship between albuminuria and bone mineral density (BMD), which would enable early screening for osteoporosis. We found little previous research on the association between these factors.
Therefore, we performed a cross-sectional analysis among a general adult population to determine the relationship between albuminuria and BMD.
METHODS
Study population and design
We conducted this study based on data from the second year of the fifth Korea National Health and Nutrition Examination Sur- vey (KNHANES V-2), conducted in 2011. KNHANES V con- tains nationally representative statistics on demographics, health status, health-related behavior, actual diet, nutritional status, and blood and urine sampling was conducted by the Chronic Dis- ease Surveillance Division of the Korea Centers for Disease Control and Prevention (KCDC) from 2010 to 2012.
Our study included subjects aged over 30 who had available data of BMD and urine albumin testing. We excluded women who have experienced early menopause (<40 years) or meno- pause after hysterectomy.
We collected data on age, past history of treatment for hyper- tension and/or diabetes mellitus, and current smoking and drink- ing statuses. Heavy drinking was categorized as drinking alco-
hol four or more times per week. Postmenopausal status was defined as the absence of menses for at least 1 year. We sur- veyed physical activities using the International Physical Activ- ity Questionnaire [7].
Urine albumin excretion was categorized as one of three lev- els, according to UACR (level 1, less than 30 mg/g; level 2, be- tween 30 and 299 mg/g; level 3, equal or more than 300 mg/g).
All participants gave informed written consent for KH- NANES V-2. The study protocol was approved by the Institu- tional Review Board of the KCDC, who waived the require- ment for further informed written consent (201102CON-06-C).
The study was carried out in accordance with the Declaration of Helsinki.
Measurements
Waist circumference (WC) was measured to the nearest 0.1 cm on a horizontal plane at the midpoint level between the iliac crest and the costal margin at the end of normal expiration. The heights and weights of the subjects were measured to the near- est 0.1 cm and 0.1 kg, respectively. Body mass index (BMI) was calculated by dividing weight by the square of height (kg/m2).
Systolic blood pressure (BP) and diastolic BP were measured three times using a mercury sphygmomanometer (Baumanome- ter, W. A. Baum Co. Inc., Copiague, NY, USA). Each partici- pant was seated and rested for at least 5 minutes before BP was measured. The BP value used for statistical analysis was the av- erage of measurements.
Venous blood samples were obtained after overnight fasting.
Plasma glucose, total cholesterol, low density lipoprotein cho- lesterol, high density lipoprotein cholesterol, and triglyceride levels were measured using a Hitachi Automatic Analyzer 7600 (Hitachi, Tokyo, Japan). Glycated hemoglobin (HbA1c) levels were measured using high-performance liquid chromatography (HLC-723G7, Tosoh, Tokyo, Japan). Spot urine albumin con- centrations were obtained from a turbidimetric assay (Hitachi Automatic Analyzer 7600), and serum and spot urine creatinine levels from a colorimetric assay using the compensated rate- blanked Jaffe method (Cobas 8000® C702, Roche Diagnostics Korea, Seoul, Korea). The UACR was calculated as the ratio of urine albumin to creatinine (mg/g).
Whole body dual-energy X-ray absorptiometry (DXA) was performed with a Discovery™ QDR fan-beam densitometer (Hologic Inc., Bedford, MA, USA) according to the procedure recommended by the manufacturer. BMD levels were measured at the total hip (TH), femur neck (FN), and lumbar spine (LS).
The results of DXA were analyzed according to the standard
protocol of the Korean Society of Osteoporosis using Hologic Discovery™ software version 13.1.
Definitions of diabetes mellitus and hypertension
Diabetes mellitus was defined as a fasting glucose equal or more than 126 mg/dL or HbA1c equal or more than 6.5% or self-reported physician’s diagnosis or intake of antidiabetic medication. And hypertension was defined as an average systol- ic BP equal or more than 140 mm Hg or diastolic BP equal or more than 90 mm Hg or self-reported physician’s diagnosis or intake of antihypertensive agents.
Statistical analysis
Data were analyzed using SPSS statistics version 21 (IBM Co., Armonk, NY, USA). Continuous variables with normal distri- butions were presented as mean±standard deviation, whereas continuous variables with non-normal distributions were ex- pressed as median (interquartile range [IQR]). In order to com- pare baseline characteristics, Pearson chi-square test was used
for categorical variables and analysis of variance for continuous variables. Analysis of covariance was used to compare BMD levels between the groups at the TH, FN, and LS sites, after ad- justing for age. Separate analyses were performed for premeno- pausal women, postmenopausal women, and men, and BMD levels were analyzed according to the three UACR levels. All statistical tests were two-tailed, and significance was defined as a P<0.05.
RESULTS
Clinical characteristics of the study participants
A total of 8,518 people participated in KNHANES V-2, and 2,757 of them had available measurement of BMD. Of these, we included 1,831 participants (857 men and 974 women) who had available urine albumin testing and were aged over 30 years old. Among 974 women, 379 were premenopausal and 595 were postmenopausal.
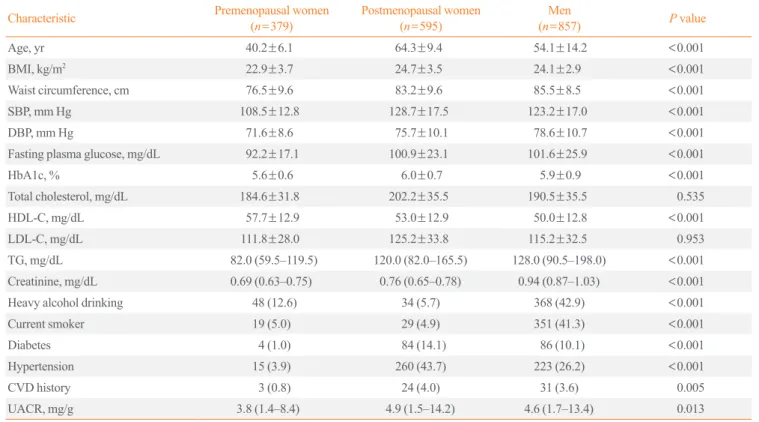
Table 1 shows the baseline clinical and biochemical charac-
Table 1. Baseline Characteristics of the Study Population According to Sex and Menopausal Status Based on the 2011 Korea National Health and Nutrition Examination Survey
Characteristic Premenopausal women
(n=379) Postmenopausal women
(n=595) Men
(n=857) P value
Age, yr 40.2±6.1 64.3±9.4 54.1±14.2 <0.001
BMI, kg/m2 22.9±3.7 24.7±3.5 24.1±2.9 <0.001
Waist circumference, cm 76.5±9.6 83.2±9.6 85.5±8.5 <0.001
SBP, mm Hg 108.5±12.8 128.7±17.5 123.2±17.0 <0.001
DBP, mm Hg 71.6±8.6 75.7±10.1 78.6±10.7 <0.001
Fasting plasma glucose, mg/dL 92.2±17.1 100.9±23.1 101.6±25.9 <0.001
HbA1c, % 5.6±0.6 6.0±0.7 5.9±0.9 <0.001
Total cholesterol, mg/dL 184.6±31.8 202.2±35.5 190.5±35.5 0.535
HDL-C, mg/dL 57.7±12.9 53.0±12.9 50.0±12.8 <0.001
LDL-C, mg/dL 111.8±28.0 125.2±33.8 115.2±32.5 0.953
TG, mg/dL 82.0 (59.5–119.5) 120.0 (82.0–165.5) 128.0 (90.5–198.0) <0.001
Creatinine, mg/dL 0.69 (0.63–0.75) 0.76 (0.65–0.78) 0.94 (0.87–1.03) <0.001
Heavy alcohol drinking 48 (12.6) 34 (5.7) 368 (42.9) <0.001
Current smoker 19 (5.0) 29 (4.9) 351 (41.3) <0.001
Diabetes 4 (1.0) 84 (14.1) 86 (10.1) <0.001
Hypertension 15 (3.9) 260 (43.7) 223 (26.2) <0.001
CVD history 3 (0.8) 24 (4.0) 31 (3.6) 0.005
UACR, mg/g 3.8 (1.4–8.4) 4.9 (1.5–14.2) 4.6 (1.7–13.4) 0.013
Values are expressed as mean±SD, median (interquartile range), or number (%).
BMI, body mass index; SBP, systolic blood pressure; DBP, diastolic blood pressure; HbA1c, glycated hemoglobin; HDL-C, high density lipoprotein cho- lesterol; LDL-C, low density lipoprotein cholesterol; TG, triglyceride; CVD, cardiovascular disease; UACR, urine albumin-to-creatinine ratio.
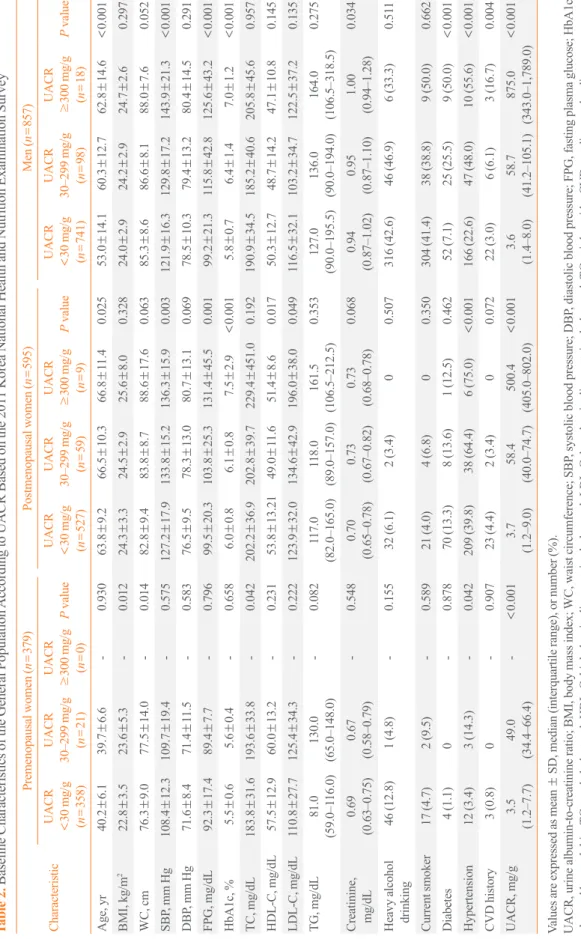
Table 2. Baseline Characteristics of the General Population According to UACR Based on the 2011 Korea National Health and Nutrition Examination Survey Characteristic
Premenopausal women (n=379)Postmenopausal women (n=595)Men (n=857) UACR <30 mg/g (n=358)
UACR 30–299 mg/g (n=21)
UACR ≥300 mg/g (n=0)P valueUACR <30 mg/g (n=527)
UACR 30–299 mg/g (n=59)
UACR ≥300 mg/g (n=9)P valueUACR <30 mg/g (n=741)
UACR 30–299 mg/g (n=98)
UACR ≥300 mg/g (n=18)P value Age, yr40.2±6.139.7±6.6-0.93063.8±9.266.5±10.366.8±11.40.02553.0±14.160.3±12.762.8±14.6<0.001 BMI, kg/m222.8±3.523.6±5.3-0.01224.3±3.324.5±2.925.6±8.00.32824.0±2.924.2±2.924.7±2.60.297 WC, cm76.3±9.077.5±14.0-0.01482.8±9.483.8±8.788.6±17.60.06385.3±8.686.6±8.188.0±7.60.052 SBP, mm Hg 108.4±12.3109.7±19.4-0.575127.2±17.9133.8±15.2136.3±15.90.003121.9±16.3129.8±17.2143.9±21.3<0.001 DBP, mm Hg71.6±8.471.4±11.5-0.58376.5±9.578.3±13.080.7±13.10.06978.5±10.379.4±13.280.4±14.50.291 FPG, mg/dL92.3±17.489.4±7.7-0.79699.5±20.3103.8±25.3131.4±45.50.00199.2±21.3115.8±42.8125.6±43.2<0.001 HbA1c, %5.5±0.65.6±0.4-0.6586.0±0.86.1±0.87.5±2.9<0.0015.8±0.76.4±1.47.0±1.2<0.001 TC, mg/dL183.8±31.6193.6±33.8-0.042202.2±36.9202.8±39.7229.4±451.00.192190.9±34.5185.2±40.6205.8±45.60.957 HDL-C, mg/dL57.5±12.960.0±13.2-0.23153.8±13.2149.0±11.651.4±8.60.01750.3±12.748.7±14.247.1±10.80.145 LDL-C, mg/dL110.8±27.7125.4±34.3-0.222123.9±32.0134.6±42.9196.0±38.00.049116.5±32.1103.2±34.7122.5±37.20.135 TG, mg/dL81.0 (59.0–116.0)130.0 (65.0–148.0)-0.082117.0 (82.0–165.0)118.0 (89.0–157.0)161.5 (106.5–212.5)0.353127.0 (90.0–195.5)136.0 (90.0–194.0)164.0 (106.5–318.5)0.275 Creatinine, mg/dL0.69 (0.63–0.75)0.67 (0.58–0.79)-0.5480.70 (0.65–0.78)0.73 (0.67–0.82)0.73 (0.68–0.78)0.0680.94 (0.87–1.02)0.95 (0.87–1.10)1.00 (0.94–1.28)0.034 Heavy alcohol drinking46 (12.8)1 (4.8)-0.15532 (6.1)2 (3.4)00.507316 (42.6)46 (46.9)6 (33.3)0.511 Current smoker17 (4.7)2 (9.5)-0.58921 (4.0)4 (6.8)00.350304 (41.4)38 (38.8)9 (50.0)0.662 Diabetes4 (1.1)0-0.87870 (13.3)8 (13.6)1 (12.5)0.46252 (7.1)25 (25.5)9 (50.0)<0.001 Hypertension12 (3.4)3 (14.3)-0.042209 (39.8)38 (64.4)6 (75.0)<0.001166 (22.6)47 (48.0)10 (55.6)<0.001 CVD history3 (0.8)0-0.90723 (4.4)2 (3.4)00.07222 (3.0)6 (6.1)3 (16.7)0.004 UACR, mg/g 3.5 (1.2–7.7)49.0 (34.4–66.4)-<0.0013.7 (1.2–9.0)58.4 (40.0–74.7)500.4 (405.0–802.0)<0.0013.6 (1.4–8.0)58.7 (41.2–105.1)875.0 (343.0–1,789.0)<0.001 Values are expressed as mean ± SD, median (interquartile range), or number (%). UACR, urine albumin-to-creatinine ratio; BMI, body mass index; WC, waist circumference; SBP, systolic blood pressure; DBP, diastolic blood pressure; FPG, fasting plasma glucose; HbA1c, glycated hemoglobin; TC, total cholesterol; HDL-C, high density lipoprotein cholesterol; LDL-C, low density lipoprotein cholesterol; TG, triglyceride; CVD, cardiovascular disease.
teristics of the study population. Mean ages were 40.2±6.1, 64.3±9.4, and 54.1±14.2 years old, and median UACRs were 3.8 mg/g (IQR, 1.4 to 8.4), 4.9 mg/g (IQR, 1.5 to 14.2), and 4.6 mg/g (IQR, 1.7 to 13.4) in premenopausal women, postmeno- pausal women, and men, respectively.
Table 2 presents the clinical characteristics and laboratory variables of study participants based on the three albuminuria levels. Premenopausal women with level 2 albuminuria (30 to 299 mg/g) had higher BMI, WC, and total cholesterol levels, and had more prevalence of hypertension than premenopausal women with level 1 albuminuria (<30 mg/g). There were posi- tive relationships between level of albuminuria and age, systolic BP, fasting plasma glucose, and HbA1c in postmenopausal women and men.
BMD according to level of albuminuria
Table 3 shows BMD of TH, FN, and LS according to albumin- uria level. In postmenopausal women with higher level of albu- minuria had significantly more chance of lower BMD of TH, after adjusting for age (0.767±0.117, 0.757±0.129, and 0.752±0.118, respectively; P=0.040). However, there was no significant difference in BMD of FN or LS according to level of
albuminuria in postmenopausal women, after adjusting for age.
Similarly, there was no significant difference in BMD according to level of albuminuria among premenopausal women or men.
DISCUSSION
In this cross-sectional study, we examined the association be- tween albuminuria and BMD in a general adult population. Our analysis showed that albuminuria is negatively related to BMD of TH in postmenopausal women; however, we found no rela- tionship between albuminuria level and BMD in premenopausal women and men, after adjusting for age.
Previous cross-sectional studies have reported a close rela- tionship between albuminuria and metabolic syndrome [8,9].
Moreover, the Prevention of Renal and Vascular End Stage Dis- ease study recommended that elevated excretion of albumin in the urine should be included as a component of metabolic syn- drome, which was defined by the International Diabetes Federa- tion in order provide consensus diagnostic criteria to more reli- ably predict the development of type 2 diabetes mellitus, chron- ic kidney disease, and CVD [10].
The World Health Organization included microalbuminuria
Table 3. Bone Mineral Density of Total Femur, Femur Neck, and Lumbar Spine According to Albuminuria Groups
Variable Total hip Femur neck Lumbar spine
Premenopausal women (n=379)
UACR <30 mg/g (n=358) 0.880±0.110 0.742±0.104 0.984±0.119
UACR 30–299 mg/g (n=21) 0.941±0.139 0.794±0.153 1.010±0.123
UACR ≥ 300 mg/g (n=0) - - -
P value 0.072 0.155 0.364
P value (age-adjusted) 0.271 0.100 0.547
Postmenopausal women (n=595)
UACR <30 mg/g (n=527) 0.767±0.117 0.625±0.110 0.803±0.138
UACR 30–299 mg/g (n=59) 0.757±0.129 0.612±0.115 0.769±0.130
UACR ≥300 mg/g (n=9) 0.752±0.118 0.617±0.117 0.845±0.177
P value 0.352 0.195 0.367
P value (age-adjusted) 0.040 0.350 0.352
Men (n=857)
UACR <30 mg/g (n=741) 0.939±0.126 0.783±0.125 0.954±0.142
UACR 30–299 mg/g (n=98) 0.905±0.130 0.740±0.120 0.958±0.163
UACR >300 mg/g (n=18) 0.890±0.148 0.729±0.141 1.009±0.180
P value 0.042 0.008 0.477
P value (age-adjusted) 0.462 0.447 0.214
Values are expressed as mean±SD.
UACR, urine albumin-to-creatinine ratio.
as an essential component of metabolic syndrome in 1998 fol- lowing a consultation on proposed criteria [11]. However, the National Cholesterol Education Program’s Adult Treatment Panel III (NCEP-ATP III) and the European Group for the Study of Insulin Resistance formulated definitions which did not in- clude microalbuminuria [12,13]. The NCEP-ATP III definition is more widely used, merely because it is simpler for clinical practice [14]. Nevertheless, there is a close relationship between albuminuria and metabolic syndrome.
A relationship between metabolic syndrome and osteoporosis has also been shown in previous studies [15-18]. Though its mechanism still remains unclear, it is worth noting that adipose cells and osteoblasts are derived from the same mesenchymal stem cells [19]. Moreover, the fact that many types of cytokines and peroxisome proliferator-activated receptor γ have effects on the differentiation and growth of the two cell types may explain the relationship [20,21]. Furthermore, it has been demonstrated that bone tissue formation is influenced by the fat-derived hor- mones leptin and adiponectin also via signals generated from adipose tissue [22,23], based on the presence of receptors for adipokines on both osteoblasts and osteoclasts [24]. Conversely, it has been found that bone tissue is involved in direct and indi- rect modulation of adipose tissue [25].
Inflammatory cytokines (i.e., interleukin 1 [IL-1], IL-6, and tumor necrosis factor α) derived from adipose tissue also play a pivotal role in bone reabsorption and in the pathogenesis of os- teoporosis [26-28]. The levels of these cytokines are positively related to bone loss in healthy women [29,30]. Therefore, it is suggested that low-grade inflammation originating from adi- pose tissue in patients with metabolic syndrome may contribute to bone loss.
The weight of evidence points to a close relationship between albuminuria and metabolic syndrome, although the underlying mechanism that links albuminuria and metabolic syndrome has not yet been elucidated. Moreover, a relationship between meta- bolic syndrome and osteoporosis has also been found in previ- ous studies. This may explain the link between albuminuria and osteoporosis.
There are a few previous studies on the association between albuminuria and BMD. In one study, albuminuria was negative- ly associated with BMD of the LS and FN in women, and esti- mated glomerular filtration rate was negatively associated with BMD of LS in both men and women [31]. Another study dem- onstrated a relationship between albuminuria and risk of hip and pelvic fractures [32]. However, little is known regarding the ex- act association between albuminuria and BMD levels, or the
mechanisms involved. In another study, metabolic syndrome appeared to have a beneficial effect on bone mass, an effect largely explained by the higher mechanical load of patients with metabolic syndrome [33,34].
In this study, albuminuria was negatively related to BMD of TH in postmenopausal women after adjusting for age, but there was no significant difference between albuminuria levels and BMD in premenopausal women. We postulate that, apart from the negative effects of hormonal dysregulation, increased me- chanical loading due to being overweight plays a major role on BMD of premenopausal women. After menopause, however, we postulate that this beneficial effect is outweighed by the det- rimental effects of hormonal dysregulation. Thus, it is feasible that menopause marks a pivotal turning point in bone metabo- lism in women. Nevertheless, the mechanism underlying the as- sociation between albuminuria and BMD in postmenopausal women remains unclear.
Our study has some limitations. First, given the cross-section- al nature of the study, causality could not be addressed. There- fore, prospective studies are needed. Second, we did not adjust for other associated factors because after adjusting except age, the results have lost the statistical significance. Third, we did not analyze data regarding the duration of menopause in post- menopausal women. Fourth, we did not consider a level of drugs known to affect bone metabolism.
While our hypotheses remain speculative and require further investigation, existing studies support the association between albuminuria and BMD in women. However, more precise pro- spective studies are needed to confirm these results.
In conclusion, in the present study, albuminuria was closely related to BMD of TH in postmenopausal women, but there was no relationship between albuminuria levels and BMD in pre- menopausal women and men. Consequently, we suggest that al- buminuria levels may be a useful predictor of osteoporosis in postmenopausal women.
CONFLICTS OF INTEREST
No potential conflict of interest relevant to this article was re- ported.
ACKNOWLEDGMENTS
This study was supported by the research fund of the Honam Branch of the Korean Endocrine Society (2016).
AUTHOR CONTRIBUTIONS
Conception or design: D.H.L., C.G.C. Acquisition, analysis, or interpretation of data: J.M.L., H.Y.K., T.Y.Y. Drafting the work or revising: T.Y.Y., C.G.C. Final approval of the manuscript:
D.H.L., C.G.C.
ORCID
Tae Yang Yu https://orcid.org/0000-0003-0893-592X Ha-Young Kim https://orcid.org/0000-0002-0651-2213 Jeong Mi Lee https://orcid.org/0000-0003-0878-5802 Dae Ho Lee https://orcid.org/0000-0002-8832-3052 Chung Gu Cho https://orcid.org/0000-0002-6278-2488
REFERENCES
1. Center JR, Nguyen TV, Schneider D, Sambrook PN, Eisman JA. Mortality after all major types of osteoporotic fracture in men and women: an observational study. Lancet 1999;353:
878-82.
2. Park EJ, Joo IW, Jang MJ, Kim YT, Oh K, Oh HJ. Preva- lence of osteoporosis in the Korean population based on Korea National Health and Nutrition Examination Survey (KNHANES), 2008-2011. Yonsei Med J 2014;55:1049-57.
3. Nam GE, Han K, Park YG, Kim YH, Han B, Kim SM, et al.
Prevalence and related risk factors of albuminuria in Korean adults: the 2011 Korea National Health and Nutrition Exam- ination Survey. Nephron Clin Pract 2013;124:232-8.
4. Glassock RJ. Is the presence of microalbuminuria a relevant marker of kidney disease? Curr Hypertens Rep 2010;12:364- 8.
5. de Zeeuw D, Parving HH, Henning RH. Microalbuminuria as an early marker for cardiovascular disease. J Am Soc Nephrol 2006;17:2100-5.
6. Gupta J, Mitra N, Kanetsky PA, Devaney J, Wing MR, Reil- ly M, et al. Association between albuminuria, kidney func- tion, and inflammatory biomarker profile in CKD in CRIC.
Clin J Am Soc Nephrol 2012;7:1938-46.
7. Hagstromer M, Oja P, Sjostrom M. The International Physi- cal Activity Questionnaire (IPAQ): a study of concurrent and construct validity. Public Health Nutr 2006;9:755-62.
8. Sheng CS, Hu BC, Fan WX, Zou J, Li Y, Wang JG. Micro- albuminuria in relation to the metabolic syndrome and its components in a Chinese population. Diabetol Metab Syndr 2011;3:6.
9. Palaniappan L, Carnethon M, Fortmann SP. Association be- tween microalbuminuria and the metabolic syndrome:
NHANES III. Am J Hypertens 2003;16(11 Pt 1):952-8.
10. van der Velde M, Bello AK, Brantsma AH, El Nahas M, Bakker SJ, de Jong PE, et al. Do albuminuria and hs-CRP add to the International Diabetes Federation definition of the metabolic syndrome in predicting outcome? Nephrol Dial Transplant 2012;27:2275-83.
11. Alberti KG, Zimmet PZ. Definition, diagnosis and classifi- cation of diabetes mellitus and its complications. Part 1: di- agnosis and classification of diabetes mellitus provisional report of a WHO consultation. Diabet Med 1998;15:539-53.
12. Expert Panel on Detection, Evaluation, and Treatment of High Blood Cholesterol in Adults. Executive summary of the third report of the National Cholesterol Education Pro- gram (NCEP) expert panel on detection, evaluation, and treatment of high blood cholesterol in adults (Adult Treat- ment Panel III). JAMA 2001;285:2486-97.
13. Balkau B, Charles MA. Comment on the provisional report from the WHO consultation. European Group for the Study of Insulin Resistance (EGIR). Diabet Med 1999;16:442-3.
14. Eckel RH, Grundy SM, Zimmet PZ. The metabolic syn- drome. Lancet 2005;365:1415-28.
15. Kim HY, Choe JW, Kim HK, Bae SJ, Kim BJ, Lee SH, et al.
Negative association between metabolic syndrome and bone mineral density in Koreans, especially in men. Calcif Tissue Int 2010;86:350-8.
16. Kim T, Park S, Pak YS, Lee S, Lee EH. Association between metabolic syndrome and bone mineral density in Korea: the Fourth Korea National Health and Nutrition Examination Survey (KNHANES IV), 2008. J Bone Miner Metab 2013;
31:652-62.
17. Hwang DK, Choi HJ. The relationship between low bone mass and metabolic syndrome in Korean women. Osteopo- ros Int 2010;21:425-31.
18. Szulc P, Varennes A, Delmas PD, Goudable J, Chapurlat R.
Men with metabolic syndrome have lower bone mineral density but lower fracture risk: the MINOS study. J Bone Miner Res 2010;25:1446-54.
19. Rosen CJ, Bouxsein ML. Mechanisms of disease: is osteo- porosis the obesity of bone? Nat Clin Pract Rheumatol 2006;2:35-43.
20. Lazarenko OP, Rzonca SO, Hogue WR, Swain FL, Suva LJ, Lecka-Czernik B. Rosiglitazone induces decreases in bone mass and strength that are reminiscent of aged bone. Endo- crinology 2007;148:2669-80.
21. Gimble JM, Robinson CE, Wu X, Kelly KA, Rodriguez BR, Kliewer SA, et al. Peroxisome proliferator-activated recep- tor-gamma activation by thiazolidinediones induces adipo- genesis in bone marrow stromal cells. Mol Pharmacol 1996;
50:1087-94.
22. Tanna N, Patel K, Moore AE, Dulnoan D, Edwards S, Hampson G. The relationship between circulating adiponec- tin, leptin and vaspin with bone mineral density (BMD), ar- terial calcification and stiffness: a cross-sectional study in post-menopausal women. J Endocrinol Invest 2017;40:1345- 53.
23. Elefteriou F, Takeda S, Ebihara K, Magre J, Patano N, Kim CA, et al. Serum leptin level is a regulator of bone mass.
Proc Natl Acad Sci U S A 2004;101:3258-63.
24. Lecka-Czernik B. Marrow fat metabolism is linked to the systemic energy metabolism. Bone 2012;50:534-9.
25. Kawai M, de Paula FJ, Rosen CJ. New insights into osteo- porosis: the bone-fat connection. J Intern Med 2012;272:317- 29.
26. Jilka RL, Hangoc G, Girasole G, Passeri G, Williams DC, Abrams JS, et al. Increased osteoclast development after es- trogen loss: mediation by interleukin-6. Science 1992;257:88- 91.
27. Manolagas SC, Jilka RL. Bone marrow, cytokines, and bone remodeling. Emerging insights into the pathophysiology of osteoporosis. N Engl J Med 1995;332:305-11.
28. Nanes MS. Tumor necrosis factor-alpha: molecular and cel-
lular mechanisms in skeletal pathology. Gene 2003;321:1- 15.
29. Salamone LM, Whiteside T, Friberg D, Epstein RS, Kuller LH, Cauley JA. Cytokine production and bone mineral den- sity at the lumbar spine and femoral neck in premenopausal women. Calcif Tissue Int 1998;63:466-70.
30. Scheidt-Nave C, Bismar H, Leidig-Bruckner G, Woitge H, Seibel MJ, Ziegler R, et al. Serum interleukin 6 is a major predictor of bone loss in women specific to the first decade past menopause. J Clin Endocrinol Metab 2001;86:2032-42.
31. Choi SW, Kim HY, Ahn HR, Lee YH, Kweon SS, Choi JS, et al. Association of bone mineral density with albuminuria and estimated glomerular filtration rate: the Dong-gu Study.
Kidney Blood Press Res 2013;37:132-41.
32. Barzilay JI, Gao P, Clase CM, Mente A, Mann JF, Sleight P, et al. Albuminuria and rapid loss of GFR and risk of new hip and pelvic fractures. Clin J Am Soc Nephrol 2013;8:233-40.
33. Kim BJ, Ahn SH, Bae SJ, Kim EH, Kim TH, Lee SH, et al.
Association between metabolic syndrome and bone loss at various skeletal sites in postmenopausal women: a 3-year retrospective longitudinal study. Osteoporos Int 2013;24:
2243-52.
34. Ahmed LA, Schirmer H, Berntsen GK, Fonnebo V, Joakim- sen RM. Features of the metabolic syndrome and the risk of non-vertebral fractures: the Tromso study. Osteoporos Int 2006;17:426-32.