D I A B E T E S & M E T A B O L I S M J O U R N A L
This is an Open Access article distributed under the terms of the Creative Commons Attribution Non-Commercial License (http://creativecommons.org/licenses/by-nc/4.0/) which permits unrestricted non-commercial use, distribution, and reproduction in any medium, provided the original work is properly cited.
Serum Soluble Epidermal Growth Factor Receptor Level Increase in Patients Newly Diagnosed with Type 2 Diabetes Mellitus
Ji Min Kim1, Sorim Choung2, Kyong Hye Joung1, Ju Hee Lee1, Hyun Jin Kim1, Bon Jeong Ku1
Departments of 1Internal Medicine, 2Medical Science, Chungnam National University School of Medicine, Daejeon, Korea
We analyzed circulating soluble epidermal growth factor receptor (sEGFR) levels in humans. Serum sEGFR levels were higher in subjects with newly diagnosed type 2 diabetes mellitus compared with controls. Serum sEGFR was positively correlated with gly- cosylated hemoglobin and serum glucose and negatively correlated with serum insulin and C-peptide levels.
Keywords: Biological assay; Diabetes mellitus, type 2; Receptor, epidermal growth factor
Corresponding author: Bon Jeong Ku http://orcid.org/0000-0002-3414-8949 Department of Internal Medicine, Chungnam National University School of Medicine, 266 Munhwa-ro, Jung-gu, Daejeon 35015, Korea
E-mail: [email protected]
INTRODUCTION
The epidermal growth factor receptor (EGFR; also known as ErbB1 and HER1) gene is a member of the ErbB receptor tyro- sine kinase family [1]. The soluble epidermal growth factor re- ceptor (sEGFR) is a 110 kDa peptide generated through pro- teolytic cleavage of a cell surface precursor of an alternately spliced EGFR isoform [2]. sEGFR has been detected in normal and malignant cells, many tissues, and in biological fluids. Re- cent studies suggest that sEGFR is a useful circulating serum biomarker in patients with cancer. However, the relationship between metabolic disorders and serum sEGFR levels remains poorly understood. In this study, we measured serum sEGFR levels in subjects with newly diagnosed type 2 diabetes mellitus (T2DM) and explored the correlations between serum sEGFR levels and various metabolic parameters.
METHODS
Study design
A total of 103 subjects with newly diagnosed T2DM and 109
healthy subjects without diabetes aged 18 years or older were recruited from the department of endocrinology at Chungnam National University Hospital from 2014 to 2016. Exclusion cri- teria included a history of taking oral hypoglycemic medica- tion or tyrosine kinase inhibitors (TKIs). Subjects with acute infectious disease and a history of malignancy were also ex- cluded. Medical history (age, sex, drugs used, smoking, and underlying disease) and anthropometric measurements (height and weight) were taken. Plasma samples were obtained from all subjects to measure biochemical markers at baseline and 2 hours after ingesting a 75-g oral glucose load. T2DM was diagnosed according to the 2016 American Diabetes Associa- tion criteria [3]. The Institutional Review Board (2014-12-013- 001) of Chungnam National University Hospital approved the protocol for this research, and written informed consent was obtained from all participants.
Biochemical data
Blood samples were collected using ethylenediaminetetraace- tic acid tubes in the morning after an overnight fast >8 hours and 2 hours after ingesting a 75-g oral glucose load. The lipid https://doi.org/10.4093/dmj.2017.0082
pISSN 2233-6079 · eISSN 2233-6087
profile (high density lipoprotein cholesterol [HDL-C], low density lipoprotein cholesterol [LDL-C], total cholesterol [TC], and triglycerides [TGs]) was measured using a blood chemis- try analyzer (Hitachi 747; Hitachi, Tokyo, Japan). Insulin was quantified using an immunoradiometric assay kit (DIAsource INS-IRMA Kit; DIAsource, Louvain-la-Neuve, Belgium). Gly- cosylated hemoglobin (HbA1c) was measured using high-per- formance liquid chromatography (BioRad Laboratories, Her- cules, CA, USA). Homeostatic model assessment of insulin re- sistance (HOMA-IR) and homeostatic model assessment of β-cell function (HOMA-β) were calculated as:
H OMA-IR=fasting serum insulin (µU/mL)×fasting plasma glucose (mmol/L)/22.5
H OMA-β=20×fasting serum insulin (µU/mL)/[fasting plasma glucose (mmol/L)−3.5]
Fasting serum sEGFR levels were measured using a quanti- tative sandwich enzyme immunoassay technique with an en- zyme-linked immunosorbent assay kit (Abcam, Cambridge, UK; catalog no. ab193764).
Statistical analyses
All parameter values were calculated as mean±standard devia- tion. A P<0.05 was considered statistically significant. The chi- square and Mann-Whitney U tests were used to compare the clinical characteristics and biochemical data between the two groups. Univariate and multivariate logistic regression analyses were used to assess the relationships between clinical charac- teristics, biochemical variables, and sEGFR levels.
RESULTS
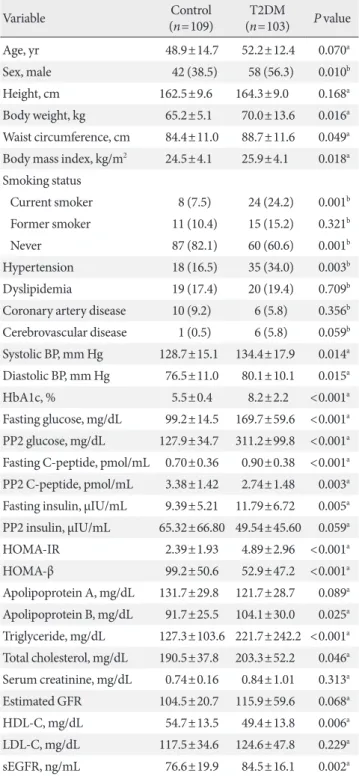
The clinical characteristics of the study participants are pre- sented in Table 1. Body mass index (BMI), body weight, waist circumference, glucose (fasting and 2-hour postprandial), C- peptide (fasting and 2-hour postprandial), insulin (fasting), HbA1c, HOMA-IR, HOMA-β, and TC in the T2DM group were higher than those in the controls; male gender, hyperten- sion, and current smoker were more common in the T2DM group. HDL-C was lower in the T2DM group than that in the control group. Additionally, sEGFR levels were significantly higher in participants with T2DM than in those without T2DM. We further adjusted for age, sex, BMI, serum creati- nine, and smoking status as confounders. Even after adjust- ments, there were still significant differences in sEGFR levels between subjects with and without T2DM (P=0.002) (data not
Table 1. Baseline characteristics
Variable Control
(n=109) T2DM
(n=103) P value
Age, yr 48.9±14.7 52.2±12.4 0.070a
Sex, male 42 (38.5) 58 (56.3) 0.010b
Height, cm 162.5±9.6 164.3±9.0 0.168a
Body weight, kg 65.2±5.1 70.0±13.6 0.016a Waist circumference, cm 84.4±11.0 88.7±11.6 0.049a Body mass index, kg/m2 24.5±4.1 25.9±4.1 0.018a Smoking status
Current smoker 8 (7.5) 24 (24.2) 0.001b Former smoker 11 (10.4) 15 (15.2) 0.321b
Never 87 (82.1) 60 (60.6) 0.001b
Hypertension 18 (16.5) 35 (34.0) 0.003b Dyslipidemia 19 (17.4) 20 (19.4) 0.709b Coronary artery disease 10 (9.2) 6 (5.8) 0.356b Cerebrovascular disease 1 (0.5) 6 (5.8) 0.059b Systolic BP, mm Hg 128.7±15.1 134.4±17.9 0.014a Diastolic BP, mm Hg 76.5±11.0 80.1±10.1 0.015a
HbA1c, % 5.5±0.4 8.2±2.2 <0.001a
Fasting glucose, mg/dL 99.2±14.5 169.7±59.6 <0.001a PP2 glucose, mg/dL 127.9±34.7 311.2±99.8 <0.001a Fasting C-peptide, pmol/mL 0.70±0.36 0.90±0.38 <0.001a PP2 C-peptide, pmol/mL 3.38±1.42 2.74±1.48 0.003a Fasting insulin, μIU/mL 9.39±5.21 11.79±6.72 0.005a PP2 insulin, μIU/mL 65.32±66.80 49.54±45.60 0.059a
HOMA-IR 2.39±1.93 4.89±2.96 <0.001a
HOMA-β 99.2±50.6 52.9±47.2 <0.001a
Apolipoprotein A, mg/dL 131.7±29.8 121.7±28.7 0.089a Apolipoprotein B, mg/dL 91.7±25.5 104.1±30.0 0.025a Triglyceride, mg/dL 127.3±103.6 221.7±242.2 <0.001a Total cholesterol, mg/dL 190.5±37.8 203.3±52.2 0.046a Serum creatinine, mg/dL 0.74±0.16 0.84±1.01 0.313a Estimated GFR 104.5±20.7 115.9±59.6 0.068a HDL-C, mg/dL 54.7±13.5 49.4±13.8 0.006a LDL-C, mg/dL 117.5±34.6 124.6±47.8 0.229a sEGFR, ng/mL 76.6±19.9 84.5±16.1 0.002a Values are presented as mean±standard deviation or number (%).
T2DM, type 2 diabetes mellitus; BP, blood pressure; HbA1c, glycosyl- ated hemoglobin; PP2, 2-hour postprandial; HOMA-IR, homeostatic model assessment of insulin resistance; HOMA-β, homeostatic model assessment of β-cell function; GFR, glomerular filtration rate; HDL- C, high density lipoprotein cholesterol; LDL-C, low density lipopro- tein cholesterol; sEGFR, soluble epidermal growth factor receptor.
aP value from independent t-test, bP value from chi-square test.
shown).
We also investigated the associations between sEGFR and clinical variables in the T2DM group. Univariate logistic re-
gression indicated that sEGFR levels were strongly associated with HbA1C (r=0.470, P<0.001), fasting glucose (r=0.407, P<0.001), postprandial glucose (r=0.469, P<0.001), postpran- Table 2. Regression analysis between various clinical factors and the soluble epidermal growth factor receptor in T2DM group
Variable Univariate regression Multivariate regression
R R2 β±SE P value Partial R2 β±SE P value
Male sex 0.159 0.025 –5.112±3.166 0.110
Age 0.276 0.076 –0.358±0.124 0.005 0.001 –0.053±0.161 0.744
Height 0.211 0.044 0.376±0.175 0.034 0.001 –0.081±0.226 0.723
Body weight 0.125 0.016 0.148±0.117 0.207
Waist circumference 0.242 0.059 –0.337±0.172 0.054
Body mass index 0.002 0.000 –0.007±0.394 0.986
Smoking status
Current smoker 0.163 0.026 6.153±3.712 0.101
Former smoker 0.125 0.016 1.895±1.491 0.207
Never 0.229 0.053 –3.716±1.570 0.020 0.060 –3.988±1.425 0.006
Hypertension 0.108 0.012 –3.633±3.339 0.279
Dyslipidemia 0.129 0.017 –5.199±3.988 0.195
Coronary artery disease 0.110 0.012 –7.532±6.749 0.267 Cerebrovascular disease 0.075 0.006 5.140±6.772 0.450
Systolic BP 0.062 0.004 –0.056±0.089 0.535
Diastolic BP 0.038 0.001 0.060±0.157 0.705
Hemoglobin 0.162 0.026 1.602±1.002 0.113
HbA1c 0.470 0.221 3.440±0.646 <0.001 0.166 3.143±0.675 <0.001
Fasting glucose 0.407 0.166 0.110±0.024 <0.001 0.016 0.074±0.052 0.155
PP2 glucose 0.469 0.220 0.075±0.015 <0.001 0.001 –0.002±0.029 0.951
Fasting C-peptide 0.160 0.026 –6.801±4.258 0.113
PP2 C-peptide 0.450 0.202 –4.770±1.034 <0.001 0.001 0.685±2.491 0.784
Fasting insulin 0.256 0.066 –0.620±0.238 0.011 0.037 –0.785±0.359 0.032
PP2 insulin 0.410 0.168 –0.142±0.034 <0.001 0.005 –0.080±0.092 0.388
HOMA-IR 0.056 0.003 –0.310±0.558 0.579
HOMA-β 0.296 0.087 –0.102±0.033 0.003 0.028 0.141±0.075 0.065
Apolipoprotein A 0.072 0.005 –0.044±0.084 0.603
Apolipoprotein B 0.226 0.051 0.131±0.077 0.094
Triglyceride 0.198 0.039 0.013±0.006 0.045 0.004 –0.007±0.010 0.497
Total cholesterol 0.366 0.134 0.113±0.029 <0.001 0.081 0.107±0.033 0.002
Serum creatinine 0.274 0.075 4.337±1.517 0.005 0.014 1.976±1.451 0.178
Estimated GFR 0.012 0.001 –0.003±0.027 0.907
HDL-C 0.064 0.004 –0.075±0.118 0.527
LDL-C 0.272 0.074 0.092±0.033 0.006 0.001 –0.011±0.106 0.921
T2DM, type 2 diabetes mellitus; SE, standard error; BP, blood pressure; HbA1c, glycosylated hemoglobin; PP2, 2-hour postprandial; HOMA- IR, homeostatic model assessment of insulin resistance; HOMA-β, homeostatic model assessment of β-cell function; GFR, glomerular filtration rate; HDL-C, high density lipoprotein cholesterol; LDL-C, low density lipoprotein cholesterol.
dial C-peptide (r=0.450, P<0.001), and insulin (r=0.410, P<
0.001). We also found a correlation between HOMA-β (r=
0.296, P=0.003), TC (r=0.366, P<0.001), TG (r=0.198, P=
0.045), serum creatinine (r=0.274, P=0.005), and LDL-C (r=
0.272, P=0.006). Multivariate analysis revealed that sEGFR level was associated with HbA1c (P<0.001) (Table 2).
DISCUSSION
In previous studies, sEGFR has been mainly evaluated as it re- lates to cancer, as plasma sEGFR is useful for predicting sur- vival in advanced non-small cell lung cancer [4], and sEGFR is a useful marker for predicting the prognosis or therapeutic re- sponse for cervical, colorectal, ovarian, and breast cancers [1].
However, few studies have been reported on other diseases, such as metabolic disease. In several studies, hyperglycemia has been reported as a side effect with increased use of a TKI as a target therapy in patients with cancer [5,6]. On the other hand, hypoglycemia was observed after TKI treatment in sub- jects with diabetes [7]. Taken together, sEGFR is related to glu- cose metabolism because many TKIs affect glucose metabo- lism and the EGFR. In this study, sEGFR level was higher in subjects with T2DM compared with that in the controls. A univariate analysis of the T2DM group revealed that sEGFR was correlated with HbA1c, fasting and 2-hour postprandial serum glucose, suggesting a possibility that EGFR could be a diagnostic marker for T2DM. Recently Kyohara et al. [8] re- ported that sEGFR was increased in T2DM patient, which is the same as our study result. However, this study has several limitations that insignificant difference of sEGFR levels, small study population, and the drug effect could not be ruled out because diabetic patients treated with oral hypoglycemic agents were included. In addition, since the above study was conducted on inpatients, there was likely to be a bias based on general health problem. In our study, we included more pa- tients and healthy controls, and patients were drug- naïve state.
The correlation between HOMA-IR and sEGFR levels showed negative in this study and positive in the study of Kyohara et al.
[8]. However, both were not statistically significant.
Moreover, a significant correlation was observed between LDL-C, TC, and serum creatinine in the diabetic group, which was expected to play roles as diagnostic markers for diabetes and help predict the risk of complications in patients with dia- betes. In addition, a negative correlation was observed between C-peptide and insulin levels, which may be helpful in predict-
ing insulin reserve in patients with newly diagnosed diabetes.
Kyohara et al. [8] reported that there was a positive correlation between serum fasting insulin and sEGFR levels, though cor- relation was not statistically significant. Additional studies will be needed to investigate this issue.
This study has several limitations. First, this was a retrospec- tive and cross sectional study, and sEGFR was measured only in the fasting sample. The change in sEGFR level according to glucose fluctuation was not confirmed. Second, the mecha- nism for increased sEGFR in diabetes was unclear. Consider- ing the previous studies [8-10], it is presumed that sEGFR may be associated with insulin signaling or pancreatic β-cell mass regulation. In order to investigate this issue, additional studies will be needed. The study of the mechanism may also help to confirm the correlation between fasting insulin and sEGFR mentioned earlier.
In conclusion, our study demonstrates for the first time that sEGFR levels are higher in patients with newly diagnosed T2DM. Moreover, sEGFR was significantly correlated with HbA1c and serum glucose in patients with T2DM.
CONFLICTS OF INTEREST
No potential conflict of interest relevant to this article was re- ported.
ACKNOWLEDGMENTS
The biospecimens and data used for this study were provided by the Biobank of Chungnam National University Hospital, a mem- ber of the Korea Biobank Network. This work was supported by the National Research Foundation of Korea (NRF) grant funded by the Korean Government (NRF-2016R1D1A1A09916900).
REFERENCES
1. Guillaudeau A, Durand K, Bessette B, Chaunavel A, Pom- mepuy I, Projetti F, Robert S, Caire F, Rabinovitch-Chable H, Labrousse F. EGFR soluble isoforms and their transcripts are expressed in meningiomas. PLoS One 2012;7:e37204.
2. Wilken JA, Perez-Torres M, Nieves-Alicea R, Cora EM, Chris- tensen TA, Baron AT, Maihle NJ. Shedding of soluble epider- mal growth factor receptor (sEGFR) is mediated by a metallo- protease/fibronectin/integrin axis and inhibited by cetuximab.
Biochemistry 2013;52:4531-40.
3. American Diabetes Association. 2. Classification and diagnosis of diabetes. Diabetes Care 2016;39 Suppl 1:S13-22.
4. Jantus-Lewintre E, Sirera R, Cabrera A, Blasco A, Caballero C, Iranzo V, Rosell R, Camps C. Analysis of the prognostic value of soluble epidermal growth factor receptor plasma concentra- tion in advanced non-small-cell lung cancer patients. Clin Lung Cancer 2011;12:320-7.
5. Racil Z, Razga F, Drapalova J, Buresova L, Zackova D, Palacko- va M, Semerad L, Malaskova L, Haluzik M, Mayer J. Mecha- nism of impaired glucose metabolism during nilotinib therapy in patients with chronic myelogenous leukemia. Haematologi- ca 2013;98:e124-6.
6. Villadolid J, Ersek JL, Fong MK, Sirianno L, Story ES. Manage- ment of hyperglycemia from epidermal growth factor receptor (EGFR) tyrosine kinase inhibitors (TKIs) targeting T790M- mediated resistance. Transl Lung Cancer Res 2015;4:576-83.
7. Huda MS, Amiel SA, Ross P, Aylwin SJ. Tyrosine kinase inhibi- tor sunitinib allows insulin independence in long-standing type 1 diabetes. Diabetes Care 2014;37:e87-8.
8. Kyohara M, Shirakawa J, Okuyama T, Kimura A, Togashi Y, Tajima K, Hirano H, Terauchi Y. Serum quantitative proteomic analysis reveals soluble EGFR to be a marker of insulin resis- tance in male mice and humans. Endocrinology 2017;158:
4152-64.
9. Miettinen PJ, Ustinov J, Ormio P, Gao R, Palgi J, Hakonen E, Juntti-Berggren L, Berggren PO, Otonkoski T. Downregulation of EGF receptor signaling in pancreatic islets causes diabetes due to impaired postnatal beta-cell growth. Diabetes 2006;55:
3299-308.
10. Miettinen P, Ormio P, Hakonen E, Banerjee M, Otonkoski T.
EGF receptor in pancreatic beta-cell mass regulation. Biochem Soc Trans 2008;36(Pt 3):280-5.