INTRODUCTION
Until recently, the Durie Salmon (DS) staging system was primarily used in patients with multiple myeloma (MM) (1).
This staging system was designed according to cell mass, uti- lizing hemoglobin, serum calcium, lytic bone lesions, and M component production rates as measurements, with each stage divided into A and B subgroups according to renal function.
More recently, the Southwest Oncology Group (SWOG) introduced a new staging system with beta 2-microglobulin (S 2M) and albumin as prognostic factors (2). The SWOG staging system has been regarded as an easy, as well as good indicator of event-free survival, first-year mortality, and long- term survival. However, the SWOG system still requires more time and practice until it becomes the standard method.
S 2M, which is thought to reflect known tumor cell bur- den, has been regarded as the most important prognostic factor in MM. Although S 2M concentration is influenced by kidney function, multivariate analysis showed that it re- mains an independent prognostic factor after correction for serum creatinine concentration (3-7).
However, in patients with mild to moderate renal insuffi- ciency, S 2M may be a better indicator of glomerular filtra- tion rate (GFR) than serum creatinine (8, 9). We therefore compared S 2M with 24 urinary Ccr as prognostic factors in MM patients, and determined the significance of 24 hr urinary creatinine clearance (Ccr) in the staging of patients with MM.
MATERIALS AND METHODS Subjects
We retrospectively reviewed the records of all 268 symp- tomatic MM patients admitted and newly diagnosed at Asan Medical Center, Seoul, Korea, from 1 January 1996 to 30 November 2003. The 24-hr urinary Ccr was available at the time of diagnosis for 170 of these symptomatic MM patients, and these 170 patients were enrolled into the study. Survival time was followed until 30 April 2005.
All the patients had symptomatic MM in accordance with the diagnostic criteria of the International Myeloma Working Group (2003) (11). These criteria are defined as: 1) M-pro- tein in serum and/or urine; 2) bone marrow (clonal) plasma cells or plasmacytomas; 3) related organ or tissue impairment (end organ damage, including bone lesions); and 4) no min- imal level of clonal bone marrow plasma cells.
Patients with nonsecretory myeloma, smoldering multiple myeloma, POEMS (polyneuropathy, organomegaly, endocri- nopathy, monoclonal gammopathy, and skin changes), plas- ma cell leukemia, light chain deposit disease, MGUS (mon- oclonal gammopathy of undermined significance), extra- medullary plasmacytoma, a combination of other malignan- cies, severe trauma were excluded.
Jae-Pil Yun, Cheolwon Suh, Eunkyoung Lee*, Jai Won Chang, Won Seok Yang, Jung Sik Park, Su-Kil Park
Department of Internal Medicine, University of Ulsan College of Medicine, Seoul; Department of Internal Medicine, Dankook University Hospital*, Cheonan, Korea
Address for correspondence Su-Kil Park, M.D.
Department of Internal Medicine, Division of Nephrology, University of Ulsan College of Medicine, 388-1 Pungnap-2 dong, Songpa-gu, Seoul 138-736, Korea Tel : +82.2-3010-3260, Fax : +82.2-3010-6963 E-mail : skpark@amc.seoul.kr
639
Comparison of Serum Beta 2-Microglobulin and 24 hour Urinary Creatinine Clearance as a Prognostic Factor in Multiple Myeloma
A new staging system for multiple myeloma (MM) has utilized serum concentrations of beta 2-microglobulin (S 2M) and albumin as important prognostic factors for sur- vival. Since S 2M is an indicator of glomerular filtration rate, we compared the prog- nostic values of S 2M and 24-hr urinary creatinine clearance (Ccr) in patients with MM. We retrospectively reviewed the records of 170 MM patients from January 1996 to November 2003 whose 24-hr urinary Ccr was available at the time of diag- nosis. We found that pretreatment S 2M was inversely related to Ccr (Spearman’s correlation coefficient=-0.787). In univariate analysis, the hazard ratio (HR) of death was 1.043 (p<0.001) for S 2M and 0.985 (p<0.001) for Ccr. Multivariate analysis showed that S 2M (HR 1.030, p=0.010) and Ccr (HR 0.993, p=0.059) were signifi- cant prognostic factors in patients’ survival. In conclusion, 24-hr urinary Ccr may be utilized for staging of patients with MM.
Key Words : Multiple Myeloma; beta 2-Microglobulin; Glomerular Filtration Rate
Received : 22 September 2005 Accepted : 8 February 2006
Parameters
We investigated age, sex, heavy chain types, light chain types, Durie-Salmon stage, S 2M, hemoglobin, serum cal- cium, serum albumin, serum creatinine, and 24 hr urine cre- atinine clearance before chemotherapy. S 2M was measured by a radioimmunoassay with 125I- labeled beta 2-microglob- ulin.
Treatment
Whereas patients received various treatments, they could be divided into 3 groups; those who received conservative treatment (no treatment or dexamethasone [20 mg/m2oral- ly] only), those who received conventional chemotherapy (e.g., VAD, MP, high dose cytoxan plus predinisolone, and thalido- mide plus dexamethasone regimens), and those who received autologous stem cell transplantation.
The MP regimen consisted of melphalan (8 mg/m2) and prednisolone (60 mg/m2) for 4 days; the VAD regimen con- sisted of vincristine (0.4 mg), doxorubicin (9 mg/m2) for 4 days, and dexamethasone (40 mg) for 12 days. The high dose cytoxan plus prednisolone regimen consisted of cytoxan (400 mg/m2) for 1 day and prednisolone (40 mg/m2) for 7 days and was a variant of the VBMCP (vincristine, BCNU, mel- phalan, cytoxan, prednisolone) regimen. The thalidomide plus dexamethasone regimen consisted of 200 mg thalido- mide orally per day plus 5 to 10 mg dexamethasone intra- venously 4 times per day.
Survival time
Medical records were used to collect data. Interviews with patients’ families by telephone and data from the hospital network connected to the Korean National Statistical Office were also utilized to determine the patient survival times.
Staging system
Patients were divided depending on DS stage, which was assigned by physicians who first examined them (1). Then, they were resorted by SWOG staging system according to S 2M and albumin concentrations (2).
SWOG stage 1 was defined as S 2M <2.5 mg/L; stage 2 as 2.5 mg/L ≤S 2M <5.5 mg/L; stage 3, S 2M ≥5.5 mg/
L and serum albumin ≥3.0 g/dL; and stage 4, S 2M ≥5.5 mg/L and albumin <3.0 g/dL.
During the course of this study, we formulated a new ex- perimental staging system based on 24 hr urinary Ccr and serum albumin. In this system, stage 1 defined as Ccr ≥90 mL/min; stage 2 as 90 mL/min >Ccr ≥30 mL/min; stage 3 as Ccr <30 mL/min and albumin ≥3.0 g/dL; stage 4 as Ccr
<30 mL/min and albumin <3.0 g/dL.
Statistical analysis
SPSS (version 11.0) was used to determine the means and standard deviations and medians of patient characteristics of patients and laboratory findings. One-way ANOVA and Student’s t test were used to compare mean Ccr according to heavy or light chain types. An interactive graph of Ccr and S 2M was drawn using a scatter plot and a logarithmic estimated curve.
The Kaplan-Meier method was utilized for survival anal- ysis with log rank test; statistical significance was defined as p value less than 0.05.
The Cox proportional hazard model was employed for uni- variate analysis and multivariate analyses to confirm the sig- nificance of risk factors of death. In multivariate analysis, we used eliminated variables stepwise (backward) by a signifi- cance of less than 10%.
RESULTS Study population
From 1 January 1996, through 30 November 2003, 289 patients with plasma cell disorders were admitted to our Cen- ter. Among them, there were 268 symptomatic MM patients.
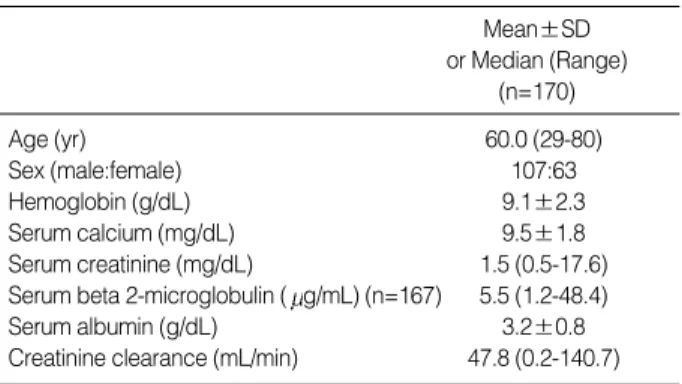
We excluded 14 patients with other monoclonal gammopa- thies and 7 patients with combining other malignancy or severe trauma. Gammopathies other than symptomatic multiple myeloma were 3 MUGS, 2 plasma cell leukemia, 2 smolder- ing MM, 2 nonsecretory MM, 1 extramedullary plasmacy- toma, 1 multiple solitary plasmacytoma, and 3 POEMS. As to 170 patients, 24-hr urinary creatinine clearance was avail- able at the time of diagnosis. Baseline characteristics and lab- oratory findings at the time of diagnosis are shown in Table 1.
Table 2 shows the mean Ccr of each type. The mean Ccr in patients with free light chain was lower than those of the heavy and light chain type groups. Mean Ccr of patients with free light chain was 36.2 mL/min, whereas those of patients with IgG type and IgA were 54.9 mL/min and 62.2 mL/min (p=0.005), respectively. However, mean S 2M of patients
Mean±SD or Median (Range)
(n=170)
Age (yr) 60.0 (29-80)
Sex (male:female) 107:63
Hemoglobin (g/dL) 9.1±2.3
Serum calcium (mg/dL) 9.5±1.8
Serum creatinine (mg/dL) 1.5 (0.5-17.6) Serum beta 2-microglobulin ( g/mL) (n=167) 5.5 (1.2-48.4)
Serum albumin (g/dL) 3.2±0.8
Creatinine clearance (mL/min) 47.8 (0.2-140.7) Table 1.Baseline characteristics of the patients
according to heavy chain types was not significantly differ- ent (p=0.156).
Of the 170 patients, 28 patients were managed conserva- tively, 92 patients were treated with conventional chemother- apy, and 50 patients received high-dose chemotherapy with autologous stem cell transplantations. The first-line chemo- therapy regimens consisted of VAD in 94 patients, MP in 41, cytoxan plus prednisolone in 4, thalidomide plus dexametha- sone in 1. The chemotherapy regimen was unidentified in 2 patients.
We could definitively identify cause of death only if patients died in hospital, although we attempted to interview by tele- phone family members of patients who died outside of hos- pital to exclude death by accidental trauma. Of the 51 patients who died in hospital, 28 died of sepsis, 9 of respiratory fail- ure, 4 of heart failure, 2 of major bleeding, 1 of arrhythmia, 3 of acute renal failure, 1 of acute myocardial infarction, 1 of subdural hemorrhage, and 2 of hepatic failure.
Among the 268 symptomatic MM patients, only 3 patients had hemodialysis before diagnosis because of acute renal fail- ure; these patients did not have any other specific etiology, such as diabetes mellitus or hypertension. In all 3 persons, Ccr was measured at diagnosis, and all 3 were enrolled in this study.
Univariate and multivariate analysis
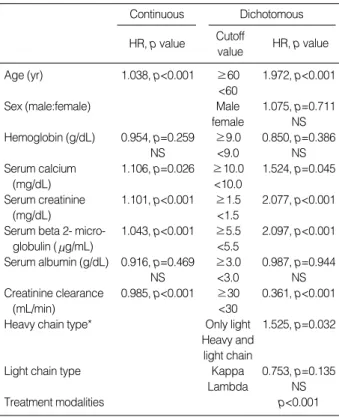
Univariate analysis showed that age, serum calcium, serum creatinine, S 2M, Ccr, free light chain type, and treatment modalities were significant prognostic factors, using both the continuous and dichotomous methods (Table 3). The conser- vative management group had a shorter life expectancy than both the conventional chemotherapy group (hazard ratio [HR]
2.021, p=0.004) and the autologous transplantation group (HR 9.020, p<0.001). However, S 2M concentration was not sig-
nificant in univariate analysis of 104 patients with Ccr ≥30 mL/min (HR 1.001, p=0.982) (Table 4).
Multivariate analysis of prognostic factors using the Cox proportional hazard model showed that serum S 2M, crea- tinine clearance, and treatment modalities were significant prognostic factors in continuous method (Table 6). Ccr was of borderline significance and was not eliminated by back- ward stepwise calculation if p=0.10. Using the dichotomous method, however, the result was somewhat different. If the Ccr cut-off value was 30 mL/min and that of S 2M was 5.5 mg/L, Ccr and treatment were significant, but S 2M concen- tration was not. This discrepancy was due to the close rela- tionship of S 2M and Ccr, making it difficult to determine a standard cutoff value using the dichotomous method.
Ccr No. (mean±SD)
(mL/min)
S 2M No. (mean±SD)
( g/mL) Heavy chain
IgG 68 54.9±37.9 67 9.9±11.4
IgA 36 62.2±35.7 36 8.1±9.2
Free light chain 50 36.2±31.0* 48 13.3±11.4
IgD 14 50.3±36.7 14 10.5±8.2
IgM 1 (102.6) 1 (2.6)
biclonal 1 (86.2) 1 (4.1)
p=0.005 p=0.156
Light chain�
Lambda 86 50.1±37.8 84 10.5±10.6
Kappa 83 51.9±35.7 82 10.4±11.1
p=0.751 p=0.961
*p<0.05 between patients with IgG type and free light chain type, or between IgA type and free light chain type, �One with only IgG heavy chain type was excluded.
Table 2.Types of heavy chains and light chains
Continuous Dichotomous
HR, p value Cutoff
value HR, p value
Age (yr) 1.038, p<0.001 ≥60 1.972, p<0.001
<60
Sex (male:female) Male 1.075, p=0.711
female NS
Hemoglobin (g/dL) 0.954, p=0.259 ≥9.0 0.850, p=0.386
NS <9.0 NS
Serum calcium 1.106, p=0.026 ≥10.0 1.524, p=0.045
(mg/dL) <10.0
Serum creatinine 1.101, p<0.001 ≥1.5 2.077, p<0.001
(mg/dL) <1.5
Serum beta 2- micro- 1.043, p<0.001 ≥5.5 2.097, p<0.001
globulin ( g/mL) <5.5
Serum albumin (g/dL) 0.916, p=0.469 ≥3.0 0.987, p=0.944
NS <3.0 NS
Creatinine clearance 0.985, p<0.001 ≥30 0.361, p<0.001
(mL/min) <30
Heavy chain type* Only light 1.525, p=0.032 Heavy and
light chain
Light chain type Kappa 0.753, p=0.135
Lambda NS
Treatment modalities p<0.001
HR, hazard risk of death; NS, not significant.
*heavy chain type, Free light chain type vs. both heavy and light chain type.
Table 3.Hazard ratio in univariate analysis
Continuous Dichotomoud
HR, p value Cutoff
value HR, p value
S 2M ( g/mL) 1.001, p=0.982 ≥5.5 1.114, p=0.736
<5.5
Ccr (mL/min) 0.987, p=0.015 ≥90 0.499, p=0.034
<90
S 2M, Serum beta 2-microglobulin; Ccr, Creatinine clearance; HR, haz- ard risk of death.
Table 4.Hazard ratio in univariate analysis if Ccr ≥30 mL/min
Correlation of beta 2-microglobulin and creatinine clearance
When we drew a scatter plot of S 2M and Ccr prior to the start of chemotherapy (Fig. 1), we found that pretreatment S 2M was inversely related to Ccr (Spearman’s correlation efficient -0.787, p<0.001).
Stage
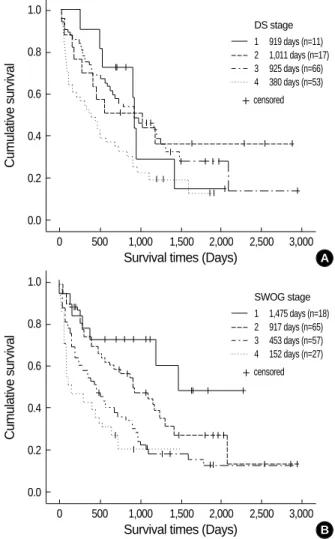
Fig. 2 shows survival curves relative to DS stage and SWOG stage. Because we enrolled only patients whose DS stage was recorded by doctors at the time of diagnosis, the total num- ber according to DS stage was 147 (95 dead, 52 alive). Because S 2M was not checked in 3 patients in the study group, the total number according to SWOG stage was 167 (112 dead, 55 alive).
Median overall survival times according to DS stage were 919 days for stage 1 (n=11), 1011 days for stage 2 (n=17), 925 days for stage 3A (n=66), and 380 days for stage 3B (n=
53).
Median survival times according to SWOG stage were 1475 days for stage 1 (n=18), 917 days for stage 2 (n=65),
453 days for stage 3 (n=57), and 152 days for stage 4 (n=
27) (log rank test <0.0001).
Possible staging system
Univariate analysis showed that, as Ccr increased, patient
Continuous
Hazard ratio Confidence interval Significance
Dichotomous*
Hazard ratio Confidence interval Significance
S 2M 1.030 1.007-1.053 p=0.010 Ccr ≥30 0.403 0.275-0.591 p<0.001
Ccr 0.993 0.986-1.000 p=0.059� Treatment�1),3) 7.945 4.052-15.577 p<0.001
Treatment�1),3) 8.642 4.389-17.018 p<0.001 Treatment�2),3) 3.717 2.147-6.435 p<0.001 Treatment�2),3) 3.866 2.210-6.760 p<0.001
Table 5.Multivariate analysis by Cox proportional hazard model (backward)
�Borderline significant and not eliminated backward stepwise calculations at a significance of 10%; �Treatments; 1) Conservative management, 2) Con- ventional chemotherapy, and 3) Autologous stem cell transplantation.
*Dichotomous: Cutoff values were Ccr ≥30 or <30 mL/min and S 2M ≥5.5 or <5.5 g/mL.
Dichotomous results could not be accepted with confidence because the change in cutoff value of Ccr led to different outcomes. For example, if the cutoff value of Ccr was ≥50 or <50 mL/min and if S 2M ≥5.5 or <5.5 g/mL, S 2M, treatment modalities, heavy chain type, serum calcium became significant prognostic factors. This result might be caused by the close relationship between S 2M and Ccr.
S2M (g/mL)
50.0
40.0
30.0
20.0
10.0
0.0
0.0 30.0 60.0 90.0 120.0 150.0
Ccr (mL/min)
Fig. 1.Relationship of beta 2-microglobulin and 24 hr urinary cre- atinine clearance before chemotherapy.
Observed Logarithmic
Cumulative survival
1.0
0.8
0.6
0.4
0.2
0.0
0 500 1,000 1,500 2,000 2,500 3,000 Survival times (Days)
Fig. 2.Survival curves according to DS stage (A) and SWOG stage (B) with serum beta 2-microglobulin and serum albumin.
DS stage 1 919 days (n=11) 2 1,011 days (n=17) 3 925 days (n=66) 4 380 days (n=53)
Cumulative survival
1.0
0.8
0.6
0.4
0.2
0.0
0 500 1,000 1,500 2,000 2,500 3,000 Survival times (Days)
SWOG stage 1 1,475 days (n=18) 2 917 days (n=65) 3 453 days (n=57) 4 152 days (n=27) censored
censored A
B
survival time increased. Furthermore S 2M was closely relat- ed with Ccr. We therefore formulated a new staging system based on Ccr instead of S 2M, plus serum albumin (Fig. 3).
According to this system, stage 1 is Ccr ≥90 mL/min; stage 2 is 90 mL/min > Ccr ≥30 mL/min; stage 3 is Ccr <30 mL/
min and albumin ≥3.0 g/dL; stage 4, Ccr <30 mL/min and albumin <3.0 g/dL.
Applying this system, we found that 30 patients (12 dead, 18 alive) were stage 1, 74 (44 dead, 30 alive) were stage 2, 46 (42 dead, 4 alive) were stage 3, and 20 (17 dead, 3 alive) were stage 4.
According to this staging system, the median survival times were 1,475 days for stage 1, 889 days for stage 2, 339 days for stage 3, and 95 days for stage 4 (log rank test <0.0001).
DISCUSSION
In MM, the importance of S 2M has led to the introduc- tion of the SWOG staging system. In an attempt to deter- mine the relationship between S 2M and kidney function and to choose a more significant prognostic factor, we were unable to find any study that included both 24 hr urinary Ccr and S 2M as prognostic factors. Thus, to our knowledge, this study is the first to include both of these as prognostic factors.
We found that in MM, S 2M and Ccr were more closely related than we expected. Multivariate analysis showed that S 2M, Ccr, and treatment modalities were independent prog- nostic factors. Thus, the results of this study suggest that Ccr is a new, powerful prognostic factor in the patients with MM.
Moreover, this finding indicates that Ccr can be incorporat- ed into a discrete new staging system for MM.
It was interesting that S 2M was not significant in patients whose Ccr was greater than 30 mL/min. That is, the incre- mental addition of S 2M concentration was not a significant
prognostic factor if kidney function was relatively good. Thus, the effect of S 2M on patient survival might be mainly due to declining kidney function.
Our new staging system used Ccr instead of S 2M. The latter is not likely to be a specific tumor marker in MM. This finding indicates that patient survival is related to the dec- reased excretion of S 2M rather than to its overproduction.
There is evidence that S 2M reflects glomerular filtration rate in many situations, although it also reflects tumor cell mass (9-11). Although our Kaplan-Meier curves of stages relative to Ccr and serum albumin concentrations were discrete, they were unable to show that Ccr was a more significant prognos- tic factor than S 2M. These two factors, plus serum creatinine, are related, and other conflicting factors affect survival, thus making interpretation difficult. Differences in mean Ccr bet- ween patients with both heavy and light chains and those with only free light chains may be related to different sur- vival times. Although the SWOG staging system has been regarded as easier and likely to supersede the DS staging sys- tem, it is cautious to determine the superiority between the two staging systems. Serum albumin was not a significant prognostic in univariate analysis, but, in the SWOG staging system, it was important in sorting patients with advanced stage MM.
Our study had several limitations. First, we may have in- cluded patients who died accidentally, since the causes of death of patients who died outside the hospital could not be deter- mined. Second, this retrospective study did not include im- portant parameters such as performance status, C reactive protein, chromosome 13 abnormality, and plasma cell label- ing index (12, 13).
In conclusion, we found that in patients with MM, S 2M was an independent significant prognostic factor in multiva- riate analysis that included Ccr. Although closely related to S 2M, Ccr was also a significant prognostic factor that could replace S 2M in staging systems of MM. Mean Ccr differed among heavy chain types, and these differences were likely related to different survival times.
REFERENCES
1. Durie BG, Salmon SE. A clinical staging system for multiple myelo- ma. Correlation of measured myeloma cell mass with presenting clin- ical features, response to treatment, and survival. Cancer 1975; 36:
842-54.
2. Jacobson JL, Hussein MA, Barlogie B, Durie BG, Crowley JJ; South- west Oncology Group. A new staging system for multiple myeloma patients based on the Southwest Oncology Group (SWOG) experi- ence. Br J Haematol 2003; 122: 441-50.
3. Cuzick J, Cooper EH, MacLennan IC. The prognostic value of serum beta 2 microglobulin compared with other presentation features in myelomatosis. Br J Cancer 1985; 52: 1-6.
4. Alexanian R, Barlogie B, Fritsche H. Beta 2 microglobulin in multi- Fig. 3.Survival curves according to new staging system with Ccr
and serum albumin.
Cumulative survival
1.0
0.8
0.6
0.4
0.2
0.0
0 500 1,000 1,500 2,000 2,500 3,000 Survival times (Days)
New stage 1 1475 days (n=30) 2 889 days (n=74) 3 339 days (n=46) 4 95 days (n=20) censored
ple myeloma. Am J Hematol 1985; 20: 345-51.
5. Scarffe JH, Anderson H, Palmer MK, Crowther D. Prognostic signifi- cance of pretreatment serum beta 2-microglobulin levels in multiple myeloma. Eur J Cancer Clin Oncol 1983; 19: 1361-4.
6. Bataille R, Grenier J, Sany J. Beta-2-microglobulin in myeloma: opti- mal use for staging, prognosis, and treatment; a prospective study of 160 patients. Blood 1984; 63: 468-76.
7. Cuzick J, De Stavola BL, Cooper EH, Chapman C, MacLennan IC.
Long-term prognostic value of serum beta 2 microglobulin in myelo- matosis. Br J Haematol 1990; 75: 506-10.
8. Donadio C, Lucchesi A, Ardini M, Giordani R. Cystatin C, beta 2- microglobulin, and retinol-binding protein as indicators of glomeru- lar filtration rate: comparison with plasma creatinine. J Pharm Bio- med Anal 2001; 24: 835-42.
9. Jovanovic D, Krstivojevic P, Obradovic I, Durdevic V, Dukanovic L.
Serum cystatin C and beta2-microglobulin as markers of glomeru- lar filtration rate. Ren Fail 2003; 25: 123-33.
10. Bianchi C, Donadio C, Tramonti G, Consani C, Lorusso P, Rossi G.
Reappraisal of serum beta2-microglobulin as marker of GFR. Ren Fail 2001; 23: 419-29.
11. International Myeloma Working Group. Criteria for the classifica- tion of monoclonal gammopathies, multiple myeloma and related disorders: a report of the International Myeloma Working Group.
Br J Haematol 2003; 121: 749-57.
12. Facon T, Avet-Loiseau H, Guillerm G, Moreau P, Genevieve F, Zan- decki M, Lai JL, Leleu X, Jouet JP, Bauters F, Harousseau JL, Bataille R, Mary JY; Intergroupe Francophone du Myelome. Chromosome 13 abnormalities identified by FISH analysis and serum beta2-micro- globulin produce a powerful myeloma staging system for patients receiving high-dose therapy. Blood 2001; 97: 1566-71.
13. Greipp PR, Lust JA, O’Fallon WM, Katzmann JA, Witzig TE, Kyle RA. Plasma cell labeling index and beta 2-microglobulin predict survival independent of thymidine kinase and C-reactive protein in multiple myeloma. Blood 1993; 81: 3382-7.