Assessing Web Browser Security Vulnerabilities with respect to CVSS
HyunChul Joh
†ABSTRACT
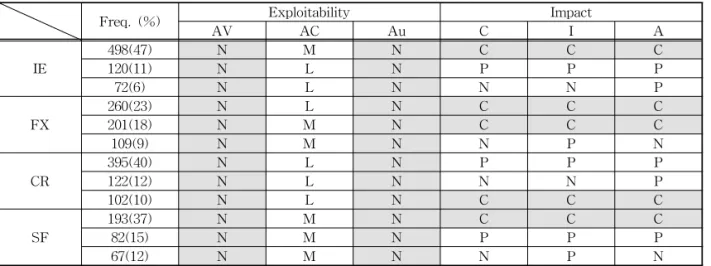
Since security vulnerabilities newly discovered in a popular Web browser immediately put a number of users at risk, urgent attention from developers is required to address those vulnerabilities. Analysis of characteristics in the Web browser vulnerabilities can be used to assess security risks and to determine the resources needed to develop patches quickly to handle vulnerabilities discovered. So far, being a new research area, the quantitative aspects of the Web browser vulnerabilities and risk assessments have not been fully investigated. However, due to the importance of Web browser software systems, further detailed studies are required related to the Web browser risk assessment, using rigorous analysis of actual data which can assist decision makers to maximize the returns on their security related efforts. In this paper, quantitative software vulnerability analysis has been presented for major Web browsers with respect to the Common Vulnerability Scoring System. Further, vulnerability discovery trends in the Web browsers are also investigated. The results show that, almost all the time, vulnerabilities are compromised from remote networks with no authentication required systems. It is also found that a vulnerability discovery model which was originally introduced for operating systems is also applicable to the Web browsers.
Key words: Software Security Vulnerability, Web Browser, CVSS, VDM, AML
※ Corresponding Author : HyunChul Joh, Address:
(712-701) Gamasilgil 50, Hayangup, Gyeongsan, Gyeong- buk, Korea, TEL : +82-53-600-5563, FAX : +82-53-600- 5579 , E-mail : [email protected]
Receipt date : Nov. 29, 2014, Revision date : Dec. 30, 2014
Approval date : Jan. 12, 2015
†
Dept. of Computer Eng., College of IT Convergence, Kyungil University
※ This research was supported by the intramural re- search program in Kyungil university.
1. INTRODUCTION
These days, a web browser is the most important application, which provides the connectivity to the Web servers on the Internet. Nevertheless, from the early age, numerous security holes have been discovered in the Web browsers. In fact, more than two-third of attacks to the Internet users exploit vulnerabilities of browsers or their plug-ins [1].
Many of the security bugs provide attackers or malicious users opportunities to bypass the se- curity barrier, and the Web browser vulnerabilities represent one of the main avenues for the spread for the viruses and worms. However, in spite of the risks involved, the convenience and dynamic technical functionality offered by the Web brows-
ers make them indispensable.
Web browsers are used for variety of purposes,
such as personal entertainments, eLearning, online
banking, or even highly confidential governmental
tasks. Consequently, new vulnerabilities dis-
covered in the Web browser put millions of the
Web users at risk, requiring urgent attention from
developers to address there vulnerabilities. Natur-
ally, there have been significant concerns about
possible exploitation of security holes in the sys-
tems because of their vulnerabilities which are now
subject to increasing everybody's attention. As a
result, there are considerable discussions of Web
browser security in recent years. However, in
many cases, those studies are focused on detection
and prevention of individual vulnerabilities. Al-
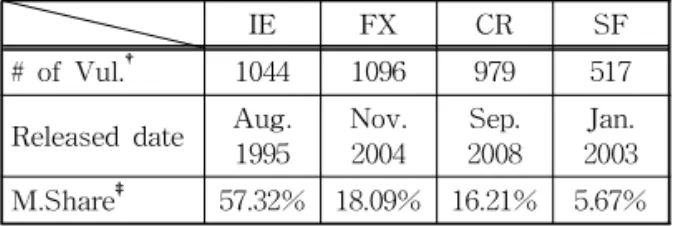
Table 1. The four Web browsers
IE FX CR SF
# of Vul.
†1044 1096 979 517
Released date Aug.
1995 Nov.
2004 Sep.
2008 Jan.
2003 M.Share
‡57.32% 18.09% 16.21% 5.67%
†
number of vulnerabilities http://nvd.nist.org/ (Sep.
27
th2014)
‡
market share http://www.netmarketshare.com/ (Sep.
27
th2014)
though quantitative data is sometimes cited, often there is no significant critical investigation.
Software vulnerabilities can be defined as soft- ware defects or weaknesses in the security system which might be exploited by malicious users caus- ing loss or harm [2]. Those vulnerabilities are great concern since they provide attackers the ability to gain full control of the system or leakage of highly sensitive information. In this paper, first we quan- titatively examine the vulnerability discovery process on the four Web browsers (Internet Ex- plorer (IE), Firefox (FX), Chrome(CR) and Safari (SF)) by applying the AML [3] vulnerability dis- covery model. And then, we investigate the se- cureness of the four Web browsers with respect to the CVSS.
Table 1 shows the number of vulnerabilities for each Web browser with initial release dates and market share information. Higher market share means more efficient for malicious users because they would find it more profitable and satisfying to devote their time on software. As a result, a smaller number of known vulnerabilities does not necessarily means a more secure software system.
In Table 1, we cannot say that Safari is more se- cure than others, only because of the small number of vulnerabilities.
A quantitative analysis allows both developers and end-users to assess the potential exposure to exploitation risks. The developers can plan testing and allocation of resource more efficiently for soft- ware updates and patches and the end-users can
use vulnerability discovery models to choose their web browsers and determine what safety meas- ures to use.
A two-page long preliminary version of this work was presented as a conference paper [4].
Here, we newly introduced vulnerability discovery process section and added more insights and analysis. The rest of the paper is organized as follows. Section 2 presents some of the related works and section 3 reviews CVSS which requires readers to understand later section. Section 4 in- vestigates vulnerability discovery process in the Web browsers, and Section 5 analyzes each ele- ment from the CVSS base metric. Section 6 con- cludes this work.
2. RELATED WORKS
Frei et al. [5] have shown that a significant number of the Internet users are exposed at risk because many of them tend to delay updating the Web browsers and plug-ins when new patches are available. In the paper, they quantified the risk posed by delayed patching. Duebendorfer and Frei [6] have further investigated the web browser up- dates for four different browsers and concluded that silent updates are the most effective mecha- nism for users. Acer and Jackson [7] question the view that browsers with infrequent security patches are safer. They propose methods for eval- uating browser security that take into account new industry practices such as silent patch deployment.
Grosskurth and Godfrey [8] have used a semi-au- tomated analysis method to investigate the archi- tecture and evolution of web browsers. They have examined different strategies for code reuse, emer- gent domain boundaries, convergent evolutions, and debate between open and closed source devel- opment approaches.
Schryen [9] has empirically examined the vul-
nerability discovery processes in several software
systems and found that many of the systems
shows a significant linear or piecewise linear rela- tionship between time and the cumulative number of published vulnerabilities, but did not investigate the underlying causes of the linear growth.
There are important factors that impact the vul- nerability discovery rate for a product. The most significant among them are code size, software age, popularity and software evolution. Several studies [10-13] have examined the relationship be- tween the code size and the number of defects. The studies suggest that the number of defects in- creases with code. The first order approximation assumes a linear relationship between the code size and the number of defects, which allows definition of the concept of defect density. Since the vulner- abilities are a class of defects, a similar measure called vulnerability density [14] can be defined.
Vulnerability Discovery Models (VDMs) de- scribe the discovery of vulnerabilities with the passage of time. A few vulnerability discovery models have recently been proposed. One of the most well-known VDMs is the Alhazmi-Malaiya Logistic (AML) model [3] which was originally proposed and validated for operating systems. Joh and Malaiya [15] compares AML with other types of S-shaped VDMs based on the skewness in ex- amined datasets. It shows that AML and Gamma distribution based model perform better than other S-shaped models with skewed left and right data- sets respectively.
Compared with other software systems such as operating systems and office software products, newer versions of the Web browsers tend to be released faster. A new version of a software sys- tem adds new functions and implements some de- fect fixes. However, a new version does not neces- sarily imply a reduced number of vulnerabilities since the new codes can inject new vulnerabilities.
3. CVSS METRICS
The Common Vulnerability Scoring System
(CVSS) [16] has been adopted by many IT vendors to measure security vulnerabilities since its first launch in 2004. The CVSS scores for known vul- nerabilities are readily available on the majority of public vulnerability databases on the Web, such as NVD (http://nvd.nist.gov). The CVSS score sys- tem provides vendor independent framework for communicating the characteristics and impacts of the known vulnerabilities. Security analysts do not need to think about qualitative evaluation of vul- nerability severity when they estimate it because CVSS designed to be quantitative method in the final scores in each vulnerability.
The scoring system is now on its second version which is finalized its design in June 2007, and cur- rently its third version is ready to be released (http://www.first.org/cvss). The CVSS is com- posed of three metric groups: base, temporal and environmental. It attempts to evaluate the degree of risks posed by vulnerabilities, so mitigation ef- forts can be prioritized. The score ranges [0.0, 10.0]; scores close to 0.0 indicates more stable whereas scores close to 10.0 means more vulner- able to exploitation and causes more serious outcome.
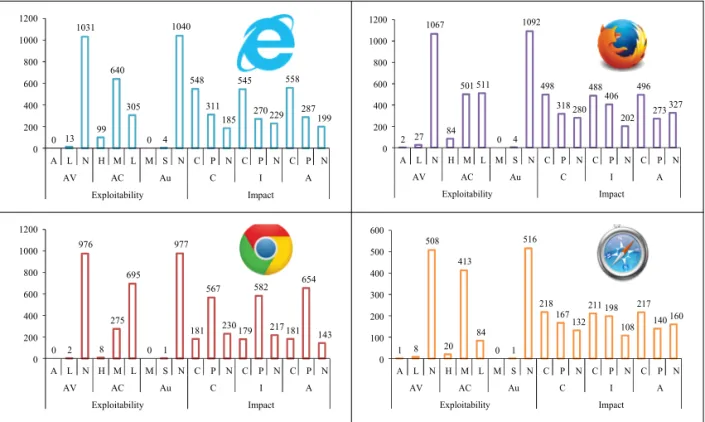
The base metric group, ranges of [0.0, 10.0], rep- resents the intrinsic and fundamental character- istics of a vulnerability, so the score is not changed over time. The base metric has two sub-scores of exploitability and impact sub-scores. The two sub-scores are also ranges of [0.0, 10.0]. The ex- ploitability sub-score captures how a vulnerability is accessed and whether or not extra conditions are required to exploit it while the impact sub-score measures how a vulnerability will directly affect an IT asset as the degree of losses in con- fidentiality, integrity, and availability.
The exploitability sub-score is composed by
three elements of access vector (AV), access com-
plexity (AC), and authentication (Au). The access
vector reflects how the vulnerability is exploited
in terms of local (L), adjacent network (A), or net-
Fig. 1. Relationship between software age and vulner- abilities represented by AML.
work (N). The access complexity measures the complexity of the attack required to exploit the vulnerability once an attacker has gained access to the target system in terms of High (H), Medium (M), or Low (L). The authentication counts the number of times an attacker must authenticate to a target in order to exploit a vulnerability in terms of Multiple (M), Single (S), or None (N).
On the other hand, the impact sub-score is com- posed by the three key aspects in information se- curity components: confidentiality, integrity and availability. The impact attributes are all assessed in terms of None (N), Partial (P), or Complete (C).
The temporal and environmental metrics are used to augment the base metrics and depend on the target system and changing circumstances. In this paper, these two metrics are not utilized, so they are not explained here.
4. VULNERABILITY DISCOVERY TRENDS IN WEB BROWSERS
Fig. 1 shows the AML model [3] representing the relationship among software age, cumulative number of vulnerabilities and the discovery rate.
The AML assumes that during the initial learning phase, very few vulnerabilities are found. During the next phase, termed the linear phase, a steady stream of vulnerabilities is discovered. In the final saturation phase, the vulnerability discovery rate
declines. The durations implicitly depend on factors such as market share or undetected number of vul- nerabilities remaining. In the figure, the bell-shap- ed dashed line shows the instantaneous discovery rate for the vulnerabilities whereas the S-shaped solid line represents the cumulative number of vulnerabilities. Market share is significant factors impacting the effort expended in exploring poten- tial vulnerabilities. A higher market share provides more incentive to explore and exploit vulner- abilities. The effect of the market share rise and fall is implicit in the AML model [17].
Equation (1) gives us the three-parameter AML model where A, B and C are empirical parameters and Ω(t) represents the total number of vulner- abilities discovered at time t.
) 1
( = +
W
- ABtBCe
t B (1)
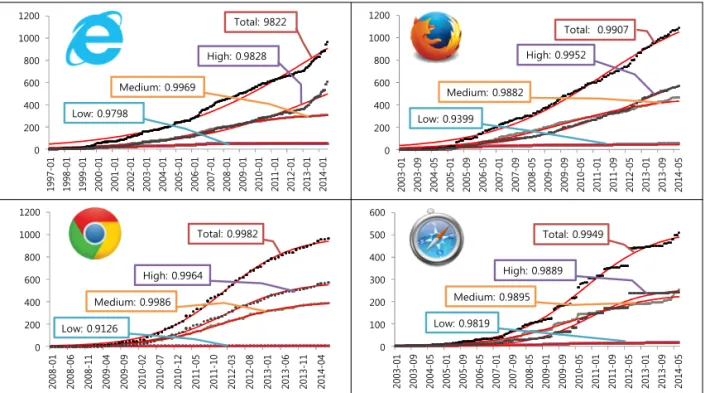
Notice that when time t goes to the infinity, B becomes the eventual number of vulnerabilities discovered in a software system. Fig. 2 shows the AML model fitting on the vulnerability discovery trends for the four Web browsers, and Table 2 dis- plays the model parameters. There are four model fittings in each Web browser, total number of vul- nerabilities, high (CVSS score 7~10), medium (CVSS score 4~6.9), and low (CVSS score 0~3.9) severity vulnerabilities. All the corresponding red solid lines represent the AML fitting results. The numbers in the figure represent Pearson's correla- tion coefficients (R2 values in Table 2). All the numbers are close to 1, which indicates that the model fittings are significant.
Table 3 shows the calculated transition point 1 and 2, which are located between the learning and linear phases, and the linear and saturation phases respectively in Fig. 1. The equation of how to cal- culate the two points is well described in [18].
Except Internet Explorer, the other three browsers
already passed the transition point 2 at this point
of November 2014. This signifies that the three
Web browsers are now in the saturation phase. In
0 200 400 600 800 1000 1200
1997-01 1998-01 1999-01 2000-01 2001-01 2002-01 2003-01 2004-01 2005-01 2006-01 2007-01 2008-01 2009-01 2010-01 2011-01 2012-01 2013-01 2014-01 Medium: 0.9969
Low: 0.9798
Total: 9822
High: 0.9828
0 200 400 600 800 1000 1200
2003-01 2003-09 2004-05 2005-01 2005-09 2006-05 2007-01 2007-09 2008-05 2009-01 2009-09 2010-05 2011-01 2011-09 2012-05 2013-01 2013-09 2014-05 Medium: 0.9882
Low: 0.9399
Total: 0.9907 High: 0.9952
0 200 400 600 800 1000 1200
2008-01 2008-06 2008-11 2009-04 2009-09 2010-02 2010-07 2010-12 2011-05 2011-10 2012-03 2012-08 2013-01 2013-06 2013-11 2014-04 Medium: 0.9986
Low: 0.9126
Total: 0.9982
High: 0.9964
0 100 200 300 400 500 600
2003-01 2003-09 2004-05 2005-01 2005-09 2006-05 2007-01 2007-09 2008-05 2009-01 2009-09 2010-05 2011-01 2011-09 2012-05 2013-01 2013-09 2014-05 Medium: 0.9895
Low: 0.9819
Total: 0.9949
High: 0.9889
Fig. 2. AML model fitting according to CVSS Severity levels.
Table 2. AML model fitting parameters on Fig. 2 and R2 values
Browser Severity A B C R2
IE
Total 1.09E-05 1638.400 0.021 0.982
High 2.19E-05 940.368 0.073 0.982
Medium 1.06E-04 317.543 0.167 0.996
Low 6.87E-04 51.908 0.274 0.979
FX
Total 2.70E-05 1323.499 0.028 0.990
High 4.34E-05 834.715 0.085 0.995
Medium 9.03E-05 472.705 0.074 0.988
Low 2.14E-03 42.909 0.865 0.939
CR
Total 1.05E-04 985.489 0.171 0.998
High 1.82E-04 577.468 0.337 0.996
Medium 2.53E-04 401.190 0.360 0.998
Low 4.79E-04 56.907 1.144 0.912
SF
Total 1.08E-04 526.181 0.372 0.994
High 2.77E-04 259.162 3.713 0.988
Medium 2.14E-04 240.112 0.405 0.989
Low 4.01E-03 15.766 6.293 0.981
Table 3. Transition Points defined by AML model
IE FX CR SF
Transition Point 1 May. 2007 Apr. 2008 Jan. 2011 Oct. 2008
Transition Point 2 Sep. 2019 Jun. 2014 Feb. 2013 Aug. 2012
Status in Nov.2014 Linear Saturation Saturation Saturation
other words, Firefox, Chrome and Safari are in sta- ble state, at least in terms of vulnerability discov-
ery rate point of view. However, the AML model's
assumption is that a significant chunk of codes are
0 13 1031
99 640
305
0 4
1040
548
311 185
545
270229
558
287 199
0 200 400 600 800 1000 1200
A L N H M L M S N C P N C P N C P N
AV AC Au C I A
Exploitability Impact
2 27
1067
84 501 511
0 4
1092
498 318 280
488 406
202 496
273327
0 200 400 600 800 1000 1200
A L N H M L M S N C P N C P N C P N
AV AC Au C I A
Exploitability Impact
0 2
976
8 275
695
0 1
977
181 567
230179
582
217 181 654
143
0 200 400 600 800 1000 1200
A L N H M L M S N C P N C P N C P N
AV AC Au C I A
Exploitability Impact
1 8
508
20 413
84
0 1
516
218
167132
211 198 108
217 140 160
0 100 200 300 400 500 600
A L N H M L M S N C P N C P N C P N
AV AC Au C I A
Exploitability Impact