A Visualization Framework of Information Flows on a Very Large Social Network
김 신 규* 염 헌 영**
Shin-gyu Kim Heon Y. Yeom 요 약
최근 정보의 시각화를 연구하는 쪽에서는 그래프의 시각화에 많은 관심을 갖고 있는데, 그 중 사회망 (social network)의 시각화에 특히 집중하고 있다. 하지만 아직까지 사회망 내에서의 정보의 흐름을 시각화하는 방법에 대해서는 깊이 있는 연구 가 진행되지 않고 있었다. 정보의 흐름은 사회망의 구조와 밀접하게 연관되어 있고, 또한 실제적인 상호관계의 동적인 구성 을 보여주기 때문에 사회망의 구조적 특징보다 더 유용한 정보를 담고 있다. 따라서 정보의 흐름을 시각화하는 것은 매우 중요하다. 본 논문에서는 초대형 사회망을 마치 온라인 지도서비스를 이용하듯이 탐색하고, 사회망 내에서의 정보의 흐름을 관찰할 수 있는 방법에 관하여 제안한다. 이를 위하여 (i) 초대형 사회망을 2차원 그래프에 맵핑하는 방법과, (ii) 줌-인, 줌-아웃 기능 등을 활용하여 그래프를 탐색하는 방법, 그리고 (iii) 효율적인 질의 처리 프레임웍을 구축하는 방법을 고안하였다. 이 방법들을 이용하여 초대형 사회망을 제한적인 공간과 한정된 자원을 이용하여 효과적으로 표현할 수 있고, 이에 기반을 두어 사회망에서의 정보의 흐름을 시각화할 수 있게 된다.
Abstract
Recently, the information visualization research community has given significant attention to graph visualization, especially visualization of social networks. However, visualization of information flows in a very large social network has not been studied in depth. However, information flows are tightly related to the structure of social networks and it shows dynamic behavior of interactions between members of social networks. Thus, we can get much useful information about social networks from information flows. In this paper, we present our research result that enables users to navigate a very large social network in Google Maps’ method and to take a look at information flows on the network. To this end, we devise three techniques; (i) mapping a very large social network to a 2-dimensional graph layout, (ii) exploring the graph to all directions with zooming it in/out, and (iii) building an efficient query processing framework. With these methods, we can visualize very large social networks and information flows in a limited display area with a limited computing resources.
☞ keyword : 사회망, 시각화, Social Network, Visualization
1. Introduction1)
Recently, many research efforts [15, 19, 30, 31]
have suggested diverse methods to visualize graphs,
* 정 회 원 : 서울대학교 컴퓨터공학부 박사과정 [email protected](교신저자)
** 정 회 원 : 서울대학교 컴퓨터공학부 교수 [email protected]
[2008/10/31 투고 - 2008/11/10 심사 - 2008/12/05 심사완료]
☆ A preliminary version of this paper was published in the proceeding of the ACM Symposium on Applied Computing 2009.
especially in the area of studying social networks.
Most relevant research results focus on displaying better patterns of graphs that have been discovered recently. However, we think that displaying information flows over weblike human relationships is more important and valuable than displaying patterns or motifs of the graph in the context of online social network services such as MySpace and Facebook. [3, 9] For example, such services provide networking platforms that propagate messages virally, and after users broadcast their ads they may
want to track continuously how widely their ads spread out. In fact, car enthusiasts or dealer social network service providers enables users to broadcast or post messages about selling or buying their cars, and it will be an attractive feature to give users an interactive visualization tool that tracks their messages.2) [1, 2]
Laying out social networks is a key component to displaying information flows on a computer screen.
However, it is a hard problem since there is no universally accepted way to visualize social networks, unlike maps that use well-defined longitudes and latitudes. In cases of large networks, it is also difficult to display networks (e.g., one million nodes) on a computer screen, even if we want to depict one node as one pixel. Hence, we suggest three design principles of social network visualization. Visualization systems should (i) display social networks while preserving the small world property, (ii) provide access to social networks in an user-friendly way, and (iii) provide quick responses to users’requests. [29]
In this paper, we present a new method that visualizes social networks and information flows or propagation over social networks in compliance with the design principles. To this end, we introduce three techniques (i) to map a social network onto a 2-dimensional graph layout, (ii) to navigate the mapped graph as exploring a map, and (iii) to build an efficient query processing framework based on the multicolumn indexing technique. By using these techniques, users can navigate a social network with various zoom levels in Google Maps’ method which users have been relying on3), and users can also see
2) Advertising costs can be imposed based on the amount of spread of the message.
3) Browsing maps at multiple levels of resolution with navigation by clicking and dragging the mouse is a very attractive feature in map exploration.
information flows.
To map a social network onto a 2-dimensional graph layout, we use an existing clustering method and simple heuristics, and by this method the resulting layout preserves the small world property. Previous work uses clustering techniques to identify hierarchical structures or aggregate structures of networks, while our work uses clustering techniques to lay out networks on the 2-dimensional space. [15, 30] These techniques provide users with functionalities to navigate a social network in all directions. Moreover, users can zoom the network by using the pre-calculated importance of each node. These functionalities are similar to the navigation methods provided by Google Maps or MapQuest. [4, 8]
The main contributions of this paper follow:
•We propose a new method to navigate a large-scale social network by user-friendly ways and to see the status of the social network and information flows.
•We develop a prototype implementation that interacts with users efficiently by using well-known methods or software libraries.
•We then show that our system provides user-friendly and fast interaction by giving demonstrations of good examples of information flows over social networks.
The rest of paper is organized as follows: We review related work in Section 2. In Section 3, we explain a detailed architecture of our visualization system. Section 4, we demonstrate visualization examples of information flows over social networks.
In Section 5, we present future work and conclude this paper.
2. Related Work
In recent years, there have been numerous research efforts to visualize social networks. Such approaches have been effectively used in the analysis of domains such as e-mail communication, online social networks, and coauthorship networks in scientific publications. [12, 17, 19, 25, 26, 31] These efforts can be divided mainly into two methods. The first one is by drawing graphs made up of nodes and connecting edges. In this approach, spatial position, color, size, and shape can all be used to encode information. [18] The second way is to use a matrix where rows and columns stand for people, and the numbers in each cell stand for the social connections between the people. In [31], another approach was introduced to use neither graph nor matrix. In practice, however, most social network applications have utilized the graph representation, and our system also adopts the graph representation. [6, 10, 13, 19]
Most research work has focused only on the static or cumulative information between nodes. They overlooked the information flow in social networks.
There was pioneering work to visualize information flow in architectural space. In [22], pinwheels were used to visualize the flow. However, it is not sufficient to visualize large-scale social networks.
We present a new design and technique to visualize not only static information but also information flow in large social networks.
(Figure 4) Our system is composed of the
presentation tier, the application server tier and the data server tier. The Layout manager in the data server tier computes ranks of all nodes and groups them in several clusters. Users explore the managed network via the graph viewer which read information from the application server tier.
3. Architecture
This section presents the detailed architecture of our system. Figure 1 shows the three-tier architecture of our system. The presentation tier is to visualize the various types of information flows in social networks, and it communicates with the application server tier by using GraphML over HTTP. [5] The application server tier has two services: i.e., an area query service and a shortest path service. The area query service provides the presentation tier with the subgraph of a given social network graph according to a specified area and a zoom level. The shortest path service computes a shortest path between two nodes.4) The data server tier consists of two components: a graph DB and a layout manager. The graph DB stores an entire social network graph; in the meantime the layout manager groups given nodes into disjoint sets of clusters and updates the pagerank of each node periodically. A detailed explanation of each component follows in the next subsections.
(Figure 5) Layout managing process 4) A node represents a person in a social network graph.
3.1 Layout Manager
The main role of the layout manager is mapping a social network graph onto a two-dimensional graph layout. From a graph-drawing perspective, it does not make sense to employ dynamic and interactive algorithms such as force-directed algorithms to compute a layout of a huge graph because the computing resource requirements of these algorithms grows steeply as the size of a graph increases. We rather choose the static layout scheme that utilizes clustering and ranking techniques. Figure 2 shows the overall process in the layout manager. In phase I, the layout manager prepares input graph data for the next procedures. In phase II, the layout manager creates a set of clusters from the graph and computes the pagerank of all nodes. The clustering and the ranking modules can run in parallel, and this improves overall efficiency. In phase III, the outputs of two modules are fed into the mapping module that relocates nodes in a structured way, which will be explained in detail.
3.1.1 Clustering
Clustering has an important role in the visualization of information flows. Researchers observed that information flows between nodes were vividly spreading within the boundary of their own cluster, and the inter-cluster information flow attracts our attention. [32] Without clustering, we can hardly analyze these two phenomena. In the clustering process, it is difficult to figure out how many clusters are there. From extensive simulations, we found that when the number of clusters is around the square root of the number of nodes, the resulting set of clusters shows quite good quality for analysis.
We chose Metis for our clustering module. [11] It takes less than one minute to perform clustering with
1M nodes and 26M edges. Metis is one of the fastest algorithms for clustering large graph data, but it is not appropriate for interactive and real-time jobs.
This is why we chose the static layout scheme.5)
3.1.2 Ranking
Ranking is also important in our system. It enables us to select top-k nodes to draw in a specified area. The dimension of the area is determined by a screen size and a zoom level. Using the rank of a node, we can select important nodes from the entire graph when drawing a subgraph satisfying system’s constraints. In addition to this, ranking is used in determining the position levels of nodes, and the mechanism will be explained in the next section.
The layout manager adopts the well-known PageRank algorithm for ranking. Due to the iterative feature of pagerank computation, it takes several minutes to obtain the well converged pagerank value of 1M nodes. [27] Since the PageRank computation is irrelevant to the abovementioned clustering work, the layout manager can improve its throughput by running these two jobs in parallel.
3.1.3 Mapping
In the last step, the layout manager creates a virtual continent in a structured way. From a distance, the continent looks like a big pie (the phase III in Figure 2). Each cluster occupies a certain sector of the pie, which is proportional to the number of nodes the cluster has, and the nodes are positioned by their pagerank values. Higher-ranked nodes (i.e., hub nodes) are located near the center of the pie, and lower-ranked nodes are placed on the
5) We leave it as future work to find a faster clustering algorithm than Metis.
outskirts. This layout strategy considers ranking and clustering information effectively. This strategy indeed has two advantages. Firstly, we do not need to explore all areas to visit each cluster, when we want to observe the status of each cluster. Secondly, by looking at the center region where most hub nodes are placed, it is easy to keep observing the behaviors of the hub nodes. These benefits come from the fact that the center of the pie is a start point of each cluster and a rendezvous point of hub nodes. However, our layout strategy has one drawback. Because the hub nodes are located close by its ranks, the edge density near the center is extremely high. To alleviate it, we placed the nodes around the center sparsely while maintaining a minimum distance to preserve the advantages mentioned above. The resulting layout of the pipeline (data preparation ⇒ clustering ∥ ranking
⇒ mapping) is then used to drive the visualization.
3.2 Query Processing Framework As explained in the previous section, a social network is mapped onto a two-dimensional graph. A query to retrieve nodes in a specified area is thought to be a two-dimensional spatial query. Because we use a spatial query frequently, the spatial query must guarantee a fast response time for interactive navigation. The other type of query we need to support is a shortest path query. The shortest path between nodes is the one of interesting questions in social networks since we can see the chain of human relationship to reach a certain person. We adopt a bidirectional shortest path algorithm to answer the query in our system.
3.2.1 Area Query
The most frequently used query in our system is
an area query that returns a set of nodes residing inside a specified area. The area query is a sort of range top-k query that retrieves the top-most k records in the ordered set within a specified region of multidimensional data. [21, 24, 28]
Our area query is expressed in SQL as follows:
SELECT * FROM vertex
WHERE x coordinate BETWEEN [x_min] AND [x_max]
AND y coordinate BETWEEN [y_min] AND [y_max]
ORDER BY pagerank DESC LIMIT [k]
The parameters, x min, x max, y min and y max, are determined by the screen size and the zoom level. The nodes in the specified region are ordered by their rank, and the topmost k nodes are selected to be displayed in a screen. This method does not require hierarchy in a graph data. Thus, we can draw effectively a large unstructured graph in a limited area without loss of readability.
When DBMS executes the above SQL statement, it retrieves all nodes that satisfy the area condition, sorts the nodes in the pagerank order, and returns the topmost k nodes. Thus, sorting overhead from the
“ORDER BY” is considerable in displaying a wide area of the map. To solve this problem, we added a multi-column index that is composed of pagerank, x coordinate and y coordinate. Because this index is ordered by pagerank firstly and also has coordinate information, DBMS does not need to sort tuples after matching the area constraint. It boosts up the response time by 10 times as shown in Table 1. The revised query is as follows:
SELECT * FROM vertex WHERE pagerank > 0
AND x coordinate BETWEEN [x_min] AND [x_max]
AND y coordinate BETWEEN [y_min] AND [y_max]
LIMIT [k]
The unpleasant "ORDER BY" clause is removed from the SQL statement, and a dummy clause
"pagerank > 0" is added to force the use of the multi-column index. It might be helpful to add a hint such as "/*+ INDEX DESC(vertex_index vertex) */"
in ORACLE.
(Table 2) Average Query Response Time (the number of nodes : one million)
Without Optimized
Execution
With Optimized Execution Average Response
Time 1.1 (Sec) 0.1 (Sec)
3.2.2 Shortest Path Query
We assume that the social network graph is unweighted. In an unweighted graph, one can find the shortest path simply by breadth-first search.
However, it requires too much time and space to run on a large graph. To reduce the time complexity and the space complexity, we employed a bidirectional search algorithm. [23] The bidirectional search algorithm alternates running between forward and reverse version of the breadth-first search. The algorithm reduces the time and the space complexity from to , where b is the degree of nodes and d is the length of the shortest path. Since the average degree is large (larger than 30) and the average distance diameter is small (less than 4) in online social networks, bidirectional search finds the shortest paths very efficiently, as shown in Table 2.
[14]
(Table 3) Comparison of shortest path algorithms (the number of nodes : one million, average outdegree : 50, and average network diameter : 6)
Traditional BFS Bidirectional BFS Average Execution
Time 6.5 (Sec) 0.09 (Sec)
3.3 Graph Viewer
Users access our system through the graph viewer.
It provides users with navigation, zoom and search functions to explore a social network and observe the information flow. The graph viewer is written in Java using the prefuse visualization toolkit. [20] We wrote an extension for partial graph management.
Due to the limitation of system resources, the graph viewer keeps the total number of nodes under a certain threshold. The user interface of the graph viewer is explained with examples in the next section.
4. Visualization
The goal of our system is to build a visualization system through which end-users of social networking services learn information about their community and watch the information flow in it. We also aim at displaying large-scale social networks. To provide an interactive environment and maintain good readability in this condition, we omit links between nodes. It was not sufficient for saving system resources to use a static layout method. Moreover, we found that dense links hinder users from understanding the overall aspect. For better understanding, we draw only essential links (e.g., links between first-order nodes and shortest paths).
In drawing nodes, we also omit imagery when the
node is not considered to have any interest. It greatly helps in highlighting nodes and links.
We generated a synthetic social network using R-Mat. [16] The social network has 1 million nodes and 26 million links. In addition to this, we also used real data which are from Flickr and Orkut.
Their size are 1.6 million nodes and 3.2 million nodes respectively. [33, 34, 35]
4.1 Basic Interaction
Our system provides user-friendly methods for navigation and basic interaction. Because our system treats a large graph map, our system has a tool not to get lost in the middle of navigation. A mini map (Figure 3(a)) shows the current location of the user’s view in the whole map. Most interactions are performed with simple mouse operations. Clicking a node with a left mouse button causes the node to be the center of the view. Clicking a node with a right mouse button opens a context menu (Figure 3(b)) to provide information related to the node. The list of first-order neighbors (Figure 3(c)) are displayed at the bottom of screen. This feature is also found at the familiar online community service (e.g., MySpace and Facebook). For navigation, our system supports panning and zooming. Panning is performed by dragging the background of the display with the left mouse button down. Zooming is performed by rotating the mouse scroll wheel and selecting the level in the zoom slide bar (Figure 3(d)). To search the social network (Figure 3(e)), we employed Lucene framework in our system. [7] Search results are displayed on the right column, and the nodes in the results are highlighted as green nodes with images in the map.
(Figure 6) Screenshot of the user-interface showing a mini map, a context menu, neighbors,
a zoom-level bar and search results
4.2 Information Flows
Our system represents the information flow with different colors that are chosen by the distance from the source. Figure 4 shows the flow of personal advertisement in social networks. First-order neighbors are colored with yellow, second order with red, and third order with blue. Distribution ratio is shown in the right column. The ratio is also visually recognized in the right map; unreached nodes are distinguished vividly by its stale color. We omit links in this visualization. At first, we tried to represent the information flow by the color of links.
If the flow is considered as a route, this option is better than coloring nodes. However, the option to color links is not helpful for representing the distribution of reached nodes. Next, we also tried to color both nodes and links. In this case, readability is lessened. This result partly came from the large size of social networks.
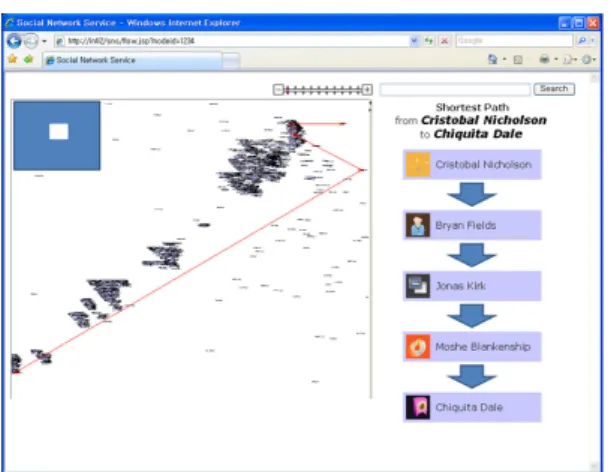
(Figure 7) Screenshot of the user-interface showing the shortest path search result
4.3 Shortest Path
Figure 5 shows the result of shortest path finding.
The path is displayed in the left map, and is highlighted in red. The map is automatically zoomed out to fit the entire path to be seen at a glance.
Intermediate nodes are also listed in the right column. More than one shortest path may exist. We choose one of them randomly for simplicity.
(Figure 8) Screenshot of the user-interface showing personal advertisement
propagation status
5. Conclusion
We described a new method to visualize a large-scale social network and the information flows within it. Our main contribution is the user-friendliness of our method and prototyped system. For user-friendliness, we introduced the 2-dimensional layout technique and the efficient query processing technique. We believe that our method gives many attractive and interesting features to social network service providers. Our ongoing work focuses on improving the layout technique and devising a context-aware navigation framework.
Acknowledgement
This study was supported by the Seoul R&BD Program (10561), Seoul, Korea. The ICT at Seoul National University provides research facilities for this study.
References
[1] Car Dealer Social Network, http://autodealers.ning.com.
[2] CarSpace, http://www.carspace.com/.
[3] Facebook, http://www.facebook.com/.
[4] Google Maps, http://maps.google.com/.
[5] GraphML, http://graphml.graphdrawing.org.
[6] Jung: Java universal network/graph framework.
http://jung.sf.net/.
[7] Lucene, http://lucene.apache.org/.
[8] MapQuest Maps, http://www.mapquest.com/.
[9] MySpace, http://www.myspace.com/.
[10] Ucinet: Social network analysis software.
http://analytictech.com/.
[11] A. Abou-Rjeili and G. Karypis. 'Multilevel algorithms for partitioning power-law graphs',
Proceedings of IPDPS06, 2006.
[12] L. Adamic, O. Buyukkokten, and E. Adar. 'A social network caught in the web', First Monday, 2003.
[13] E. Adar. Guess: The graph exploration system.
http://www.hpl.hp.col/research/idl/projects/graphs.
[14] Y.-Y. Ahn, S. Han, H. Kwak, S. Moon, and H.
Jeong. 'Analysis of topological characteristics of huge online social networking services', Proceedings of the 16th international conference on World Wide Web, pages 835–844, 2007 [15] D. Archambault, T. Munzner, and D. Auber.
'Grouseflocks: Steerable exploration of graph hierarchy space', IEEE Transactions on Visualization and Computer Graphics, 14(4):900–913, 2008.
[16] D. Chakrabarti, Y. Zhan, and C. Faloutsos. 'R-mat:
A recursive model for graph mining'. In SDM, 2004.
[17] D. Fisher and P. Dourish. 'Social and temporal structures in everyday collaboration', Proceedings of the SIGCHI conference on Human factors in computing systems, pages 551–558, 2004 [18] L. C. Freeman. 'Visualizing social networks',
Journal of Social Structure, 2000.
[19] J. Heer and D. Boyd. 'Vizster: Visualizing online social networks', Proceedings of the Proceedings of the 2005 IEEE Symposium on Information Visualization, page 5, 2005
[20] J. Heer, S. K. Card, and J. A. Landay. 'prefuse: a toolkit for interactive information visualization', Proceedings of the SIGCHI conference on Human factors in computing systems, pages 421–430, 2005
[21] S. Hong, B. Moon, and S. Lee. 'Efficient execution of range top-k queries in aggregate r-trees', IEICE -Trans. Inf. Syst., E88-D(11):2544–2554, 2005.
[22] H. Ishii, S. Ren, and P. Frei. 'Pinwheels: visualizing information flow in an architectural space', CHI
’01 extended abstracts on Human factors in
computing systems, pages 111–112, 2001 [23] S. M. LaValle. 'Planning Algorithms', Cambridge
University Press, 2006.
[24] I. Lazaridis and S. Mehrotra. 'Progressive approximate aggregate queries with a multi-resolution tree structure', SIGMOD Rec., 30(2):401–412, 2001.
[25] L. S. Marion, E. Garfield, L. L. Hargens, L. A.
Lievrouw, H. D. White, and C. S. Wilson. 'Social network analysis and citation network analysis:
Complementary approaches to the study of scientific communication', Proceedings of the American Society for Information Science and Technology, pages 486–487, 2005.
[26] M. Newman. 'Co-authorship networks and patterns of scientific collaboration', Proceedings Of The National Academy Of Sciences Of The United States Of America, pages 5200–5205, 2004.
[27] L. Page, S. Brin, R. Motwani, and T. Winograd.
'The pagerank citation ranking: Bringing order to the web', 1999.
[28] D. Papadias, P. Kalnis, J. Zhang, and Y. Tao.
'Efficient olap operations in spatial data warehouses', Proceedings of the 7th International Symposium on Advances in Spatial and Temporal Databases, pages 443–459, 2001
[29] Travers, Jeffrey, and S. Milgram. 'An experimental study of the small world problem', Sociometry, 32(4):425–443, 1969.
[30] F. van Ham and N. Krishnan. 'Ask-graphview: A large scale graph visualization system', IEEE Transactions on Visualization and Computer Graphics, 12(5):669–676, 2006
[31] F. B. Vi´egas and J. Donath. 'Social network visualization: Can we go beyond the graph', Workshop on Social Networks, CSCW, 4:6–10, 2004.
[32] F. Wu, B. A. Huberman, L. A. Adamic, and J. R.
Tyler. 'Information flow in social groups. Physica
◐ 저 자 소 개 ◑
김 신 규
2006년 서울대학교 컴퓨터공학부(공학사)
2008년 서울대학교 대학원 컴퓨터공학부(공학석사) 2008년~현재 서울대학교 대학원 컴퓨터공학부 박사과정 관심분야 : 데이터베이스, 네트웍, 운영체제.
E-mail : [email protected]
염 헌 영
1984년 서울대학교 전산과학과(이학사)
1986년 Texas A&M University 대학원 전산과학과(이학석사) 1992년 Texas A&M University 대학원 전산과학과(이학박사) 1993년~현재 서울대학교 컴퓨터공학부 교수
관심분야 : 데이터베이스, 분산시스템, 멀티미디어 시스템, 트랜잭션 처리 etc.
E-mail : [email protected] A Statistical Mechanics and its Applications', 337:327–335, June 2004.
[33] IMC 2007 Data Sets, http://socialnetworks.mpi- sws.org/data-imc2007.html.
[34] Flickr, http://www.flickr.com [35] Orkut, http://www.orkut.com