http://dx.doi.org/10.11625/KJOA.2015.23.4.923 ISSN 2287-819X (Online)
Emission Patterns of Carbon Dioxide & Methane by Liquid Pig Manure Treatments in Paddy Soil *
1)
Oh, Seung-Ka
**․Yoon, Dong-Kyung
**․Lee, Eun-Jung
**․Lee, Byung-Jin
***․ Jeon, Seung-Ho
***․Cho, Young-Son
****논토양에서 돈분액비 시용에 따른 CH4 및 CO2 발생양상
오승가․윤동경․이은정․이병진․전승호․조영손
This study was conducted to serve as the basis for establishing a standard cultivation, which enhances the alternative utilization of pig manure, a major cause of environmental pollution, by finding a means for reducing greenhouse gas emissions for eco-friendly cultivation. In a laboratory, CH
4and CO
2emission patterns were investigated corresponding to incremental pig manure treatments in paddy soil. The emissions peaked 12 to 27 days after manure application in the 100~400% applications. It was found that increasing applications of pig manure resulted an increase in CH
4and CO
2emissions. Additionally, application of more than 150% emitted a larger amount of these gasses than applying chemical fertilizer. However, the test application of 100% pig manure emitted a smaller amount of CH
4and hence Global Warming Potential (GWP) than those emitted by chemical fertilizer. If appropriate amount of fertilization is applied in compliance with the standard application rate, the pig manure may be effective in reducing greenhouse gas emissions and the soil environment made more favorable than with the use of chemical fertilizer.
Key words : carbon dioxide, greenhouse gas, liquid pig manure, paddy soil, methane
*
이 논문은 2015년도 경남과학기술대학교 기성회 연구비 지원에 의하여 연구되었음.
**
경남과학기술대학교 식물자원학과
***
경남과학기술대학교 종자실용화연구소
****
Corresponding authors, 경남과학기술대학교 농학한약자원학부([email protected])
Ⅰ. Introduction
For the last 100 years (1906~2005), the earth surface temperature rise which is the indicator for the global warming, 0.74±0.18 ℃ caused by greenhouse effect, and average sea level of 1961~1993 has been rising 1.8 mm yearly (IPCC, 2007). According to Intergovernmental Panel on Climate Change (IPCC) evaluation report, if global warming continues as it is now, the average temperature rise of the earth will be maximum 6.4 ℃ and sea level rise 59 cm and in the case of A1B scenario, it predicts that the average temperature will rise 2.8 ℃, sea level will rise 21~48 cm at the end of this century (2090~2099), and according to the special report on IPCC emission scenario, greenhouse gas in the world will increase 25~90% in the period of 2000 to 2030 (SRES, 2000). Among greenhouse gases, CO
2, CH
4, N
2O, HFCs, PFCs and SF
6are designated as the six major greenhouse gases causing global warming. Among them, CH
4and N
2O emissions are found in the agriculture sector (GIR, 2014).
South Korea’s staple food, rice, is cultivated under water-logged conditions. When conditions reach the anaerobic state, M
I2SO
4reduction and CH
4emissions operate as the major mechanism for the carbon cycle. Water logging is low in M
I2SO
4concentration; as a result, CH
4formation appears as the major organic matter decomposition mechanism, therefore there is much emission of CH
4in paddy fields (Ward et al., 1985). Total greenhouse gas emissions of Korean agricul- tural sector (animal husbandry, agronomy) in 2011 were 22.0 million tons CO
2eq., and this is 3.2% of the total emission of Korea. Greenhouse gas emission caused by crop cultivation was 12.6 million tons CO
2eq. Among greenhouse gases, the emission of CH
4was 12.4 million tons CO
2eq. which is 55.5%, of the total emission of Korea and the emission of CH
4on rice cultivation sector was 6.81 million t CO
2eq. This means the emission caused by agriculture is 54.9% among CH
4emission, which is a high rate (GIR. 2014). CH
4exists in trace quantities in the atmosphere, but it has been a problem as a greenhouse gas (Bowman, 1990), because CH
4, in comparison with CO
2, is 30 times more in relative potential for thermal absorption per unit mass, and 21 times in Global Warming Potential (GWP). There are many reduction methods of CH
4emission, such as various cultivation methods or intermittent irrigation for water treatment methods to reduce emission in paddy field, application of composting organics like compost, fall plowing and so on (National Yeongnam Agricultural Experiment Station, 1992; Lee et al., 1997;
Shin et al., 1996).
In 2009, the Climate Change Conference in Copenhagen, Denmark, proposed to reduce 30%
of greenhouse gases forecasted for 2020. Correspond with this, the agricultural sector needs to
put effort into reducing greenhouse gases. Presently, organic waste of Korea is increasing yearly
and this is be disposed of in landfills, or by incineration sea disposal, resource recovery and so on (NIAST, 2003). In 2014, sea disposal was banned, so now, organic waste which formerly was disposed of at sea is required to be disposed of on land.
Livestock excretions created in Korea contain nitrogen, phosphoric acid and a kali component which is exceeding the fertilizer consumption for the crops cultivated in Korea and therefore there is potential to be an alternative to chemical fertilizer (RDA, 2002). When manure is sprayed properly on soil, it is expected that this will lead to an increase soil aggregation, in CEC and buffer capacity, and chelate function (Gilmour et al., 1998), and an increase in biota vitality (Kanazawa and Yoneyama, 1980) which leads to improvements in soil physicochemical properties and supply to crops varied nutrition, carbon dioxide and growth-promoting substances (Beranl and Kirchman, 1992; Park et al., 2001). Among livestock excretions, swine manure is compared to cattle manure, nitrogen content is 3 times in urine, 3.3 times in feces, phosphoric acid is 23 times in urine, 3.4times in feces (Kim et al., 2001), it is reported that application of liquid pig manure in planting production can replace chemical fertilizer partly or completely (Jensen et al., 2000).
However, the research on the emission of greenhouse gases with application of liquid pig manure on cultivation for eco-friendly agriculture that may replace chemical fertilizer partly or all has not been done. Therefore this research serves livestock and agronomic related natural circulation organic method to reduce environmental pollution that caused by conventional farming of increase production, to make balance and to build sustainable agriculture system, the laboratory test of treatment of liquid pig manure in paddy field and the emission of CH
4is expected to be the base line date for the establishment of standard cultural practices in reduction of CH
4emission in cultivation for eco-friendly agriculture in clean water conditions.
Ⅱ. Materials and method
1. Testing materials
This research is to clarify emission patterns of carbon dioxide & methane by liquid pig
manure treatments in paddy soil, and processed with LPM produced in Livestock Excretions
Public Resource Center in Miryang, Gyeong-nam and collected paddy field sample of silty clay
loam in Miryang, Gyeong-nam (N 35° 39', E 128° 66'). LPM contains nitrogen 0.26%, chemical
characteristics are identical with Table 2, and chemical characteristics of paddy field before the
test is identical with Table 1.
Table 1. Chemical properties of soil used
pH EC T-N O.M. Avail. P
2O
5Exch. cation
K Ca Mg Na
(1:5) dS m
-1% g kg
-1mg kg
-1………… cmolc kg
-1…………
Paddy soil 5.5 0.70 0.34 17.2 79.7 0.31 7.64 2.51 0.40
Table 2. Chemical properties of liquid pig manure used
T-N pH EC O.M. Avail. P
2O
5Exch. cation
K Ca Mg Na
% (1:5) dS m
-1g kg
-1mg kg
-1………… cmolc kg
-1…………
LPM 0.26 8.6 18.1 3.63 10.8 587 14.6 0.70 69.3
2. Method
1) Environment condition
For air sampling, 1/5000 a size of enclosed equipment plot was used for capture greenhouse gases from paddy field with clean water, and to capture gases, diameter 0.2 cm hole was made in the lid and connect silicone tube and enclosed. At the end of the tube, 3 way stopcock was attached for 50 ml sampling syringe. LPM treatment was 0, 50, 100, 150, 200, 400% level, conversion of 9 kg 10a
-1plot zone which is nitrogen standard rate of fertilizer for rice cultiva- tion, and control was conventional fertilization, N-P-K 9-4-4.5 kg 10a
-1was treated in conversion with plot area. Soil was dried under the shade and passed through 2 mm sieve, and 450 g of soil was put into plot and added 400 ml of distilled water. Then regulated the soil till it was moisturized enough, and checked the water level. Distilled water was added during test to prevent dryness. In growth chamber (GC-1000TLH, JEIO TECH), temperature was maintained 30 ℃ (Yang and Chang, 1998; Ko et al., 1998), and relative humidity 70~80% for 45 days, and tested CH
4and CO
23 repetition of 3~5 days interval.
2) Capturing greenhouse gases and measurement
To capture CH
4, circulated air in the plot with fan (12V 0.14A, XW 8025MS, DC
BRUSHLESS FAN) then enclosed and maintained 30 ℃, relative temperature 70~80% for 30 minutes. 3 way stopcock is connected with plot and 50 ml sampling syringe to ease the connection between syringe and plot while sampling. To equalize captured air in the plot, gave pumping for 4 times and collected 40 ml. Measurement method of CO
2was RAE, BGM-1900 multi gas detector, and the method of capturing CO
2was same as capturing CH
4.
3) LPM, Soil and greenhouse gases analysis
The analysis to invest LPM and chemical characteristics of soil was in accordance with Regulation of Soils and Plants Analysis (NIAST, 2000) of Rural Development Administration in Korea, analyzed with CH
4Gas chromatography (GC) Agilent 6890N, Network (FID, PFPD) and change into flux below, and conversed into GWP, the numerical value of CO
2as a contributor towards the greenhouse effect, with criteria of CO
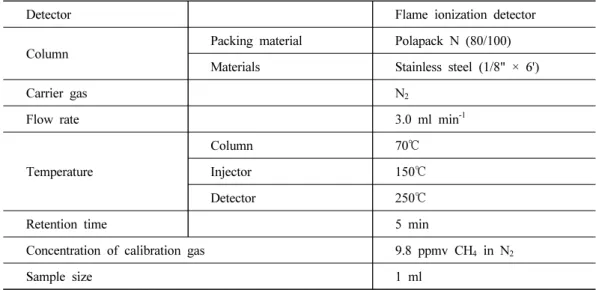
2effect on global warming. Condition of analysis is identical with Table 3.
Table 3. gas chromatography condition for methane analysis
Flux : ℯ×V/A×∆c/∆t×273/(273+T) ℯ Methane density
V Ground bulk, ㎡ A Chamber bulk, ㎥
∆c Density shift before and after airtight, ppmv
∆t Time of airtight, hr.
T Average temperature inside chamber, ℃
Detector Flame ionization detector
Column
Packing material Polapack N (80/100) Materials Stainless steel (1/8" × 6')
Carrier gas N
2Flow rate 3.0 ml min
-1Temperature
Column 70 ℃
Injector 150 ℃
Detector 250 ℃
Retention time 5 min
Concentration of calibration gas 9.8 ppmv CH
4in N
2Sample size 1 ml
Ⅲ. Result and Consideration
1. The Aspect of Generation of Greenhouse gases followed by the treatment of LPM
1) CH
4generation pattern
To research CH
4generation pattern after LPM (Liquid Pig Manure) treatment, lab scale experiment was fulfilled and the paddy soil was used and purified water was supplied. The standard amount of fertilizer for rice cultivation 9 kg (10a
-1) of N are recommended. Thus were fertilized that amount of LPM as a Nitrogen fertilizer which was used as 100% and 5 other levels were added (N level : 0, 50, 100, 150, 200, and 400% with starting N, in controlled temperature at 30 ℃ for 45-day and observed in 3 to 5days interval. The result was showed in Fig. 1. In the results, Control and treatment of 100, 150, 200, and 400%, it is generated the most from 15 to 24 days, and in treatment 150, 200, 400% generated 5,806, 6,782, 7,069 mg m
-2hr
-1in day 24, day 21 and day 15 the most which shows that the peak of CH
4generation became faster when the amount of LPM treatment increased (Fig. 1).
DAT(Days After Treatment)
3 6 9 12 15 18 21 24 27 30 33 36 39 42 45 CH4 flux (㎎ m-2 hr-1 )
0 1000 2000 3000 4000 5000 6000 7000
8000 Con.
0%
50%100%
150%200%
400%
Fig. 1. The Change of Methane fluxes depending on liquid pig manure treatments in paddy soil.
According to Yang and Chang (1998), when rice straw is ground in 30 ℃ and treated 0~20%,
and cultured, the result shows that there is an increase of generation of CH
4when there is an
increase of the amount of treatment. In the same study it was reported that in 20% treatment, the peak was between 10 to 15 days. There was no difference in peak time when of rice straw in increased, but the time of peak cuts earlier with the increase of culture temperature. Therefore it is considered that there is a need of additional research in the future on the generation of CH
4with the amount of LPM treatment and culture temperature.
In total generation amount of CH
4comparison (Table 4), the generation amount in control (conventional treatment plot) was 31.6 g m
-2hr
-1, 47% more in the amount of generation compared to 100% treatment, there was more amount of generation above 150% treatment than control, and the most amount of 400% treatment generated 191% more than control. 0%
treatment was 1.83 g m
-2hr
-1, which was the least generation of all LPM treatments, and shows the difference of 58.5 g m
-1compared to the most generation of 400% treatment. It shows that there is an increase of CH
4generation when there is an increase of LPM treatment (Table 4).
According to Yang and Chang (1998), the amount of treatment of the elements, there was no significance between 0 and 200 mg N (kg Soil)
-1, and it is reported that there is decrease of the amount of generation of CH
4when it is increased above 300 mg N (kg Soil)
-1, and CH
4generation increased in accordance with the amount of rice straw treatment. According to Lim and others (2010).
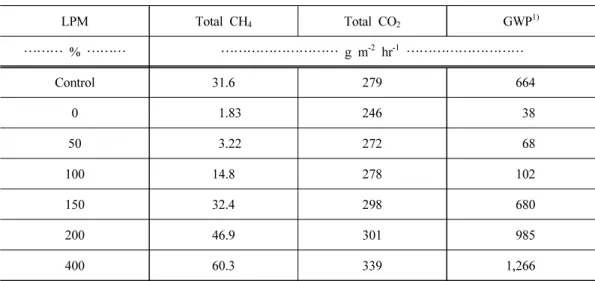
Table 4. Total emission of Methane, carbon dioxide and GWP (Global Warming Potential) by liquid pig manure treatments
LPM Total CH
4Total CO
2GWP
1)……… % ……… ……… g m
-2hr
-1………
Control 31.6 279 664
0 1.83 246 38
50 3.22 272 68
100 14.8 278 102
150 32.4 298 680
200 46.9 301 985
400 60.3 339 1,266
1)GWP(Global Warming Potential): Carbon dioxide is a greenhouse gas, based on the individual effects of the global warming is a numerical representation of the degree to contribute to global warming, when viewing the carbon dioxide (CO2) to 1 methane (CH4) is 21.
The result of the CH
4emission test with the soil from reclaimed land containing different salt concentrations after incubation of 37 ℃ for 48 hours shows that the difference in CH
4emission is highly similar to the contained organic matter in soil. Also, according to Schṻtz (1989) and Denir van der Gon and Neue (1995), CH
4emission increased for more than 2 times higher by application of rice straws. In summary, in this test, the CH
4emission has increased with the increase of LPM treatment, therefore it is considered that LPM (O.M. 3.63 g kg
-1) has a huge effect on CH
4emission. Trumbore (1995) reported that with stable isotope analysis, the input of organic matter annually is easily decomposed and expires into CO
2or CH
4, according to the condition of its soil. Therefore it is considered that there will be a need of further study.
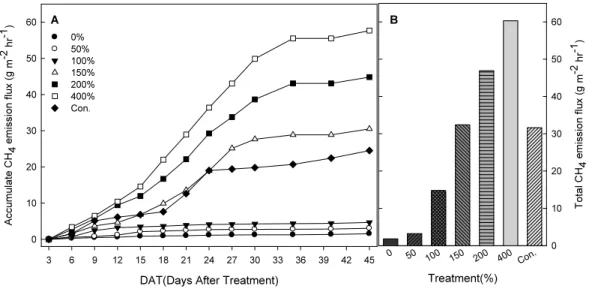
The accumulative incidence rate of CH
4in comparison group is appeared as more than 17, 6 times than LPM 0, 100% treatment and the amount was 29.8, 16.8 g m
-2hr
-1each. Yagi and Minami (1991) reported that they observed no effect of fertilizer on CH
4emission, but in this test, the amount of emission was more than all of the comparison group with above 150%
treatment (Fig. 2).
Treatment(%) 0 50 100 150 200 400 Con.
Total CH4 emission flux (g m-2 hr-1) 0 10 20 30 40 50 B 60
DAT(Days After Treatment)
3 6 9 12 15 18 21 24 27 30 33 36 39 42 45 Accumulate CH4 emission flux (g m-2 hr-1)
0 10 20 30 40 50 60
0%
50%
100%150%
200%
400%
Con.
A
Fig. 2. Changes of accumulate methane flux and total methane flux as affected by liquid pig manure treatments in paddy soil.
The amount of CH
4emission was put into numeric value of GWP with the effect of carbon
dioxide on global warming and standardized value of each greenhouse gas contribution to global
warming is in the order of 400% > 200% > 150% > comparison group > 100% > 50% > 0%,
and GWP value appeared to be higher with the increase of LPM treatment. Comparison group
664 mg m
-2hr
-1contrast 0, 100% treatment generated 626, 562 mg m
-2hr
-1difference each, that the emission was lesser, in 400% treatment showed 603 mg m
-2hr
-1difference and it was the most generated amount among LPM treatment. In 150~400% treatment generated more emission than comparison group (Table 4). According to Kim and others (2012), there has been reported that CH
4emission in rice paddy is different with the amount and kinds of application of green manure. According to Lindau and others (1994) too, reported similar tendency with this test that in rice paddy there was more CH
4emission with the increase of nitrogenous fertilizer.
As a result of the investigation of the relation between LPM treatment and the amount of CH
4emission (Fig. 3) as the throughout of LPM increase, so the amount of CH
4emission and there appears direct proportion, and it appeared the most in 400% treatment. The interaction formula is as bellow.
Y = 1.28X
2- 3.62X - 5.55 (r
2= 0.99)
The Percentage of Inputted Liquid Pig Manure(%)
0 50 100 150 200 400
CH4 total emission flux(g m-2 hr-1 ) 0 10 20 30 40 50 60 70
Y = 1.28X2 -3.62X -5.55 R2 = 0.992**
Fig. 3. Correlation analysis result of methane flux as affected by liquid pig manure treatments in paddy soil.
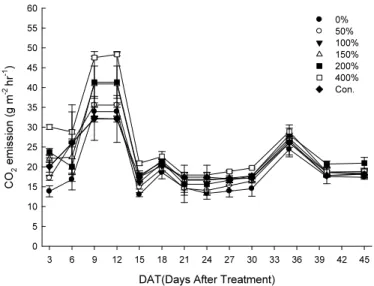
2) CO
2emission pattern
As a result from test of the pattern of CO
2emission according to LPM treatment (Fig. 4)
tendency to show maximum peak was regular in all treatments, unlike CH
4emission pattern,
maximum peak was between day 9 to day 12.
DAT(Days After Treatment)
3 6 9 12 15 18 21 24 27 30 33 36 39 42 45 CO2 emission (g m-2 hr-1)
0 5 10 15 20 25 30 35 40 45 50 55
60 0%
50%
100%150%
200%400%
Con.
Fig. 4. The Change of carbon dioxide emission as affected by liquid pig manure treatments in paddy soil.
Total emission of CO
2is identical with Table 4. It shows similar pattern of emission by 100%
treatment with comparison group, and in 100~200% the amount of emission is not approved as significant but it is observed that there is a similar tendency of the amount of LPM treatment and CO
2emission. When the amount of LPM treatment increased, the amount of CO
2emission also increased. Therefore it is appeared that there is a similar tendency with total amount of CH
4emission.
DAT (Days After Treatment)
0 3 6 9 12 15 18 21 24 27 30 33 36 39 42 45 Accumulate CO2 Emission (g m-2 hr-1 )
0 50 100 150 200 250 300 350
0%50%
100%
150%
200%400%
Con.
Treatment(%) 0 50 100 150 200 400 Con.
Total CO2 emission (g m-2 hr-1)
0 200 220 240 260 280 300 320 340
A B 360
Fig. 5. Changes of accumulate carbon dioxide emission and total carbon dioxide emission
as affected by liquid pig manure treatments in paddy soil.
The accumulative incidence rate of CO
2was the most generated in LPM 400% treatment zone, it was even more with comparison group in 150% treatment zone, 1,247 mg m
-2hr
-1. Therefore it appeared as different pattern with the amount of emission of CH
4(Fig. 5).
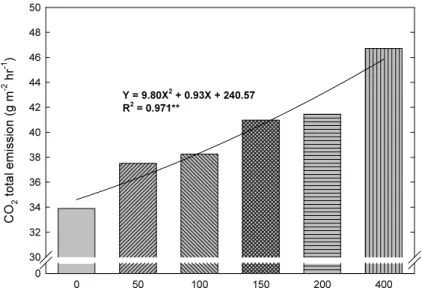
Fig. 6 is to show the relation of the amount of LPM treatment with the amount of CO2 emission. It is appeared that as the amount of LPM treatment increase, so the amount of CO2 emission, and there was no distinction between 150% treatment and 200% treatment which means there is different tendency from the amount of CH4 emission pattern. The most amount of emission was in 400% treatment. The interaction formula of the two above is as the follow.
Y = 9.80X
2+ 0.93X + 240.57 (r
2= 0.97)
Col 2
The Percentage of Inputted Liquid Pig Manure(%)
0 50 100 150 200 400
CO2 total emission (g m-2 hr-1 )
0 30 32 34 36 38 40 42 44 46 48 50
Y = 9.80X2 + 0.93X + 240.57 R2 = 0.971**
Fig. 6. Correlation analysis result of the emissions of carbon dioxide as affected by liquid pig manure treatments in paddy soil.
2. Change of chemical composition in soil
The result to investigate chemical change of soil with LPM treatment in paddy field (silty
clay loam) is as follows (Table 5). In O.M. change, there was no distinction in treatment area,
and this result is identical with the reports on the content of O.M. in soil with the time and the
increase of amount of application of livestock excretions applications, reported by Anzai (1987)
and Usio (2000) and others, whereas it appeared as opposite result with the reports on the
increase of organic matter content with the increase amount of swine manure application rate reported by Yang (2008) and others and Kim (2004) and others. It is considered that the result is derived from the difference between field test and cell treatment test, and it is considered to be needed more minute study about this matter.
Table 5. Chemical properties of soil after a test as affected by liquid pig manure treat- ment in paddy soil
LPM pH EC T-N O.M. Avail. P
2O
5Exch. cation
K Ca Mg Na
… % … (1:5) dS m
-1% g kg
-1mg kg
-1…… cmolc kg
-1……
Control 6.02 1.48 0.22 20.0 142.2 7.30 5.82 2.02 0.22
0 6.55 0.35 0.14 20.3 71.7 0.41 7.05 2.30 0.23
50 6.48 0.56 0.15 20.4 64.8 0.71 6.99 2.30 0.33
100 6.72 0.85 0.17 20.0 71.4 0.99 7.01 2.23 0.40
150 6.44 1.57 0.20 20.0 70.1 1.08 6.82 1.93 0.43
200 6.32 1.65 0.25 19.9 68.1 1.41 6.83 2.07 0.56
400 6.45 1.75 0.35 20.0 68.3 2.30 6.93 2.02 0.77
Soil EC, T-N and exchangeable K and Na show tendency of as the amount of LPM treatment increase, so the amount of content increase. In 400% treatment compared to 100% treatment, it is appeared that EC was 2.1 times, T-N was 2.1 times, K was 2.3 times, Na was 1.9 times increased. According to Yang and others (2008) have reported that as the amount of swine manure application is more, so the content of EC, exchangeable cation increase, and Park and others (2010) reported similar tendency too, that in tomato cultivation, the application of compost and Liquid fertilizer augmented the exchangeable K and others after the grow.
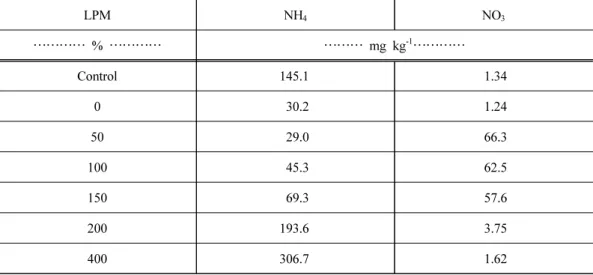
The result of investigation of ammonia nitrogen (NH
4) and nitrate nitrogen (NO
3) for the
transition of nitrogen with LPM treatment is identical with Table 6. NH
4showed the similarity
with the report of Lowerance and others (1998) which reported that as the amount of LPM
treatment increase, so the NH
4in soil. In this test too, there was similar tendency that as the
amount of LPM treatment increased, so the content increased.
Table 6. NH
4and NO
3concentration as affected by liquid pig manure treatment in paddy soil
LPM NH
4NO
3………… % ………… ……… mg kg
-1…………
Control 145.1 1.34
0 30.2 1.24
50 29.0 66.3
100 45.3 62.5
150 69.3 57.6
200 193.6 3.75
400 306.7 1.62
The amount of NO
3content was decreased in 200, 400% treatment compared to 150%
treatment, whereas NH
4has rapidly increased. According to Yoon (1994), NH
4is a cation, adsorption rate in soil is stronger than NO
3, and NH
4within soil transitions into NO
3as time goes by. However because of the exceeding amount of treatment compared to area, it was not changed but stayed as NH
4form in the test period, and there is a report on animal manure annual dressing aggregate physical property of soil (Anzai, 1987; Ushio et al., 2000). As the results, it is considered that because of the exceeding amount of test application which worsens the physicochemical properties of soil and it will be advantageous to keep standard rate of fertilizer with the soil analysis and test accurately.
[Submitted, November. 2, 2015; Revised, December. 7, 2015; Accepted, December. 9, 2015]
References