Assessment of Integrated N 2 O Emission Factor for Korea Upland Soils Cultivated with Red Pepper, Soy Bean, Spring Cabbage,
Autumn Cabbage and Potato
Gun-Yeob Kim*, Un-Sung Na, Sun-Il Lee, Hyun-Cheol Jeong, Pil-Joo Kim 1 , Jong-Eun Lee 2 , Young-Ho Seo 3 , Jong-Sik Lee, Eun-Jung Choi, and Sang-Uk Suh
National Institute of Agricultural Sciences, Rural Development Administration, Wanju, 55365, Korea
1
Gyeongsang National University, Jinju, 52828, Korea
2
Chungcheongnam-do Agricultural Research and Extension Services, Yesan, 32418, Korea
3
Gangwondo Agricultural Research and Extension Services, Chuncheon, 24226, Korea
(Received: October 6 2016, Revised: November 14 2016, Accepted: November 15 2016)
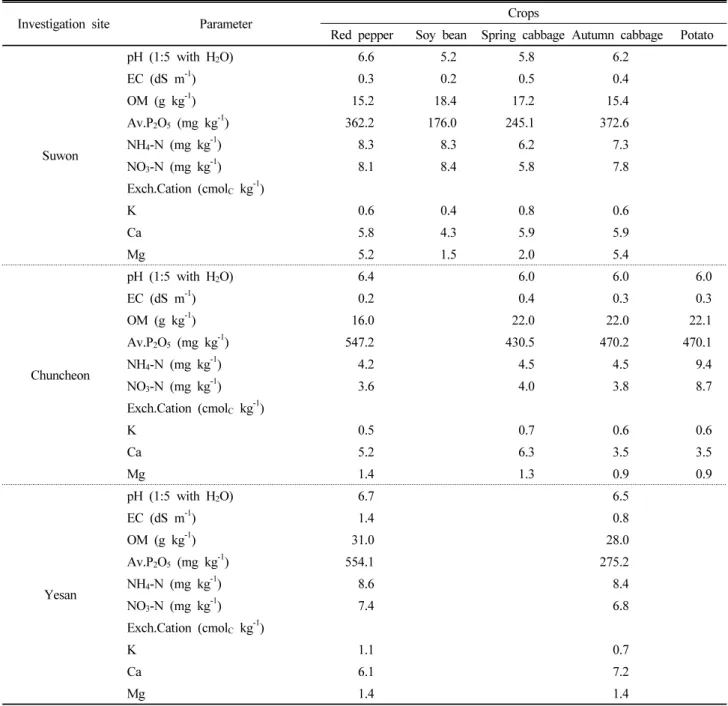
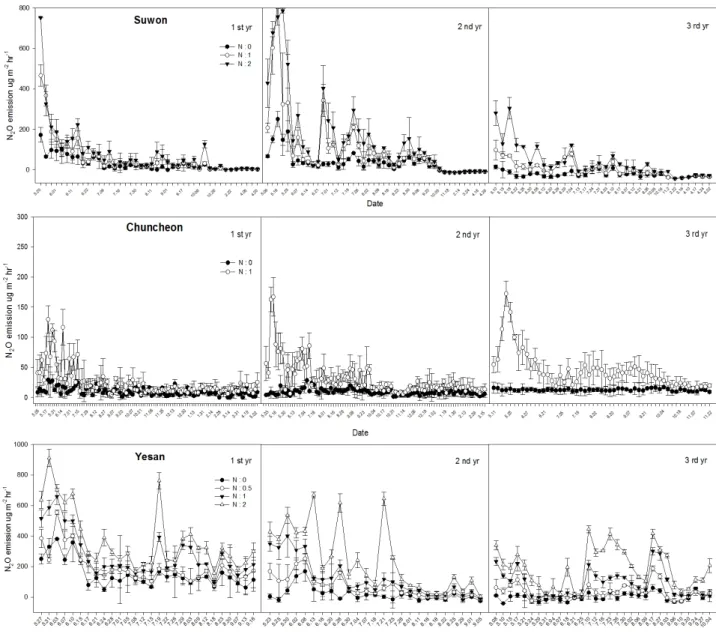
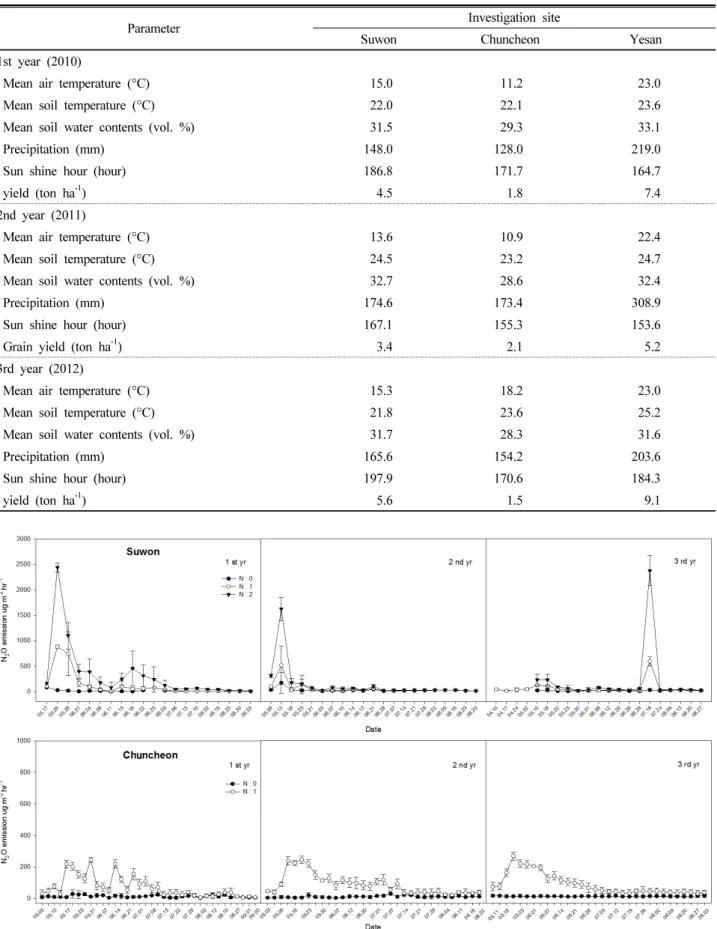
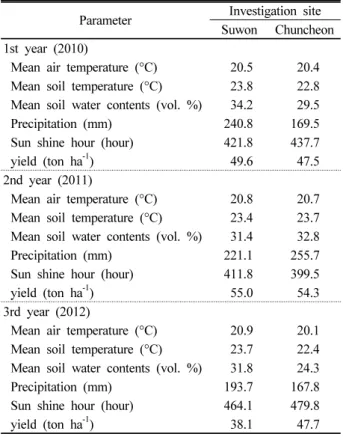
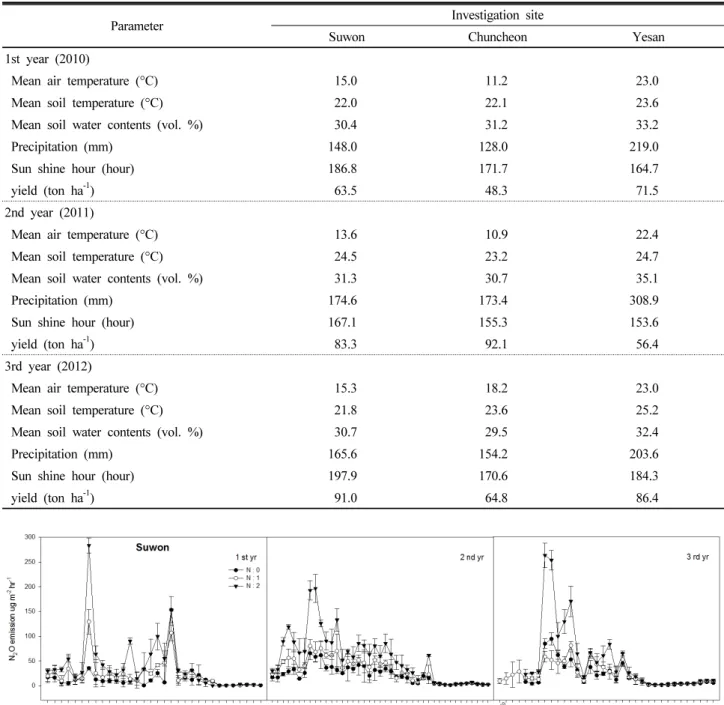
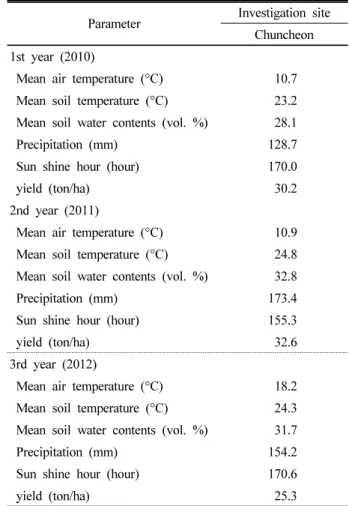
Greenhouse-gas emission factors are widely used to estimate emissions arising from a defined unit of a specific activity. Such estimates are used both for international reporting to the United Nations Framework Convention on Climate Change (UNFCCC) and for myriad national and sub-national reporting purposes (for example, European Union Emissions Trading Scheme; EU ETS). As with the other so-called 'Kyoto protocol GHGs', the Intergovernmental Panel on Climate Change (IPCC) provides a methodology for national and sub-national estimation of N 2 O emissions, based on the sector from which the emissions arise. The objective of this study was to develop a integrated emission factor to estimate the direct N 2 O emission from an agricultural field cultivated with the red pepper, soy bean, spring cabbage, autumn cabbage and potato in 2010
∼2012. Emission factor of N 2 O calculated using accumulated N 2 O emission, N fertilization rate, and background N 2 O emission over three year experiment was 0.00596±0.001337 kg N 2 O-N (N kg) -1 . More extensive studies need to be conducted to develop N 2 O emission factors for other upland crops in the various regions of Korea because N 2 O emission is influenced by many factors including climate characteristics, soil properties, and agricultural practices.
Key words: N 2 O emission factor, N 2 O emission, Upland soil
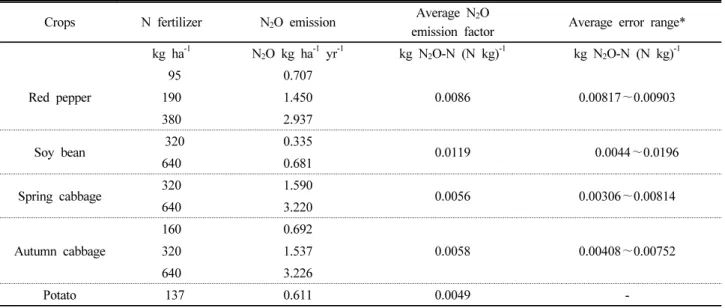
Relationships between the averaged N 2 O emissions and nitrogen fertilizer application rates during red pepper, soy bean, spring cabbage, autumn cabbage and potato cultivation in upland soil from 2010 to 2012.
1)
*Corresponding author: Phone: +82632382493, Fax: +82632383823, E-mail: [email protected]
§